3620
Perfusion Pattern Scores Associates with Disease Severity in Type 2 Diabetes1Department of Computer Science, State University of New York at Binghamton, Vestal, NY, United States, 2Computer Science, State University of New York at Binghamton, Vestal, NY, United States, 3Department of Neurology, Beth Israel Deaconess Medical Center, Harvard Medical School, Boston, MA, United States
Synopsis
Type 2 diabetes mellitus (T2DM) is associated with alterations in the blood brain barrier, neuronal damage, and arterial stiffness, thus affecting cerebral metabolism and brain perfusion. We develop a machine learning method to investigate T2DM-related covariance pattern and its association with cognitive performance/disease severity. Our pipeline is superior to the traditional method and the pattern-related individual scores are associated to diabetes severity variables, mobility and cognitive performance at baseline. Besides, the longitudinal score change is associated with change of HbA1c, and baseline cholesterol, indicating that this score is a promising biomarker for tracing the disease progression of individual T2DM patients.
Introduction
Type 2 diabetes mellitus (T2DM) is a metabolic disorder that increases the risk of cognitive impairment1, 2. T2DM has been associated with alterations in the blood brain barrier 3, 4, neuronal damage 5, and arterial stiffness 6, thus affecting cerebral metabolism and brain perfusion 7. Impaired cerebral hemodynamics is considered as a potential underlying cause of cognitive decline 8, 9. Therefore, studies linking brain perfusion with cognitive impairment in T2DM may reveal the mechanism of cognitive deficits. Several studies have studied the effect of T2DM on brain perfusion and attempted to correlate perfusion with cognitive performance but no consistency yet 10-17. We aim to identify T2DM-related brain covariance patterns with an improved discriminative value at the individual level by developing a method using pattern recognition and machine learning methods.
Methods
Participants were screened using medical history, autonomic function questionnaires, ECG and laboratory measures (blood, glucose and renal panels) at the Beth Israel Deaconess Medical Center (BIDMC). The cognitive assessment battery consists of measures of learning and memory (Hopkins Verbal Learning Test-Revised (HVLT-R)18 and Mini-Mental State Examination (MMSE)), measures of executive function (Verbal fluency (VF) 19, Trail Making (TM), Clock Drawing (CD)), and measures of attention (Digit Span (DS)). Participants also completed two 6-min walking tests indoor. The homeostatic model assessment (HOMA) of insulin resistance (HOMA: IR) was calculated as the product of fasting glucose times insulin levels divided by 405 20.
All 73 participants (41 T2DM) were scanned by 3D pseudo-continuous arterial spin labeling (PCASL) 21 sequence (resolution: 4×4×4mm3, matrix size: 64×64×40) and magnetization prepared rapid acquisition gradient echo (MP-RAGE) sequence (resolution: 0.94 0.94 3mm3, matrix size: 256 256 52) at a 3T GE HDxt scanner using a 8-channel head coil and a body coil. Forty-two participants (19 T2DM) who completed the two-year follow-up were included in the follow-up analyses.
Quantitative cerebral blood flow (CBF) images were calculated for each participant as previously described 22. The subtraction images were adjusted to standard space by co-registration and normalization and smoothed by 8mm Gaussian kernel.
Within our proposed classification pipeline, we performed 100 times 10-fold (total 1000 partitions) cross-validation. Within each fold, we used PCA on the demeaned training data for reduction and source separation (90% variance retained). The retained data plus a few basic variables (age, gender, hematocrit, and hypertension) served as feature set for backward stepwise search using the leave-one-out cross-validation. Selected features were inputted into a L2-regularized logistic regression with a grid search to tune the regularization term, 𝜆 to avoid overfitting. The model was evaluated by three measures (accuracy, area under curve (AUC), and positive predictive value (PPV)) directly on test dataset.
The feature set with best performance from cross-validation was used in final pattern model trained with the full dataset. Let PC be the selected features, and wPC be the weight vector associated with the features. Then T2DM-related pattern = wPC ⋅ PC. 500 runs of bootstrap estimation were applied to testify this pattern. The T2DM-related pattern scores and covariance pattern score changes were also calculated. For comparison purpose, a simpler LR classification model directly on all the voxels and basic variables was tried as well as the traditional univariate analysis in SPM8. The correlation was computed for both baseline score with clinical variables and score change with baseline variables.
Results and discussion
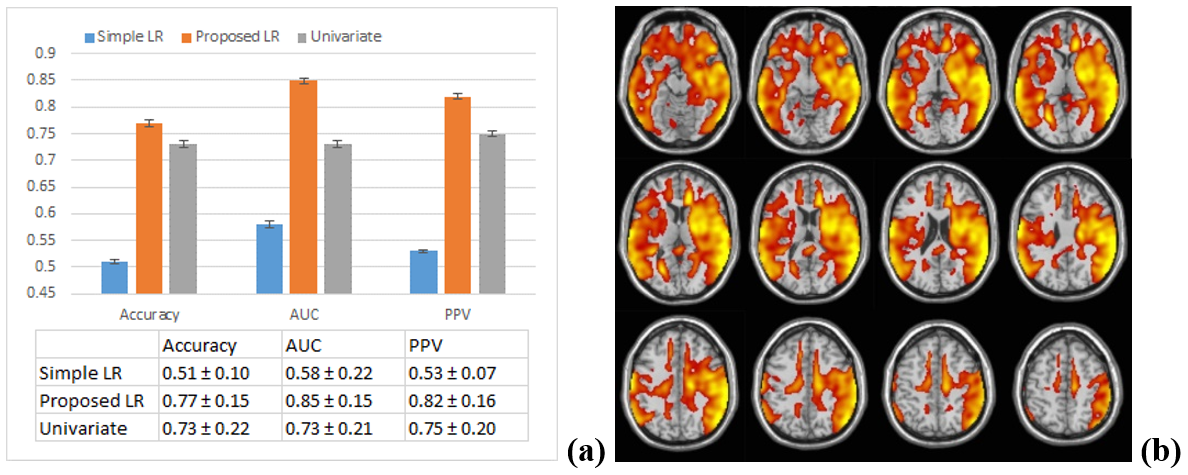
Using 𝜆 = 0.5, the test accuracy rate, test AUC, and test PPV for the proposed LR classification pipeline over performs those for the simple LR classification model and the univariate analysis (by 4%, 12%, and 7%) (Figure 1a). Our pipeline produced significantly larger means and smaller standard deviation, suggesting that this pipeline is more generalizable and captures more disease-related information.
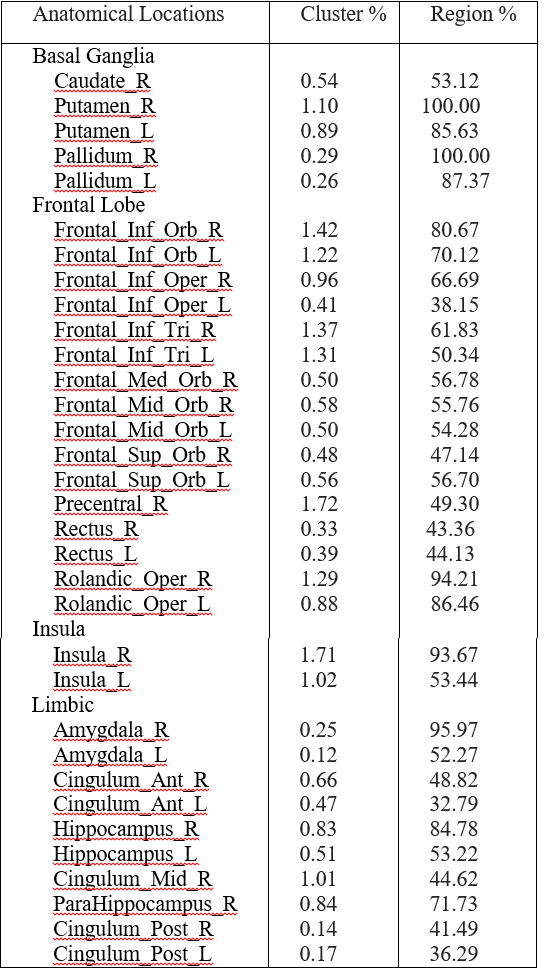
A T2DM-related covariance pattern was derived using bootstrap estimation procedure to show the effect of T2DM on perfusion (Figure 1b). It appears in regions including basal ganglia, insula, limbic, temporal lobes and regions of prefrontal cortex (Table 2).
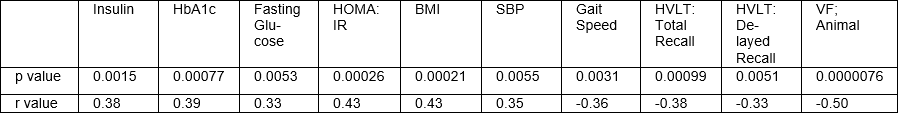
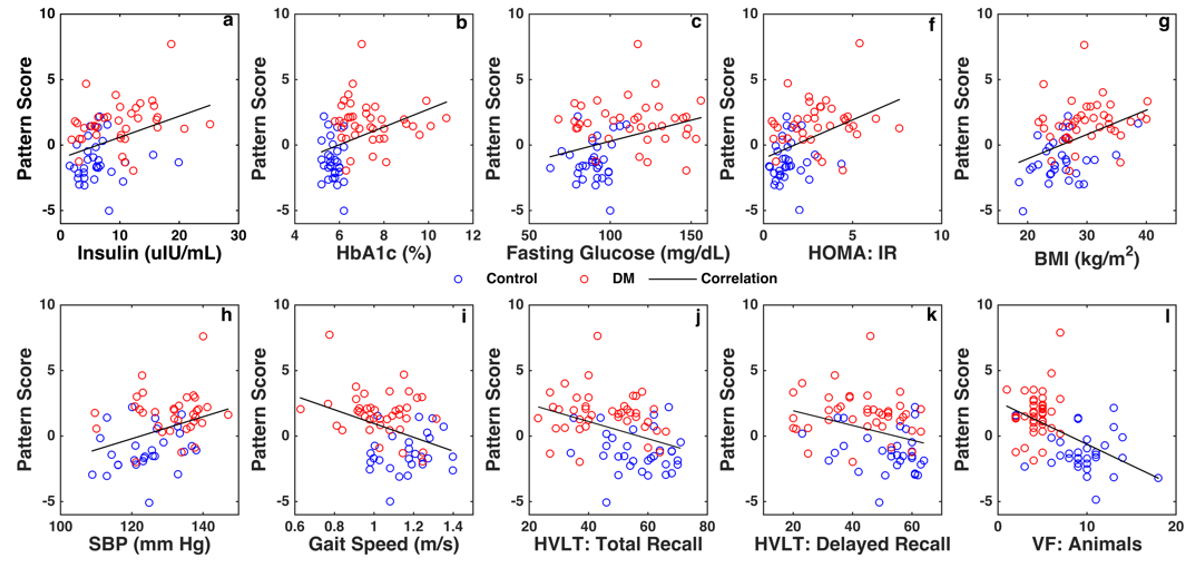
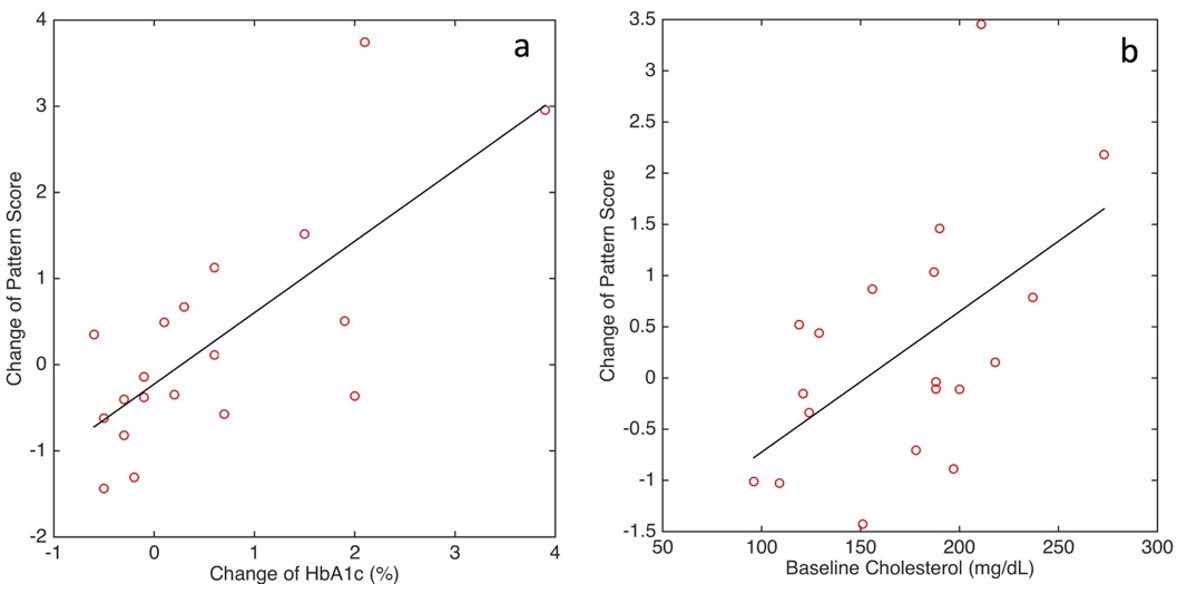
The individual covariance pattern scores were significantly correlated with participants’ basic variables, including insulin, HbA1c, fasting glucose, HOMA:IR, BMI, SBP, while the individual pattern scores were significantly correlated with mobility and cognitive functions: gait speed, HVLT: total recall, HVLT: delayed recall, and VF: animals. For all participants, the longitudinal covariance pattern score change was marginally associated with change of HbA1c between baseline and follow-up (p = 0.067, r = 0.30), and not associated with baseline cholesterol (p = 0.19, r = 0.22) (figure 3).
The pattern derived from above pipeline is promising to become a biomarker to trace the progression of type 2 diabetes at the individual level.
Acknowledgements
This work was supported by NIH-NIDDK 1R01DK103902-01A1 and NIH-NIA 1R01-AG0287601A2.References
1. Biessels GJ, Deary IJ, and Ryan CM, Cognition and diabetes: a lifespan perspective. Lancet Neurol, 2008;7(2):184-90.
2. Cukierman T, Gerstein HC, and Williamson JD, Cognitive decline and dementia in diabetes--systematic overview of prospective observational studies. Diabetologia, 2005;48(12):2460-9.
3. Starr JM, Wardlaw J, Ferguson K, MacLullich A, Deary IJ, and Marshall I, Increased blood-brain barrier permeability in type II diabetes demonstrated by gadolinium magnetic resonance imaging. J Neurol Neurosurg Psychiatry, 2003;74(1):70-6.
4. Mogi M and Horiuchi M, Neurovascular coupling in cognitive impairment associated with diabetes mellitus. Circ J, 2011;75(5):1042-8.
5. Umegaki H, Type 2 diabetes as a risk factor for cognitive impairment: current insights. Clin Interv Aging, 2014;9:1011-9.
6. Zhou H, Zhang X, and Lu J, Progress on diabetic cerebrovascular diseases. Bosn J Basic Med Sci, 2014;14(4):185-90.
7. Roberts RO, Knopman DS, Cha RH, Mielke MM, Pankratz VS, Boeve BF, Kantarci K, Geda YE, Jack CR, Jr., Petersen RC, and Lowe VJ, Diabetes and elevated hemoglobin A1c levels are associated with brain hypometabolism but not amyloid accumulation. J Nucl Med, 2014;55(5):759-64.
8. Brundel M, van den Berg E, Reijmer YD, de Bresser J, Kappelle LJ, Biessels GJ, and Utrecht Diabetic Encephalopathy Study g, Cerebral haemodynamics, cognition and brain volumes in patients with type 2 diabetes. J Diabetes Complications, 2012;26(3):205-9.
9. Xia W, Wang S, Rao H, Spaeth AM, Wang P, Yang Y, Huang R, Cai R, and Sun H, Disrupted resting-state attentional networks in T2DM patients. Sci Rep, 2015;5:11148.
10. Tiehuis AM, Vincken KL, van den Berg E, Hendrikse J, Manschot SM, Mali WP, Kappelle LJ, and Biessels GJ, Cerebral perfusion in relation to cognitive function and type 2 diabetes. Diabetologia, 2008;51(7):1321-6.
11. Nagamachi S, Nishikawa T, Ono S, Ageta M, Matsuo T, Jinnouchi S, Hoshi H, Ohnishi T, Futami S, and Watanabe K, Regional cerebral blood flow in diabetic patients: evaluation by N-isopropyl-123I-IMP with SPECT. Nucl Med Commun, 1994;15(6):455-60.
12. Sabri O, Hellwig D, Schreckenberger M, Schneider R, Kaiser HJ, Wagenknecht G, Mull M, and Buell U, Influence of diabetes mellitus on regional cerebral glucose metabolism and regional cerebral blood flow. Nucl Med Commun, 2000;21(1):19-29.
13. Rusinek H, Ha J, Yau PL, Storey P, Tirsi A, Tsui WH, Frosch O, Azova S, and Convit A, Cerebral perfusion in insulin resistance and type 2 diabetes. J Cereb Blood Flow Metab, 2015;35(1):95-102.
14. Novak V, Zhao P, Manor B, Sejdic E, Alsop D, Abduljalil A, Roberson PK, Munshi M, and Novak P, Adhesion molecules, altered vasoreactivity, and brain atrophy in type 2 diabetes. Diabetes Care, 2011;34(11):2438-41.
15. Last D, Alsop DC, Abduljalil AM, Marquis RP, de Bazelaire C, Hu K, Cavallerano J, and Novak V, Global and regional effects of type 2 diabetes on brain tissue volumes and cerebral vasoreactivity. Diabetes Care, 2007;30(5):1193-9.
16. Xia W, Rao H, Spaeth AM, Huang R, Tian S, Cai R, Sun J, and Wang S, Blood Pressure is Associated With Cerebral Blood Flow Alterations in Patients With T2DM as Revealed by Perfusion Functional MRI. Medicine, 2015;94(48):e2231.
17. Jansen JF, van Bussel FC, van de Haar HJ, van Osch MJ, Hofman PA, van Boxtel MP, van Oostenbrugge RJ, Schram MT, Stehouwer CD, Wildberger JE, and Backes WH, Cerebral blood flow, blood supply, and cognition in Type 2 Diabetes Mellitus. Sci Rep, 2016;6(1):10.
18. Shapiro AM, Benedict RH, Schretlen D, and Brandt J, Construct and concurrent validity of the Hopkins Verbal Learning Test-revised. Clin Neuropsychol, 1999;13(3):348-58.
19 . Benton AL and Hamsher K, Multilingual Aphasia Examination. Manual of instructions (2nd ed). 1989, Iowa City: AJA Associates.
20. Matthews DR, Hosker JP, Rudenski AS, Naylor BA, Treacher DF, and Turner RC, Homeostasis model assessment: insulin resistance and beta-cell function from fasting plasma glucose and insulin concentrations in man. Diabetologia, 1985;28(7):412-9.
21. Dai W, Garcia D, de Bazelaire C, and Alsop DC, Continuous flow-driven inversion for arterial spin labeling using pulsed radio frequency and gradient fields. Magn Reson Med, 2008;60(6):1488-97.
22. Buxton RB, Frank LR, Wong EC, Siewert B, Warach S, and Edelman RR, A general kinetic model for quantitative perfusion imaging with arterial spin labeling. Magn Reson Med, 1998;40:383-96.
Figures