3617
Multi-delay Simultaneous-Multi-Slice pCASL Imaging of Acute Treatment Effects of Ketamine in Major Depression1Laboratory of FMRI Technology (LOFT), Mark & Mary Stevens Neuroimaging and Informatics Institute, Keck School of Medicine, University of Southern California (USC), Los Angeles, CA, United States, 2Departments of Neurology, Psychiatry and Biobehavioral Sciences, Geffen School of Medicine at the University of California Los Angeles (UCLA), Westwood, CA, United States
Synopsis
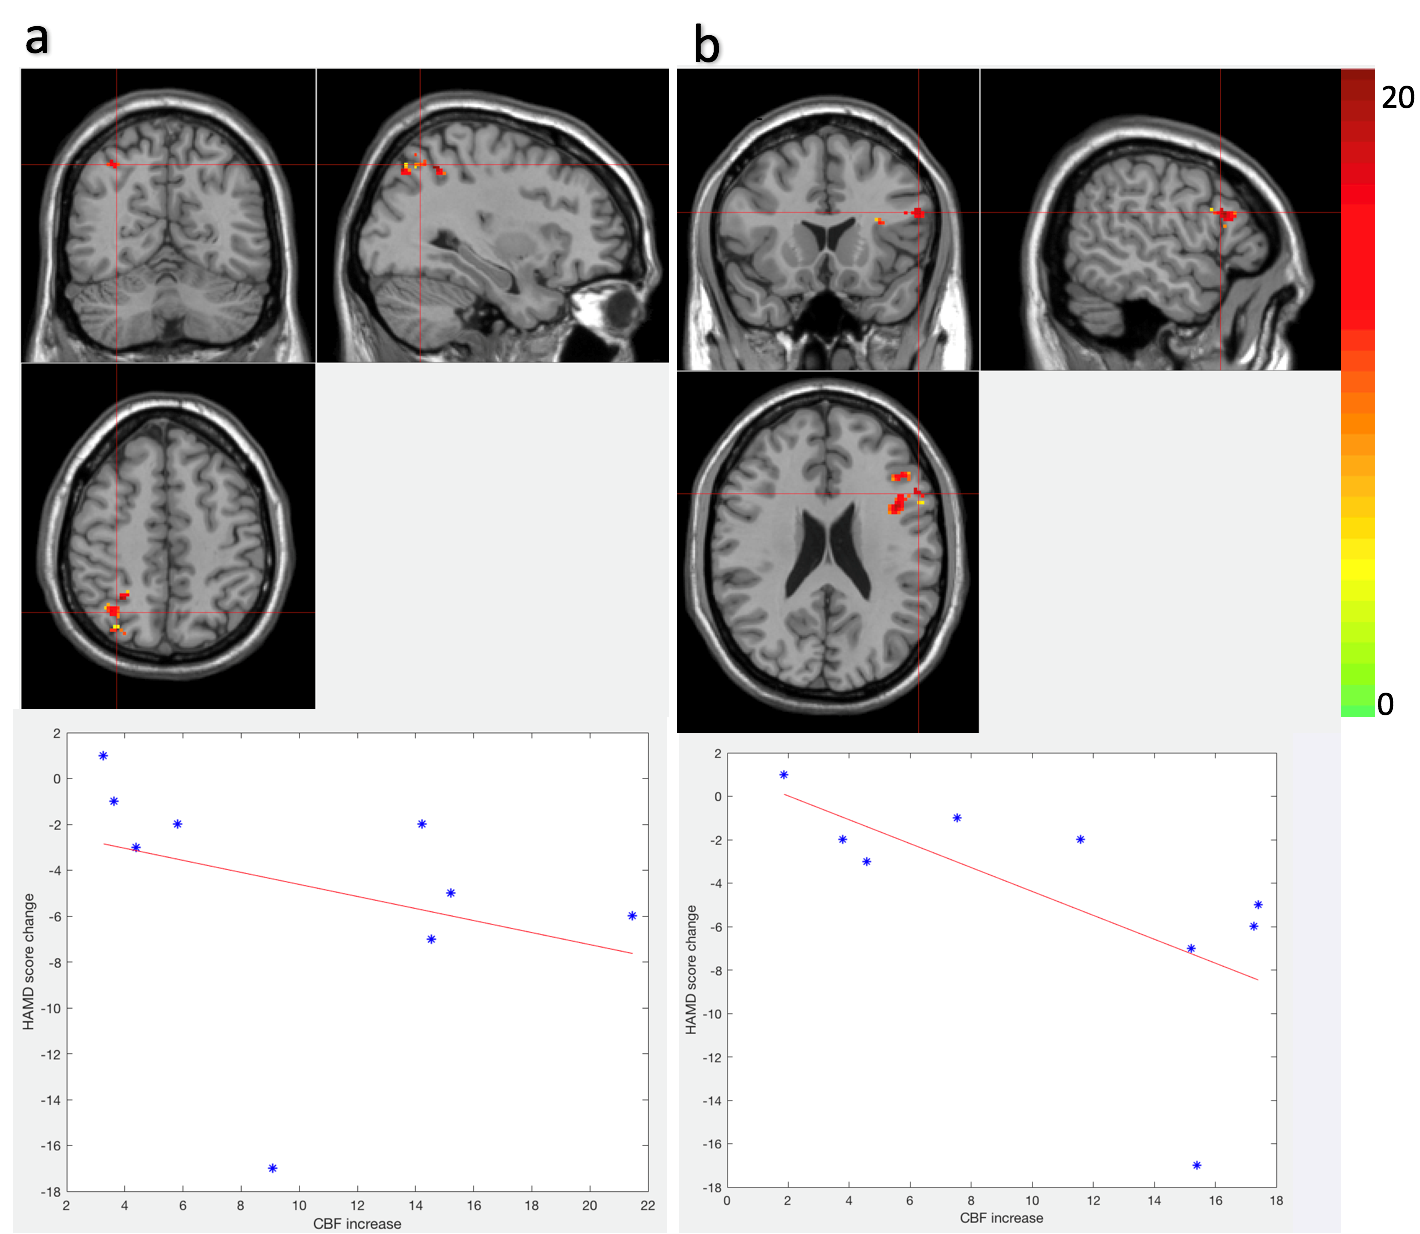
Sub-anesthetic dose of ketamine elicit acute and robust antidepressant effects, however the mechanism is still less understood. With a state-of-the-art Simultaneous Multislice EPI pCASL sequence, whole-brain rCBF and Arterial Transit Time (ATT) maps were acquired pre and post intravenous infusion of ketamine. Eight clusters were detected with significant CBF change, two of which (one in left inferior frontal gyrus, the other in right parietal lobe) were significantly correlated ( r=-0.7, p=0.04; r=-0.74, p=0.03 respectively) with Hamilton Depression rating score. This study suggests that possible mechanism of the antidepressant effects of ketamine is to increase CBF of certain mood- and attention-related brain regions.
Introduction
Though depression is the world’s leading cause of disability, conventional antidepressant treatments usually take weeks to months to work, and are only moderately successful. When administered at a sub-anesthetic dose, ketamine, an NMDA receptor antagonist, is shown to elicit acute and robust antidepressant effects[1,2]. Regional Cerebral Blood Flow (rCBF) is a surrogate marker of regional brain function, and may serve as a marker for the antidepressant effects of ketamine, which are less understood. In this study, a state-of-the-art Simultaneous Multislice (SMS) EPI pCASL sequence was used to examine the change of rCBF and Arterial Transit Time (ATT) pre, and at 24 hours post intravenous infusion of ketamine.Method
Data acquisition: Ten subjects with major depression were recruited for ketamine treatment as part of a Human Connectome Disease project, following an IRB approved protocol. At both time points, a SMS EPI pCASL sequence with five post-label-delays (PLD) was acquired with the following parameters: TR/TE = 3594/19ms, 60 slices (thickness = 2.3mm with 0.2mm gap), FOV = 215$$$\times $$$215mm, voxel size = 2.5$$$\times $$$2.5$$$\times $$$2.5mm3, matrix size = 86$$$\times$$$86, slice acceleration factor=6, PLDs= 200, 700, 1200, 1700, 2200ms. Total scan time = 5min30s.
Image preprocessing: Motion correction was performed with rigid head alignment in SPM12 and framewise displacement (FD)[3] was used to identify and discard frames indicating severe motion. Subjects with more than 20% discarded frames were excluded, leaving 9 subjects for further analyses. A principal component analysis (PCA)-based algorithm[4] was performed to further remove residual motion artifacts and physiological noise.
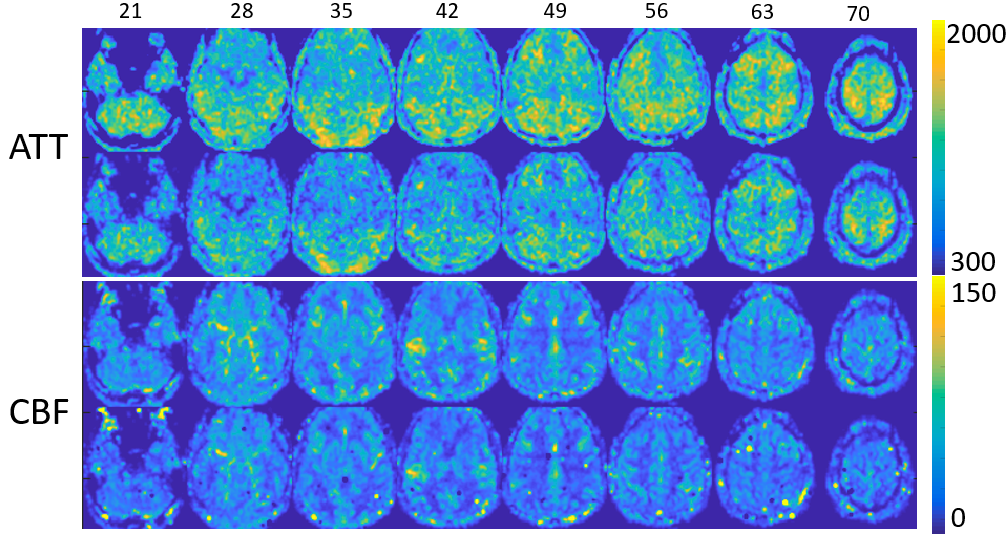
Parameter calculation: rCBF and ATT were calculated by both the weighted-delay (WD) method and parameter fitting method, described in [5]. For the WD method, a WD was calculated by Eq.(1) and converted into ATT($$$\delta $$$) based on the theoretical monotonic function between WD and ATT[6]$$WD=\left [ \sum_{i=1}^{5}w(i)\Delta M(i) \right ]/\left [ \sum_{i=1}^{5}\Delta M(i) \right ] (1)$$where w(i) is the PLDs. CBF at each delay f(i) was calculated by Eq. (2)$$f(i)=\frac{\lambda \Delta M(i)R_{1a}}{2\alpha M_{0}[exp((min(\delta -w(i),0)-\delta )R_{1a})-exp(-(\tau +w(i))R_{1a})]} (2)$$The final CBF was the mean of the estimated CBF at each PLD. For the fitting method, 5 PLDs enabled us to fit CBF and ATT at the same time based on Eq. (2). rCBF and ATT maps were then co-registered with T1w structural MRI and normalized to the MNI template using SPM12, and spatially smoothed using a Gaussian kernel of FWHM=4mm.
Statistical analysis: Voxel-wise Wilcoxon signed-rank tests were performed for each patient between CBF/ATT of pre- and post-ketamine visits, and results were further corrected for multiple comparisons by Alpha-Sim (p<0.05). For clusters with significant change pre- to post infusion, average signal change of each cluster was extracted to calculate the Spearman’s rank correlation with change in the Hamilton Depression (HAMD) rating score also measured pre- and post-ketamine.
Results
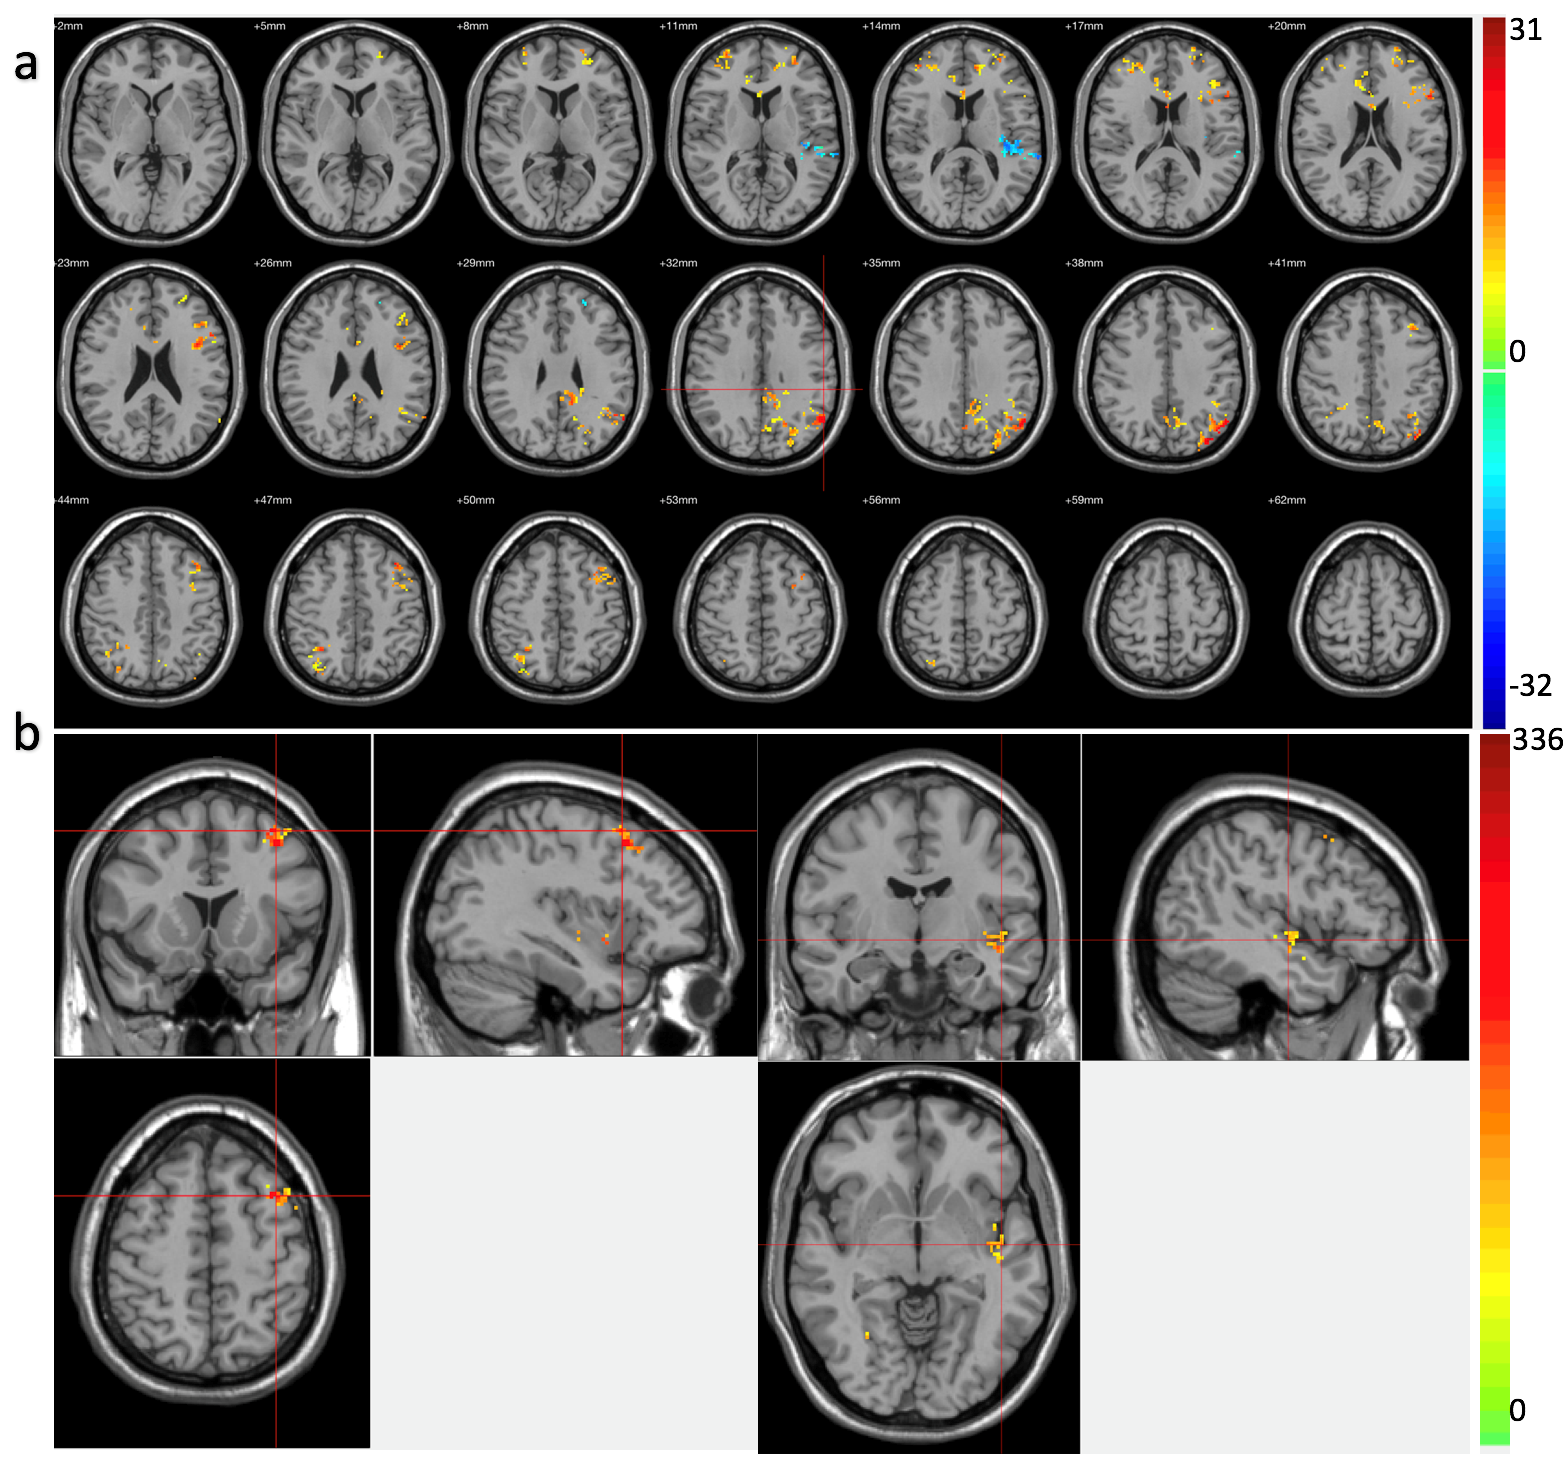
ATT and CBF maps calculated based on the WD method and parameter fitting methods showed high similarity (Fig.1) (r=0.95 p<0.001, r=0.79 p<0.001 for ATT and CBF respectively). Thus, due to their theoretically higher accuracy, only results based on the curve fitting method are reported. Clusters with significant CBF/ATT difference pre- and post-ketamine are shown in Fig.2. Eight CBF clusters were detected, of which seven showed increased CBF; two clusters showed ATT increases post- compared to pre-ketamine baseline. Of the clusters showing significant changes in CBF across time, two were significantly correlated with change in HAMD mood ratings (Fig. 3); correlations with mood were absent for ATT.Discussion
To the best of our knowledge, this is the first study using multi-delay SMS EPI pCASL to examine the treatment effects of ketamine in major depression. A multi-delay SMS EPI pCASL sequence was used to fit both CBF and ATT, which is less sensitive to motion compared with segmented 3D acquisitions such as GRASE and stack-of-spirals, while acquiring images more efficiently (6 slices at a time) with a high spatial resolution. The two clusters (left IFG and right parietal cortex) showing significant correlations between change in CBF with change in mood, are known to be related to attention and emotion control[7,8,9] that may thus contribute to ketamine’s therapeutic effects. Other clusters may be related to the nonspecific or vascular effects of ketamine or other features of depression not explicitly probed. Due to the small sample size, these results need to be replicated in larger samples. Understanding how ketamine influences brain physiology may be important for targeting rapid response as a feature of more successful antidepressant treatment.Acknowledgements
This study was supported by the US National Institute of Mental Health grant U01MH110008 and U01MH109589.References
[1] Fond, G., Loundou, A., Rabu, C., Macgregor, A., Lançon, C., Brittner, M., ... & Roger, M. (2014). Ketamine administration in depressive disorders: a systematic review and meta-analysis. Psychopharmacology, 231(18), 3663-3676.
[2] Newport, D. J., Carpenter, L. L., McDonald, W. M., Potash, J. B., Tohen, M., Nemeroff, C. B., & APA Council of Research Task Force on Novel Biomarkers and Treatments. (2015). Ketamine and other NMDA antagonists: early clinical trials and possible mechanisms in depression. American Journal of Psychiatry, 172(10), 950-966.
[3] Power, J. D., Barnes, K. A., Snyder, A. Z., Schlaggar, B. L., & Petersen, S. E. (2012). Spurious but systematic correlations in functional connectivity MRI networks arise from subject motion. Neuroimage, 59(3), 2142-2154.
[4] Shao X, Tisdall MD, Wang DJ, van der Kouwe AJ. Prospective motion correction for 3D GRASE pCASL with volumetric navigators. International Society for Magnetic Resonance in Medicine; 2017. p. 0680.
[5] Wang, D. J., Alger, J. R., Qiao, J. X., Gunther, M., Pope, W. B., Saver, J. L., ... & UCLA Stroke Investigators. (2013). Multi-delay multi-parametric arterial spin-labeled perfusion MRI in acute ischemic stroke—comparison with dynamic susceptibility contrast enhanced perfusion imaging. NeuroImage: Clinical, 3, 1-7.
[6] Dai, W., Robson, P. M., Shankaranarayanan, A., & Alsop, D. C. (2012). Reduced resolution transit delay prescan for quantitative continuous arterial spin labeling perfusion imaging. Magnetic resonance in medicine, 67(5), 1252-1265.
[7] Swick, D., Ashley, V., & Turken, U. (2008). Left inferior frontal gyrus is critical for response inhibition. BMC neuroscience, 9(1), 102.
[8] Beer, J. S., Knight, R. T., & D'Esposito, M. (2006). Controlling the integration of emotion and cognition: the role of frontal cortex in distinguishing helpful from hurtful emotional information. Psychological Science, 17(5), 448-453.
[9] Kennedy, S. H., Evans, K. R., Krüger, S., Mayberg, H. S., Meyer, J. H., McCann, S., ... & Vaccarino, F. J. (2001). Changes in regional brain glucose metabolism measured with positron emission tomography after paroxetine treatment of major depression. American Journal of Psychiatry, 158(6), 899-905.
Figures