3614
Neurological symptoms and pathology in patients with newly-diagnosed, “classical” coeliac disease1University of Sheffield, Sheffield, United Kingdom, 2Cardiff University, Cardiff, United Kingdom
Synopsis
Coeliac disease is known to cause neurological problems, although these are not well recognised by healthcare professionals. In this prospective study of 100 newly-diagnosed patients with classical coeliac disease, we show 67% to have neurological symptoms, and 46% to have abnormal NAA/Cr values by MR Spectroscopy investigation. Further, we demonstrate how participants with positivity to transglutaminase 6, an auto-antibody suggested to be involved in neuro-pathology of gluten-related disorders, are more likely to suffer these. Finally, we present a volumetric analysis showing subcortical atrophy in this sub-group. This study highlights the prevalence, and potential mechanisms, of neurological involvement in coeliac disease.
Introduction
Coeliac Disease (CD) is characterised by an autoimmune response to gluten, leading to intestinal pathology in genetically-susceptible individuals. While a variety of neurological presentations have been reported, these go largely unrecognised by the public and many healthcare professionals. CD patients (from gastrointestinal1 or neurological2 referrals) may suffer balance disturbances, headaches, peripheral neuropathy, as well as MR imaging showing white matter abnormalities, and evidence of brain atrophy in cerebellar and subcortical locations when compared to healthy controls. Neurological presentations of gluten-related autoimmunity are well described without bowel symptoms; gluten ataxia is the commonest and is associated with cerebellar atrophy. CD and gluten ataxia are known to be associated with autoantibodies to different transglutaminases (TG2 and TG6, respectively), but TG6 positivity is still reported in 32% of CD patients3, suggesting overlapping pathologies.
We sought to establish the prevalence of neurological symptoms in CD patients, presenting with classical CD, at the time of diagnosis. We investigated if underlying brain changes were present and if these were related to TG6 positivity.
Methods
100 newly-diagnosed CD patients, without any known pre-existing neurological condition, were consecutively recruited from a gastrointestinal clinic immediately after duodenal biopsy confirmed their diagnosis. Participants underwent neurological examination by a consultant neurologist, serology for TG6 (available in 98 participants), and MRI on a 3T Philips Ingenia scanner (available in 96 participants). This included a 3D T1W “MP-RAGE” sequence (TR/TE=10.5/4.8ms, 0.8cm3 resolution), and an MR spectroscopy “PRESS” sequence (TR/TE=2000/144ms, 128 measurements, 1024 spectral points, 2000Hz bandwidth) involving two 2x1x2cm voxels placed in the cerebellar vermis/hemisphere.
The prevalence of neurological symptoms and TG6 positivity was defined across the sample. Spectroscopy data were processed using the scanner’s proprietary software with standard steps (water suppression, manual phase correction etc.) to gain NAA/Cr ratios. The number of participants with abnormal spectroscopy was calculated (based on a previously described cut-off method4).
Analyses were then stratified by TG6 positivity. Chi-Squared analysis compared frequency of patients with key symptoms by TG6. Volumetric analyses on the T1W images obtained normalised brain volume (NBV) of cerebral and cerebellar grey matter (GM) ROIs using Freesurfer and the cerebellum-dedicated “SUIT”5 pipelines, respectively. Cortical cerebellar/cerebral, and subcortical GM NBV were compared between TG6+/TG6- participants by independent t-test. Significant findings were further interrogated by age-controlled ANOVAs of the NBV of the significant ROI, and its sub-regions. Shape analysis of significant subcortical regions was conducted using FSL’s FIRST “Vertex” pipeline.
Results
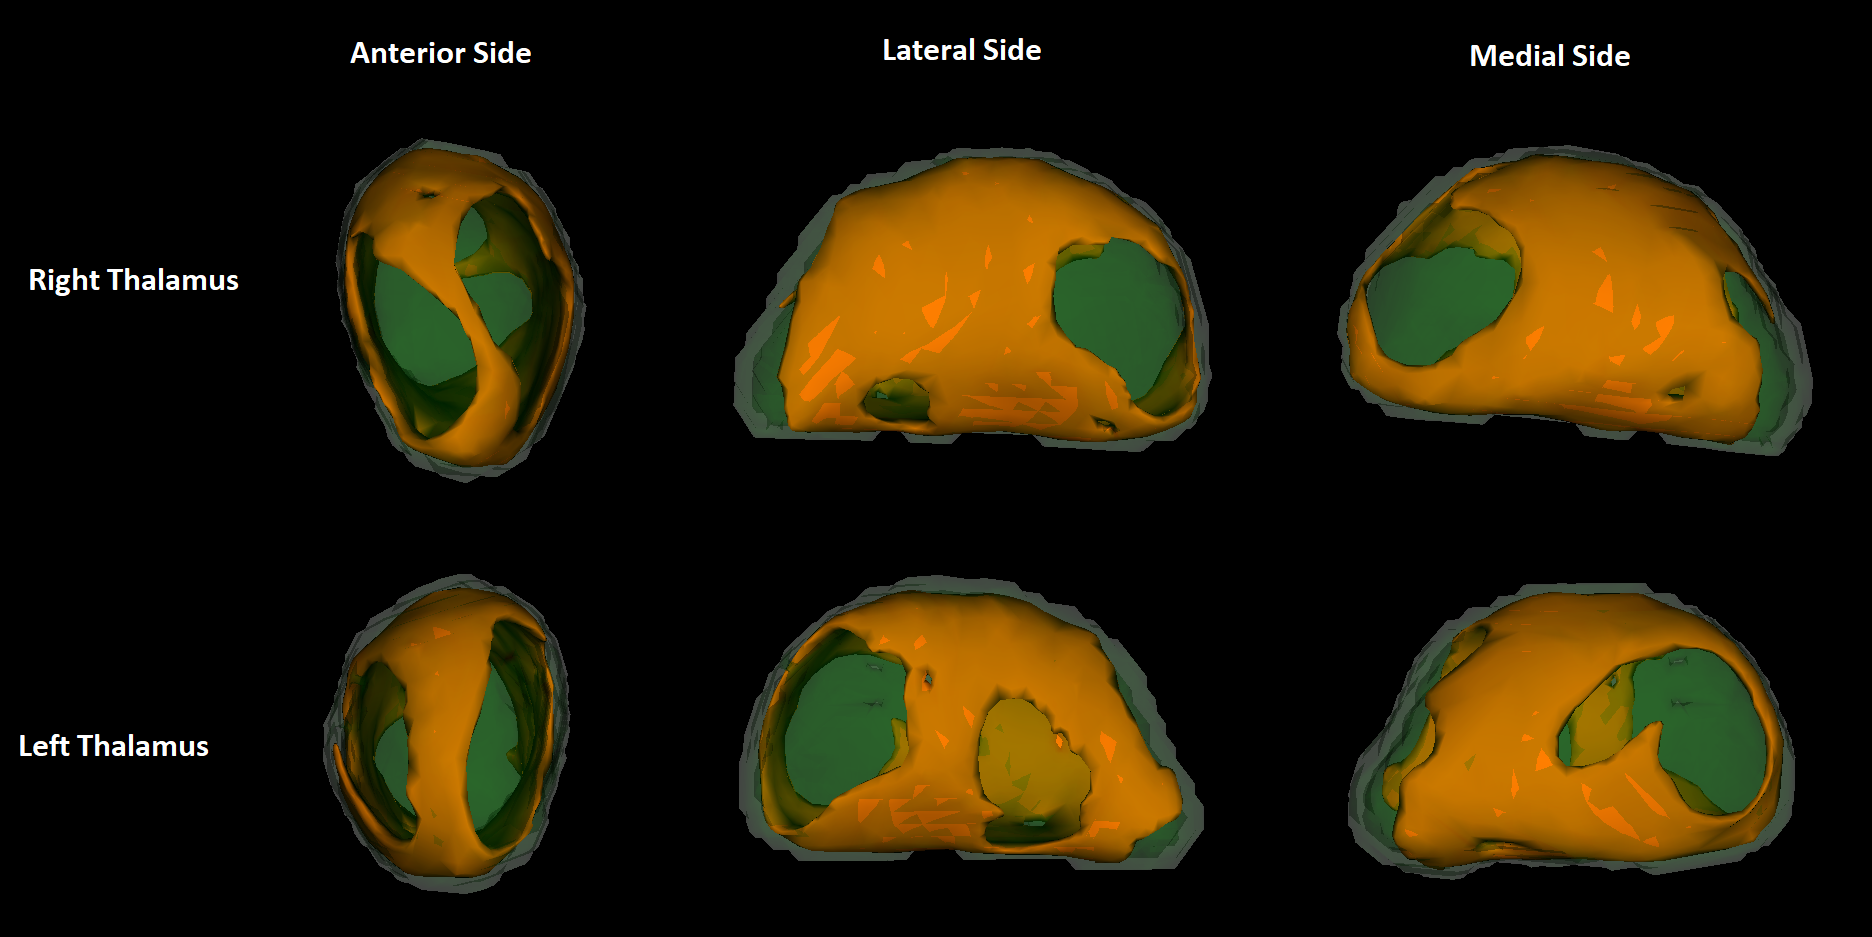
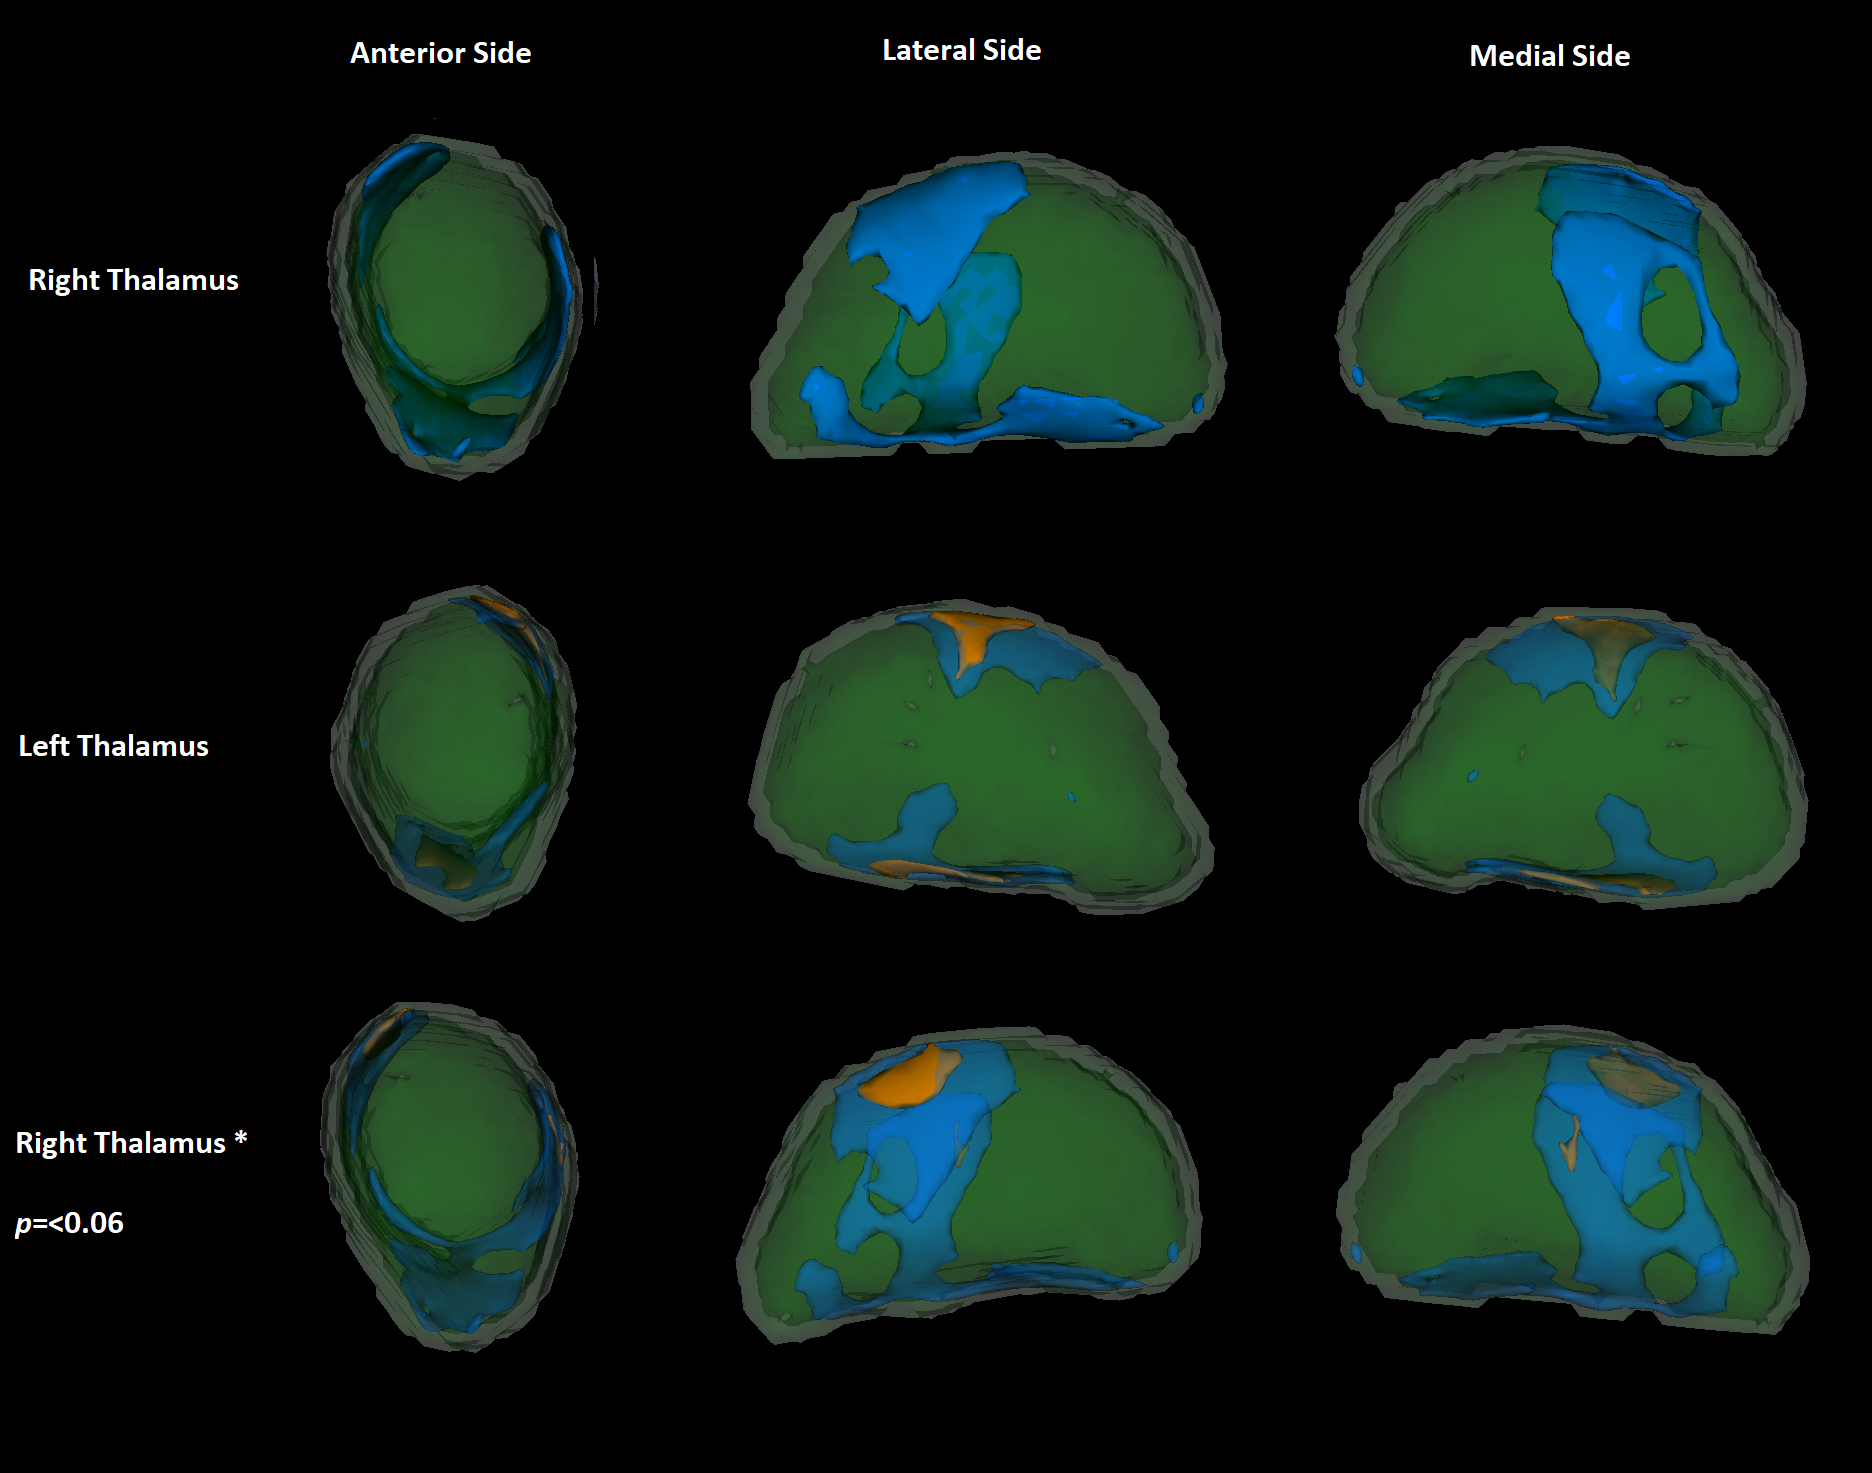
Mean(SD) participant age was 43(15) years. Patient’s history/clinical examinations revealed balance problems, frequent headaches, nystagmus and sensory disturbances. Excluding headaches, 50% of participants had an indication of neurological dysfunction (67% with headaches). 46% of participants had abnormal NAA/Cr ratios; 82/57% of these had abnormal vermis (≤0.95) / hemispheric (≤0.99) values, respectively, with 36% having both.40% of participants had TG6 positivity. An independent t-test showed these were older (mean(SD) TG6+= 46.7(14.8), TG6-= 40.3(14.8), p=0.043). Chi-squared analysis between TG6 groups showed no difference in the incidence of balance problems, but did show that those with balance problems and/or abnormal spectroscopy were significantly more often TG6+ (74%) than TG6- (46%, p=0.007).A t-test comparison showed that the subcortical, and cerebellar GM (but not the cerebral cortex) NBV was significantly lower in TG6+ participants. Age-corrected ANOVAs repeating these analyses (and investigating sub-regions), showed that the NBV of the overall subcortical ROI (mean(SD) TG6+= 3.403(0.193), TG6-= 3.503(0.192), p=0.045), as well as the thalamus specifically (mean(SD) TG6+= 0.928(0.066), TG6-= 0.973(0.085), p=0.035), were significantly lower in TG6+ participants. Of note, 3 cerebellar sub-regions were also approaching significance (all p≤0.065). “Vertex” analysis of the thalamus employed a “2 group difference” model between TG6 groups via FSL’s “randomise” using “TFCE” correction. Without age correction, this showed an overall widespread pattern of atrophy with relative sparing of the anterior/pulvinar nuclei (Figure 1). With age correction, a significant locus around the lateral/ventral posterior nuclei was found (Figure 2).
Discussion
These findings demonstrate a high prevalence of neurological symptoms in newly-diagnosed CD patients (with classical, gastrointestinal CD). Further, MRI demonstrated more direct evidence of neuro-pathology in these patients. Spectroscopy showed a large proportion to have abnormal cerebellar biochemical functioning. TG6+ participants showed a high incidence of balance problems/low NAA/Cr values, and lower subcortical (particularly thalamic) NBV.Conclusions
This large prospective study has highlighted the prevalence of neurological symptoms in CD patients, and used MRI techniques to demonstrate both evidence of underlying brain changes and the use of TG6 as a marker of these.Acknowledgements
This work was supported by Coeliac UK and the Bardhan Research and Education Trust (BRET)References
1. Briani C, Zara G, Alaedini A, et al. Neurological complications of celiac disease and autoimmune mechanisms : A prospective study. J Neuroimmunol 2008;195(1–2):171–5.
2. Currie S, Hadjivassiliou M, Clark MJ, et al. Should we be “nervous” about coeliac disease? Brain abnormalities in patients with coeliac disease referred for neurological opinion. J Neurol Neurosurg Psychiatry 2012;83(12):1216–21.
3. Hadjivassiliou M, Aeschlimann P, Sanders DS, et al. Transglutaminase 6 antibodies in the diagnosis of gluten ataxia. Neurology 2013;80(19):1740–5.
4. Hadjivassiliou M, Grunewald RA, Sanders DS, Shanmugarajah P, Hoggard N. Effect of gluten-free diet on cerebellar MR spectroscopy in gluten ataxia. Neurology 2017 (epub ahead of print)
5. Diedrichsen J. A spatially unbiased atlas template of the human cerebellum. Neuroimage 2006;33(1):127–38.
Figures