3613
Microstructural and metabolism changes in the longitudinal progression of white matter hyperintensity1Second Affiliated Hospital of Zhejiang University, School Of Medicine, Hangzhou, China
Synopsis
To evaluate the microstructural and metabolism property in the white matter that later become white matter hyperintensity (WMH), and the property of WMH that later disappeared. And we discovered that there is a dynamic change in microstructural and metabolism in WMH. Metabolism in NAWM will start to decline rapidly to a point where microstructure will then start to deteriorate.
Introduction:
White matter hyperintensity (WMH) is a marker of cerebral small vessel disease (CSVD). It is highly prevalent among the elderly. But until now, the mechanisms underlying normal appearing white matter (NAWM) developing into white matter hyperintensity is still not fully understood. Furthermore, it has been demonstrated1,2 that the progression of WMH may be more dynamic than we previously realized, and that there could be regression in WMH volume, which referred to WMH areas that later appeared normal (thereafter referred as “shrinking WMH”). In the current study, we evaluated the microstructural and metabolism property in the white matter that later become white matter hyperintensity (WMH), and the property of WMH that later disappeared.Methods:
40 elderly subjects with 2-year follow-up were included in our study. Each subject had completed 3DT1, T2FLAIR, DTI and FDG-PET scans. White matter was classified into: constant WMH (WMH at both time points), growing WMH (NAWM at baseline but subsequently developed into WMH), shrinking WMH (WMH at baseline and subsequently developed into NAWM) and NAWM. The average DTI (FA and MD) and FDG-PET (Standardized rSUV) of each of the above-mentioned region were extracted and compared.Statistical Analyses:
ANOVA test and post-hoc analysis were first used to determine the differences in FA, MD and rSUV value between difference regions (Constant, growing and shrinking WMH and NAWM). A pair-wise t-test between the baseline and follow-up parameters in each region were done to determine if there was significant progression of parameters in each region. Furthermore, repetitive measurements ANOVA were performed to compare if there are group differences between the progressions of each parameters in each regions. Pearson correlations were used to determine the possible correlation between shrinking and growing WMH with brain volume alteration.Results:
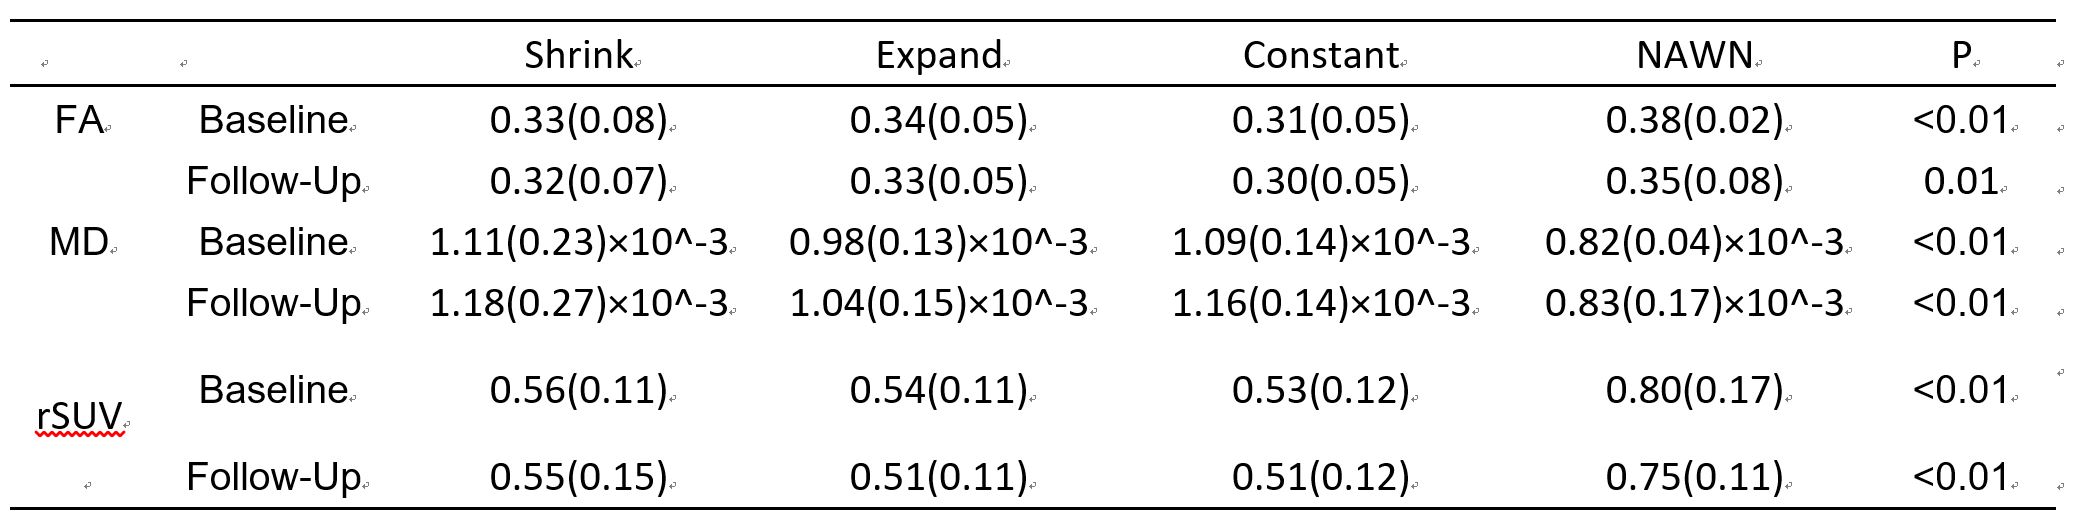
The average age of our subjects was 73(±6.5) year-old and included 35% of female subjects. The average follow-up year was 2.08(±0.09) year. ANOVA test and the following post-hoc analysis of baseline FA, MD and standardized rSUV between different regions (constant, growing, shrinking WMH and NAWM) revealed that there were significant difference between NAWM and the all the WMH regions (constant, growing WMH shrinking WMH). Between the WMH regions, the growing WMH had significantly lower MD and rSUV compared to constant WMH, while shrinking WMH had no significant differences in any parameters compared to constant WMH. (Fig. 1)
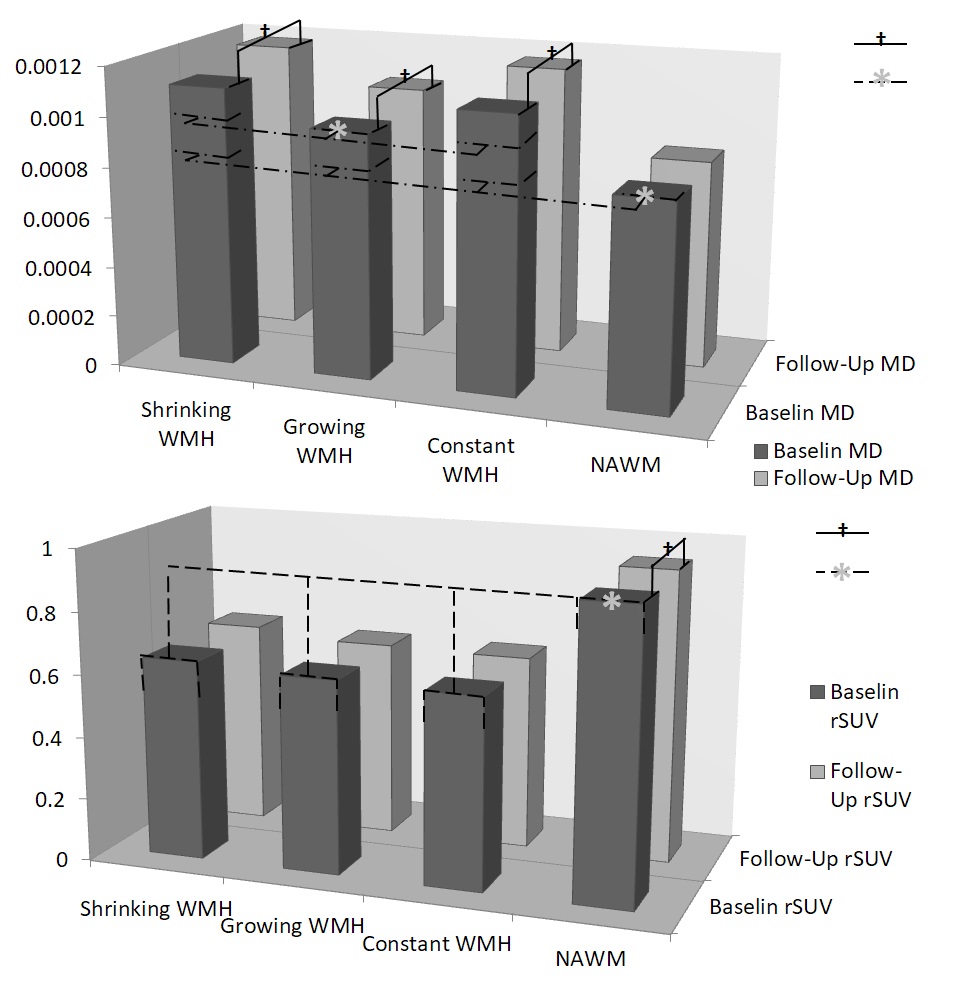
Pair-wise t-test revealed that, longitudinally, MD had significant progression in growing, shrinking and constant WMH while had no significant progression in NAWM; rSUV had significant negative progression in NAWM while had no significant progression in any WMH regions. Further repetitive measurement ANOVA test revealed that, in terms of MD, the constant WMH had the most rapid progression while the growing WMH had relatively slower progression; of rSUV, NAWM had relatively faster progression than any WMH regions. (Fig. 2)
Discussion:
Our results suggests a constantly progressing pattern of WMH development. Despite appeared on the T2FLAIR image as a homogenous patch of hyperintensity with clear border with surrounding white matter, WMH may in fact represent a continuous spectrum of white matter damage. Small vessel damage, demyelination and axon loss may occur in NAWM, slowly turning NAWM into newly formed WMH. Within WMH area, the newly formed WMH have significantly less severe pathological changes than the “older” constant WMH.
Our longitudinal results suggested that there are differences in the rate at which the metabolism and microstructural changes can occur. NAWM have a markedly faster rate of decline in metabolism but no significant progression in diffusion. On the other hand, in the growing WMH as well as the constant WMH, the declining rate of metabolism is no longer significant, where the microstructures start to deteriorate more rapidly. These results suggested a pattern of progression from NAWM to WMH: at first in the NAWM the blood supply started to decrease, but there is not much changes in microstructure; later the blood supply is dropped to a point where rapid deterioration of myelin sheath and axon began due to chronic ischemia, causing water content to changes in white matter area and is detected on MRI scans, at this point the metabolism will continue to decrease but at a significantly slower rate. Our results provide a more directly evidence for the vascular origin of WMH.
Conclusion:
There is a dynamic spectrum of changes in microstructural and metabolism in WMH. Metabolism in NAWM will start to decline rapidly to a point where microstructure will then start to deteriorate.Acknowledgements
No acknowledgement found.References
1: van Leijsen E, de Leeuw FE and Tuladhar AM.Disease progression and regression in sporadic small vessel disease-insights from neuroimaging.Clin Sci (Lond).2017;131:1191-1206.
2: Ramirez J, McNeely AA, Berezuk C, Gao F and Black SE.Dynamic Progression of White Matter Hyperintensities in Alzheimer's Disease and Normal Aging: Results from the Sunnybrook Dementia Study.Frontiers in Aging Neuroscience.2016;8:62.
Figures