3611
Structural and functional assessments of eye, brain and visual field in glaucoma using optical coherence tomography, magnetic resonance imaging and perimetry1Department of Ophthalmology, New York University, New York, NY, United States, 2Department of Biomedical Engineering, Tsinghua University, Beijing, China, 3Touro College of Osteopathic Medicine, Middletown, NY, United States, 4Department of Population Health, New York University, New York, NY, United States, 5Department of Ophthalmology, University of Pittsburgh, Pittsburgh, PA, United States, 6Department of Ophthalmology, Department of Radiology, New York University, New York, NY, United States
Synopsis
We used 3-Tesla anatomical MRI, DTI, optical coherence tomography, and perimetry to assess structural and functional changes in the eye and brain in glaucoma patients across disease stages. Both optic nerve and optic chiasm volumes were found to decrease from early to advanced staged glaucoma, and were associated with inner retinal thinning and visual field functional loss. Fractional anisotropy, mean diffusivity, and radial diffusivity in optic radiation were significantly different from early to advanced staged patients, but not when comparing control to early disease states. These results suggest anatomical MRI and DTI may be useful in monitoring glaucomatous brain damages non-invasively across stages.
Purpose
Glaucoma is a neurodegenerative disease of the visual system that involves progressive and irreversible vision loss, and is ranked as the second leading cause of blindness worldwide1,2. To date, how glaucoma impacts the visual pathway across disease stages remains poorly understood2. This study evaluates the extent of anatomical changes of the retinal ganglion cell axons as well as transsynaptic changes in the optic radiation across glaucoma stages using MRI and clinical ophthalmic assessments.Methods
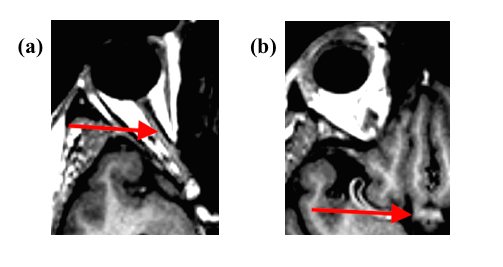
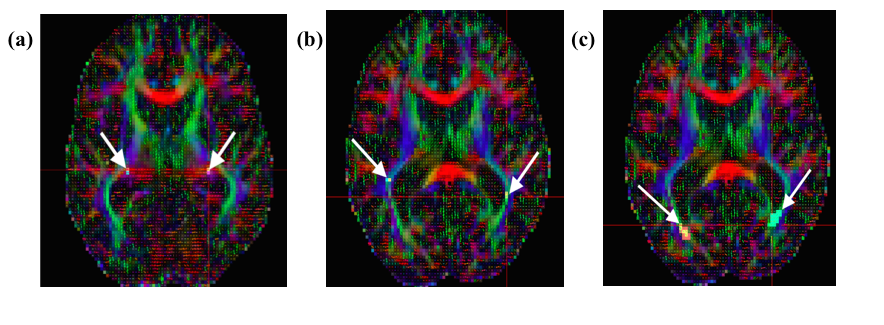
This observational, cross-sectional study included 21 advanced glaucoma (age=64.4±9.8 years), 16 early glaucoma (age=62.4±7.5years), and 13 healthy subjects (age=63.3±8.8 years) who underwent spectral-domain optical coherence tomography (OCT), 3-Tesla anatomical MRI (MPRAGE, resolution=1x1x1mm3), diffusion tensor imaging (DTI, resolution=2x2x3mm3), and Humphrey visual field perimetry. Retinal morphology [i.e. average peripapillary retinal-nerve-fiber-layer (pRNFL) thickness, average macular ganglion-cell-inner-plexiform-layer (mGCIPL) thickness, and optic nerve head cup-to-disc ratio (c/d)] was extracted from clinical OCT reports, while visual function [i.e. visual field mean deviation (VF-MD)] was extracted from Humphrey visual field report. Anatomical MR images were used to manually estimate optic nerve and optic chiasm volumes (Figure 1). For DTI, 3 regions-of-interests (ROIs) were drawn manually on the anterior, middle and posterior portions of the optic radiation of each hemisphere with reference to the color-encoded fractional anisotropy (FA) directionality map and diffusion tensor tractography (Figure 2). DTI-derived parametric values [FA, mean diffusivity (DTI-MD), axial diffusivity (AD), and radial diffusivity (RD)] were extracted for each ROI, and compared across groups. ANOVA and Tukey’s HSD tests were used to assess differences among all techniques across stages. The anatomical MRI and DTI parameters were then compared to clinical OCT and visual field parameters using linear mixed-effects models. Additionally, receiver-operating-characteristic (ROC) curves were used to classify eyes and brains as early/advanced glaucoma or healthy control for each technique.Results
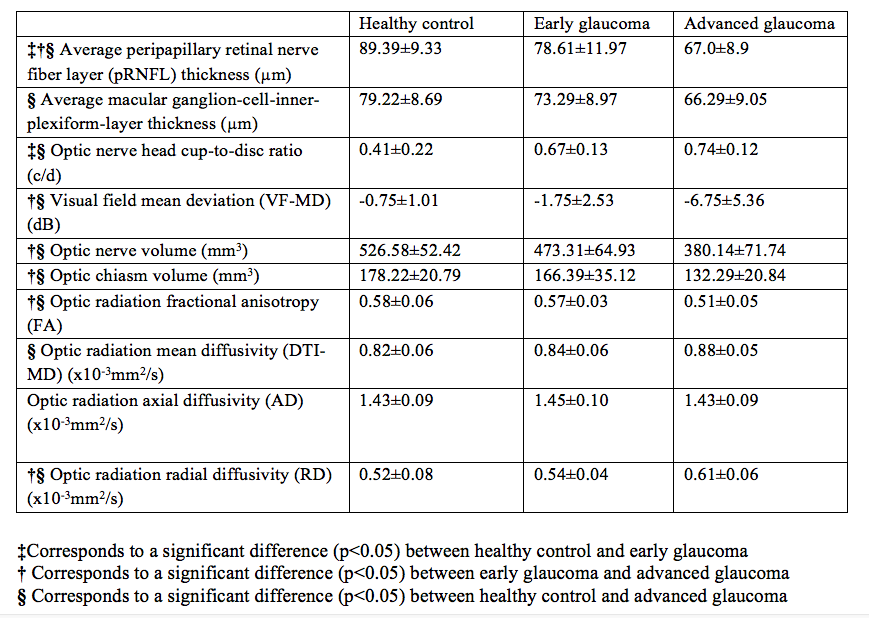
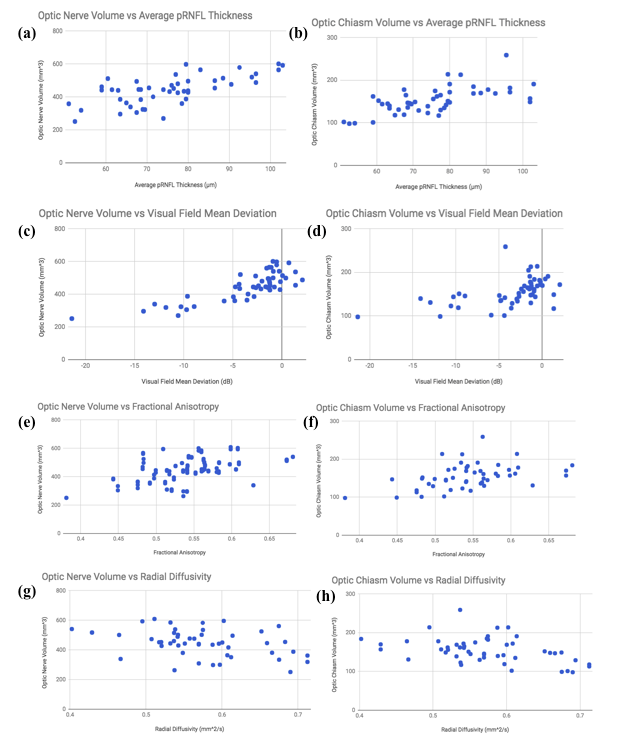
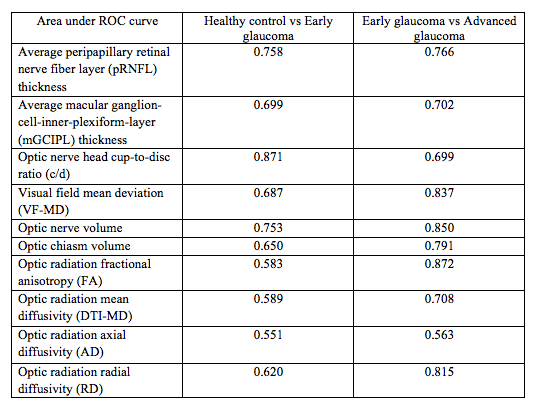
A summary statistics table demonstrating step-wise changes in structural and functional indicators for all measurements in each group is provided in Figure 3, along with indications of significant differences. Significant differences were observed in optic nerve/chiasm volumes between early and advanced staged disease and between controls and advanced staged subjects. Within the optic radiation, mean FA and RD both showed significant changes between the early and advanced glaucoma group and between healthy controls and the advanced glaucoma group (p<0.05). Mean DTI-MD was found to be significantly higher in advanced glaucoma than in healthy controls (p<0.05). No significant trend was observed for AD between groups. There were no statistically significant DTI differences in the optic radiation between healthy control and early glaucoma (p>0.05). From linear mixed effects models, optic nerve and optic chiasm volumes were found positively associated with pRNFL thickness (p=0.001, p=0.02) and VF-MD (p<0.001, p=0.002), but not mGCIPL thickness (p=0.85, p=0.25) or cup-to-disc ratio (p=0.18, p=0.08). Optic chiasm volume was significantly associated with FA, DTI-MD, and RD (p<0.05), while optic nerve head c/d was associated with FA and RD (p<0.05). Optic nerve volume was significantly associated only with RD (p<0.05). Some of these associations are highlighted in Figure 4. The areas under ROC curves for early vs. advanced glaucoma and healthy control vs. early glaucoma are summarized in Figure 5. DTI parameters, along with VF-MD and volumetric brain measurements, showed a better performance at differentiating between early and advanced glaucoma patients than between healthy controls and early glaucoma patients.Discussion
Anatomical MRI showed an association between decreasing optic nerve/chiasm volumes and the severity of glaucoma, with volumes significant differences observed between the early and the advanced groups. This association suggests that structural damage to the optic nerve axons in the brain occurs to a measurable degree during inner retinal thinning and visual field loss. Such volumetric brain changes also appeared to associate more closely to clinical retinal measurements that represent a more diffuse distribution throughout the eye (pRNFL), than those that represent more locally within the macula (mGCIPL). DTI parameters in the optic radiations showed significant differences between early and advanced glaucoma but not between healthy controls and early glaucoma patients, suggesting transsynaptic neurodegeneration is detectable at least toward the later stage of the disease. ROC analyses further supported the feasibility of DTI parameters as markers between early and advanced glaucoma.Conclusions
These preliminary findings suggest that both volumetric and diffusional changes measured from anatomical MRI and DTI may be useful in non-invasively monitoring glaucomatous brain damages across disease stages. ROC analyses indicated differential abilities between anatomical MRI, DTI and clinical ophthalmic assessments to distinguish between healthy control, early glaucoma and advanced glaucoma patients. Changes in FA, MD, and RD in DTI may be characteristic of glaucomatous brain damages during transsynaptic neurodegeneration.Acknowledgements
This work was supported by the National Institutes of Health P30-EY008098 and R01-EY028125 (Bethesda, Maryland); BrightFocus Foundation G2013077 and G2016030 (Clarksburg, Maryland), Eye and Ear Foundation (Pittsburgh, Pennsylvania); and Research to Prevent Blindness (New York, New York).References
1. Quigley, H. A., & Broman, A. T. (2006). The number of people with glaucoma worldwide in 2010 and 2020. British journal of ophthalmology, 90(3), 262-267.
2. Gupta, N., & Yücel, Y. H. (2007). Glaucoma as a neurodegenerative disease. Current opinion in ophthalmology, 18(2), 110-114.
Figures