3605
Measuring the effect of soman, a seizure-inducing chemical warfare nerve agent, with simultaneous perfusion and brain oxygenation measurements1Radiology, University of Calgary, Calgary, AB, Canada, 2Casualty Management Section, Defence Research and Development Canada-Suffield Research Centre, Suffield, AB, Canada
Synopsis
Chemical warfare nerve agents induce neurological damage through seizures. It is widely accepted in the field of nerve agent research that excitotoxicity is the main contributor to the neuropathology. Growing evidence suggests the involvement of hypoxia in seizure-related neuropathology. However, it is difficult to detect hypoxia without directly measuring oxygenation. We applied a method we developed to simultaneously quantify tissue oxygenation and cerebral blood flow to detect hypoxia following soman-induced seizures.
Purpose:
Soman is a potent seizure inducing chemical warfare nerve agent (NA) that has the potential to cause mass casualties and been classified as a weapon of mass destruction. NA usage has increased in the Middle East. For those who survive, the neurological damage is poorly understood. NAs inhibit acetylcholinesterase, resulting in accumulation of acetylcholine (ACh) in the synapse and neuromuscular junction.1 Overstimulation of ACh leads to generalized seizures, which are associated with neurological damage.2 Although there is no doubt excitotoxicity plays a major role in the associated neurological damage,2,3 there is growing evidence of hypoxic damage in the brain following seizures.4,5
The objective of this study was to use multimodal MRI perfusion and pO2 quantification to detect hypoxia/hypoperfusion following soman-induced seizures.
Methods:
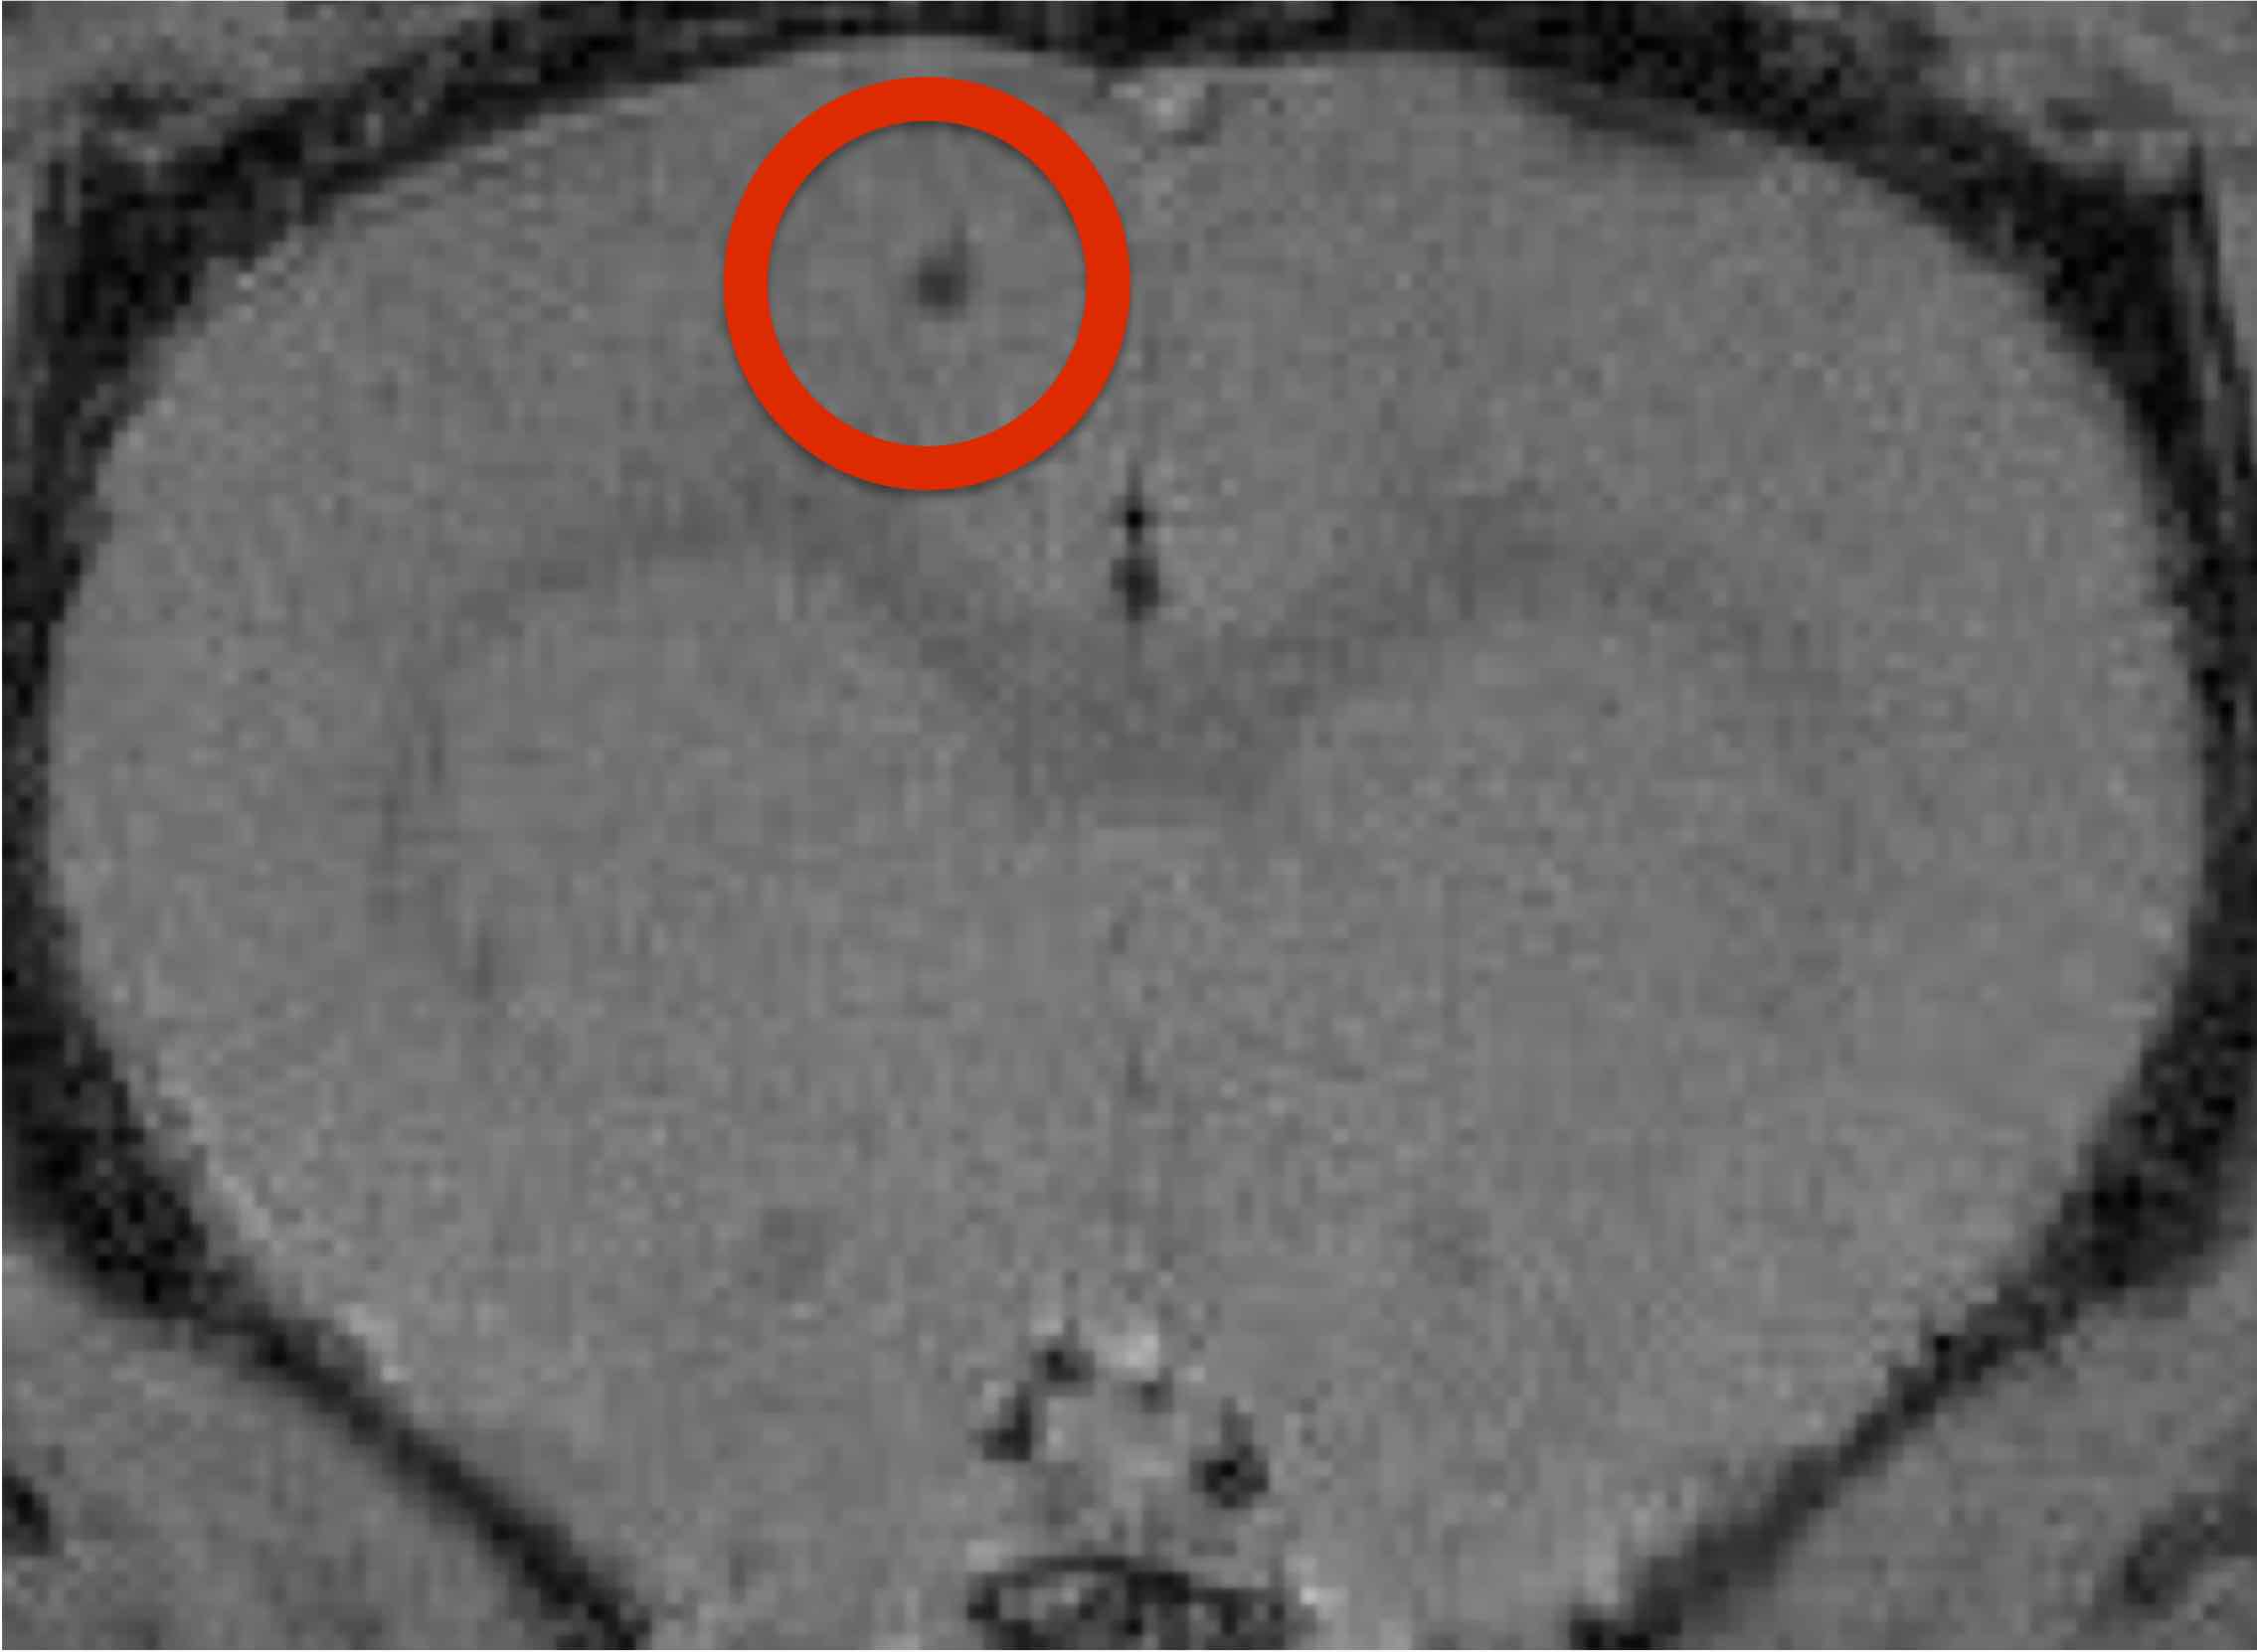
This research was conducted in accordance with the Canadian Council on Animal Care guidelines, and approved by the University of Calgary Animal Care Committee. Male Sprague-Dawley rats, (200-300g), were obtained from Charles-River. Fiber-optic pO2 probes (Oxford Optronix, UK) were implanted in the motor cortex (Fig. 1). MRI was performed on isoflurane-anaesthetized rodents in vivo on a 9.4T Bruker Avance console with a 35mm volume coil. To account for magnetization transfer, a four image continuous arterial spin labeling (CASL) sequence was used: TR/TE: 3000/2.66ms, averages=16, RARE factor=36, FOV= 30x30mm, matrix= 128x128, voxel size: 0.23x0.23x1mm.6 T1 map was obtained using a RARE-VTR sequence: TR=100, 500, 1000, 3000, 7500ms, TE=10ms, matrix size=128x128, FOV=30x30mm, slice thickness=1cm. Anatomical, and control perfusion images were taken at least 24 hours prior to soman injection (n=4) while simultaneously recording pO2 at 1 Hz. 20 minutes prior to soman injection, 125mg/kg of HI-6 dimethansulfonate and 20mg/kg of atropine methyl nitrate (AMN) were injected I.P. to reduce mortality. Soman Injection: 90μg/kg of soman was injected subcutaneously in isoflurane-anaesthetized animals. Animals were observed for 1-hour after exposure for the development of convulsive seizures. Post-treatment: additional doses of HI-6 and AMN were given every 20 minutes after soman (up to three doses). Perfusion imaging and pO2 measurements were taken 1-hour following soman.Results:
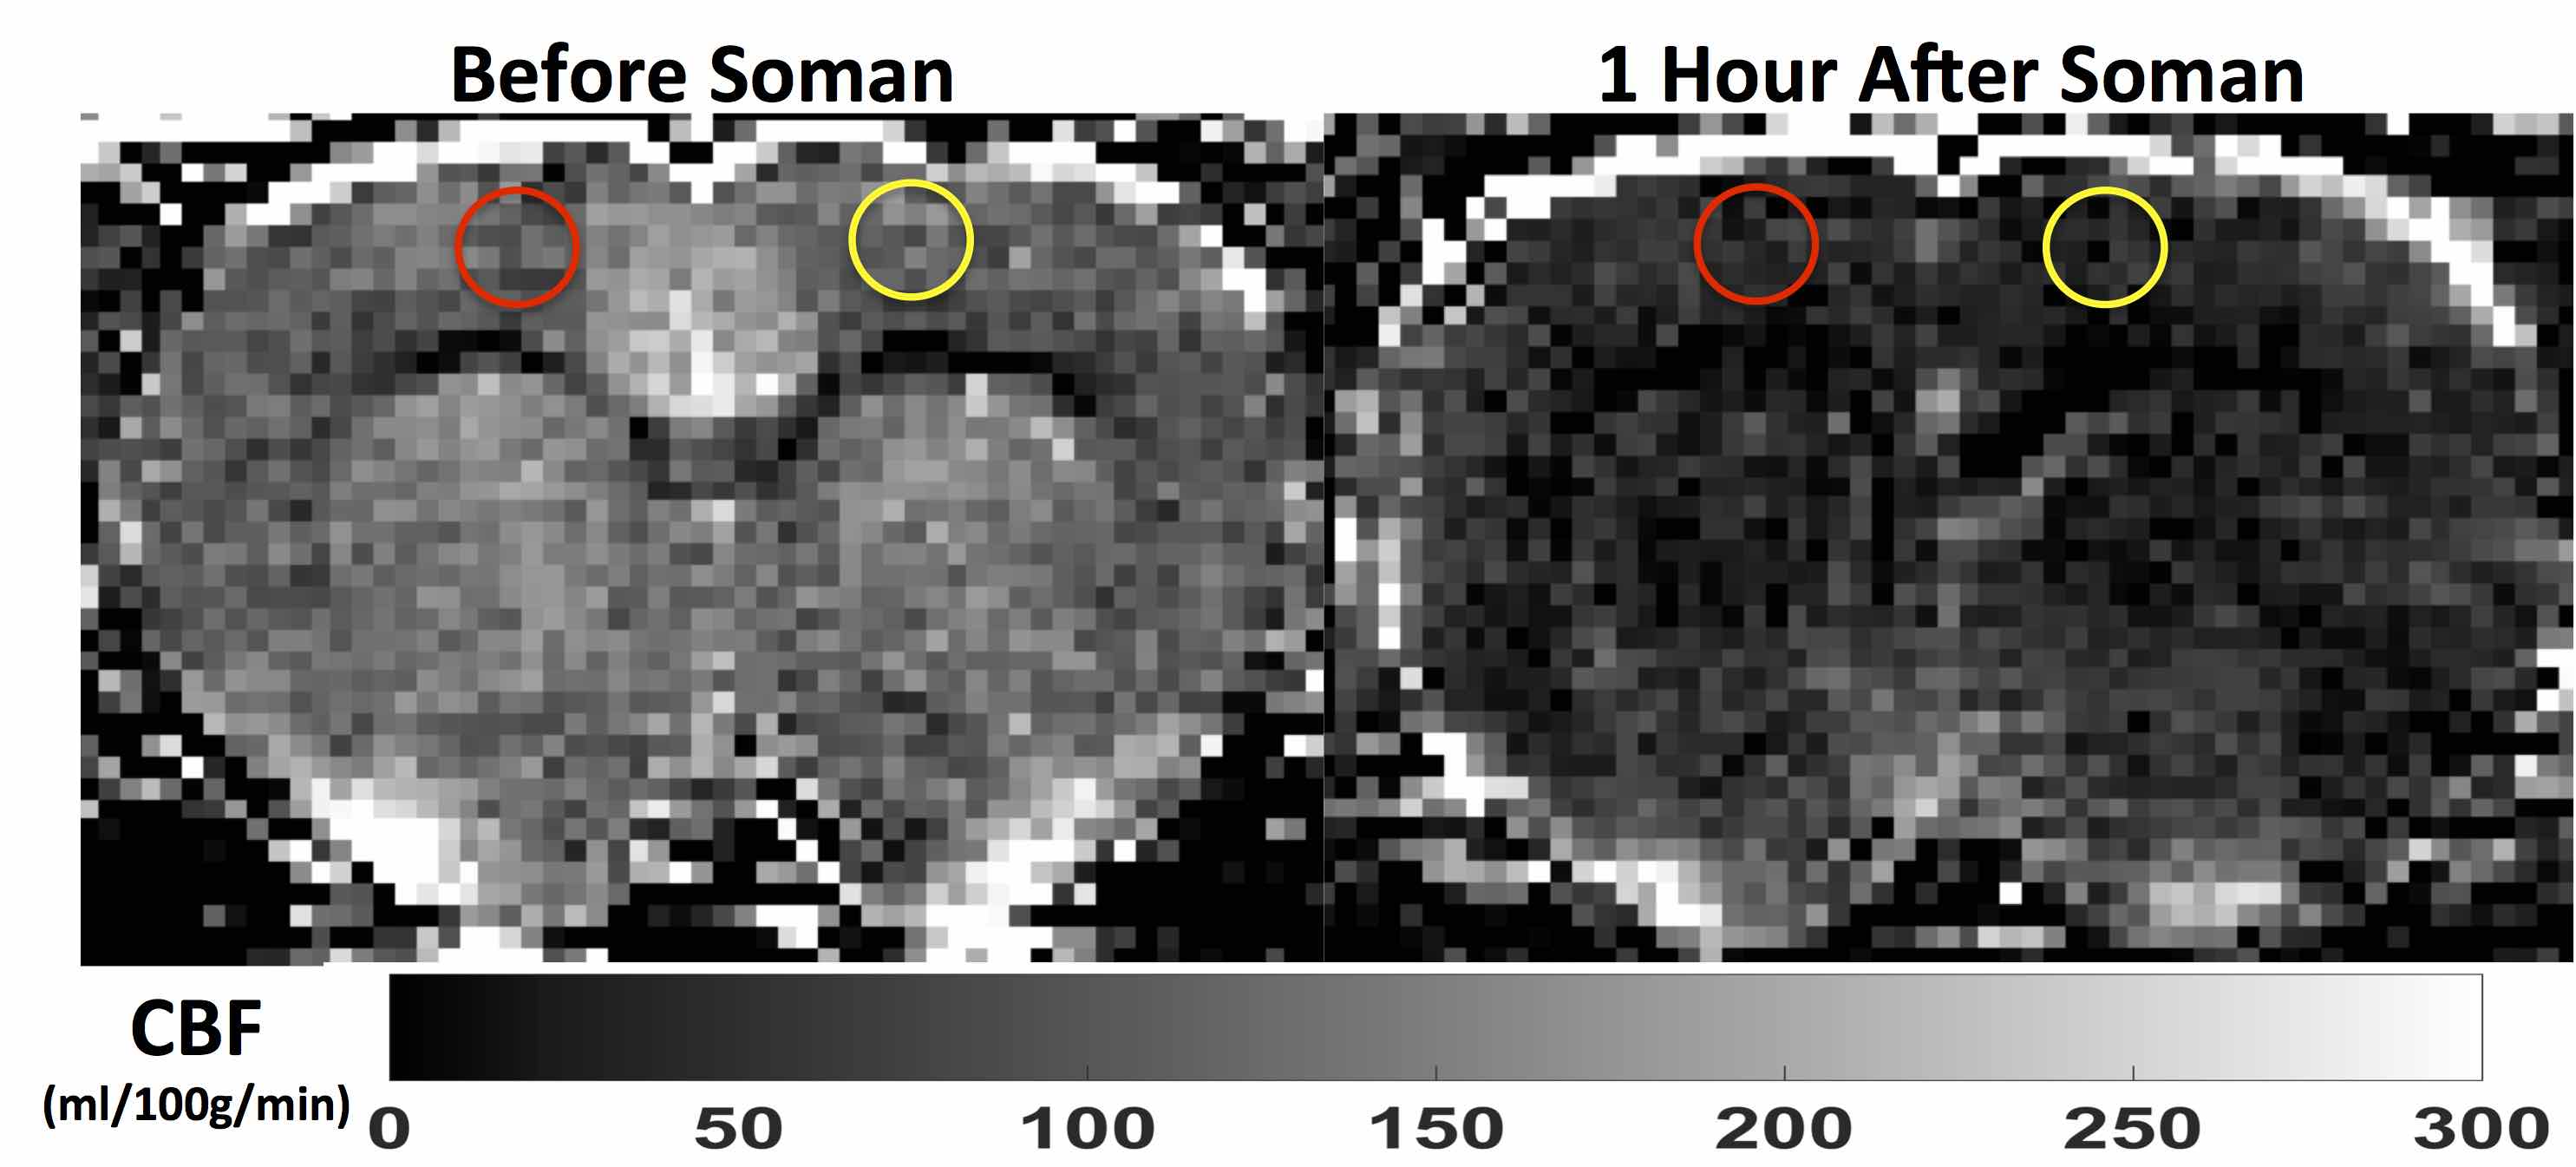
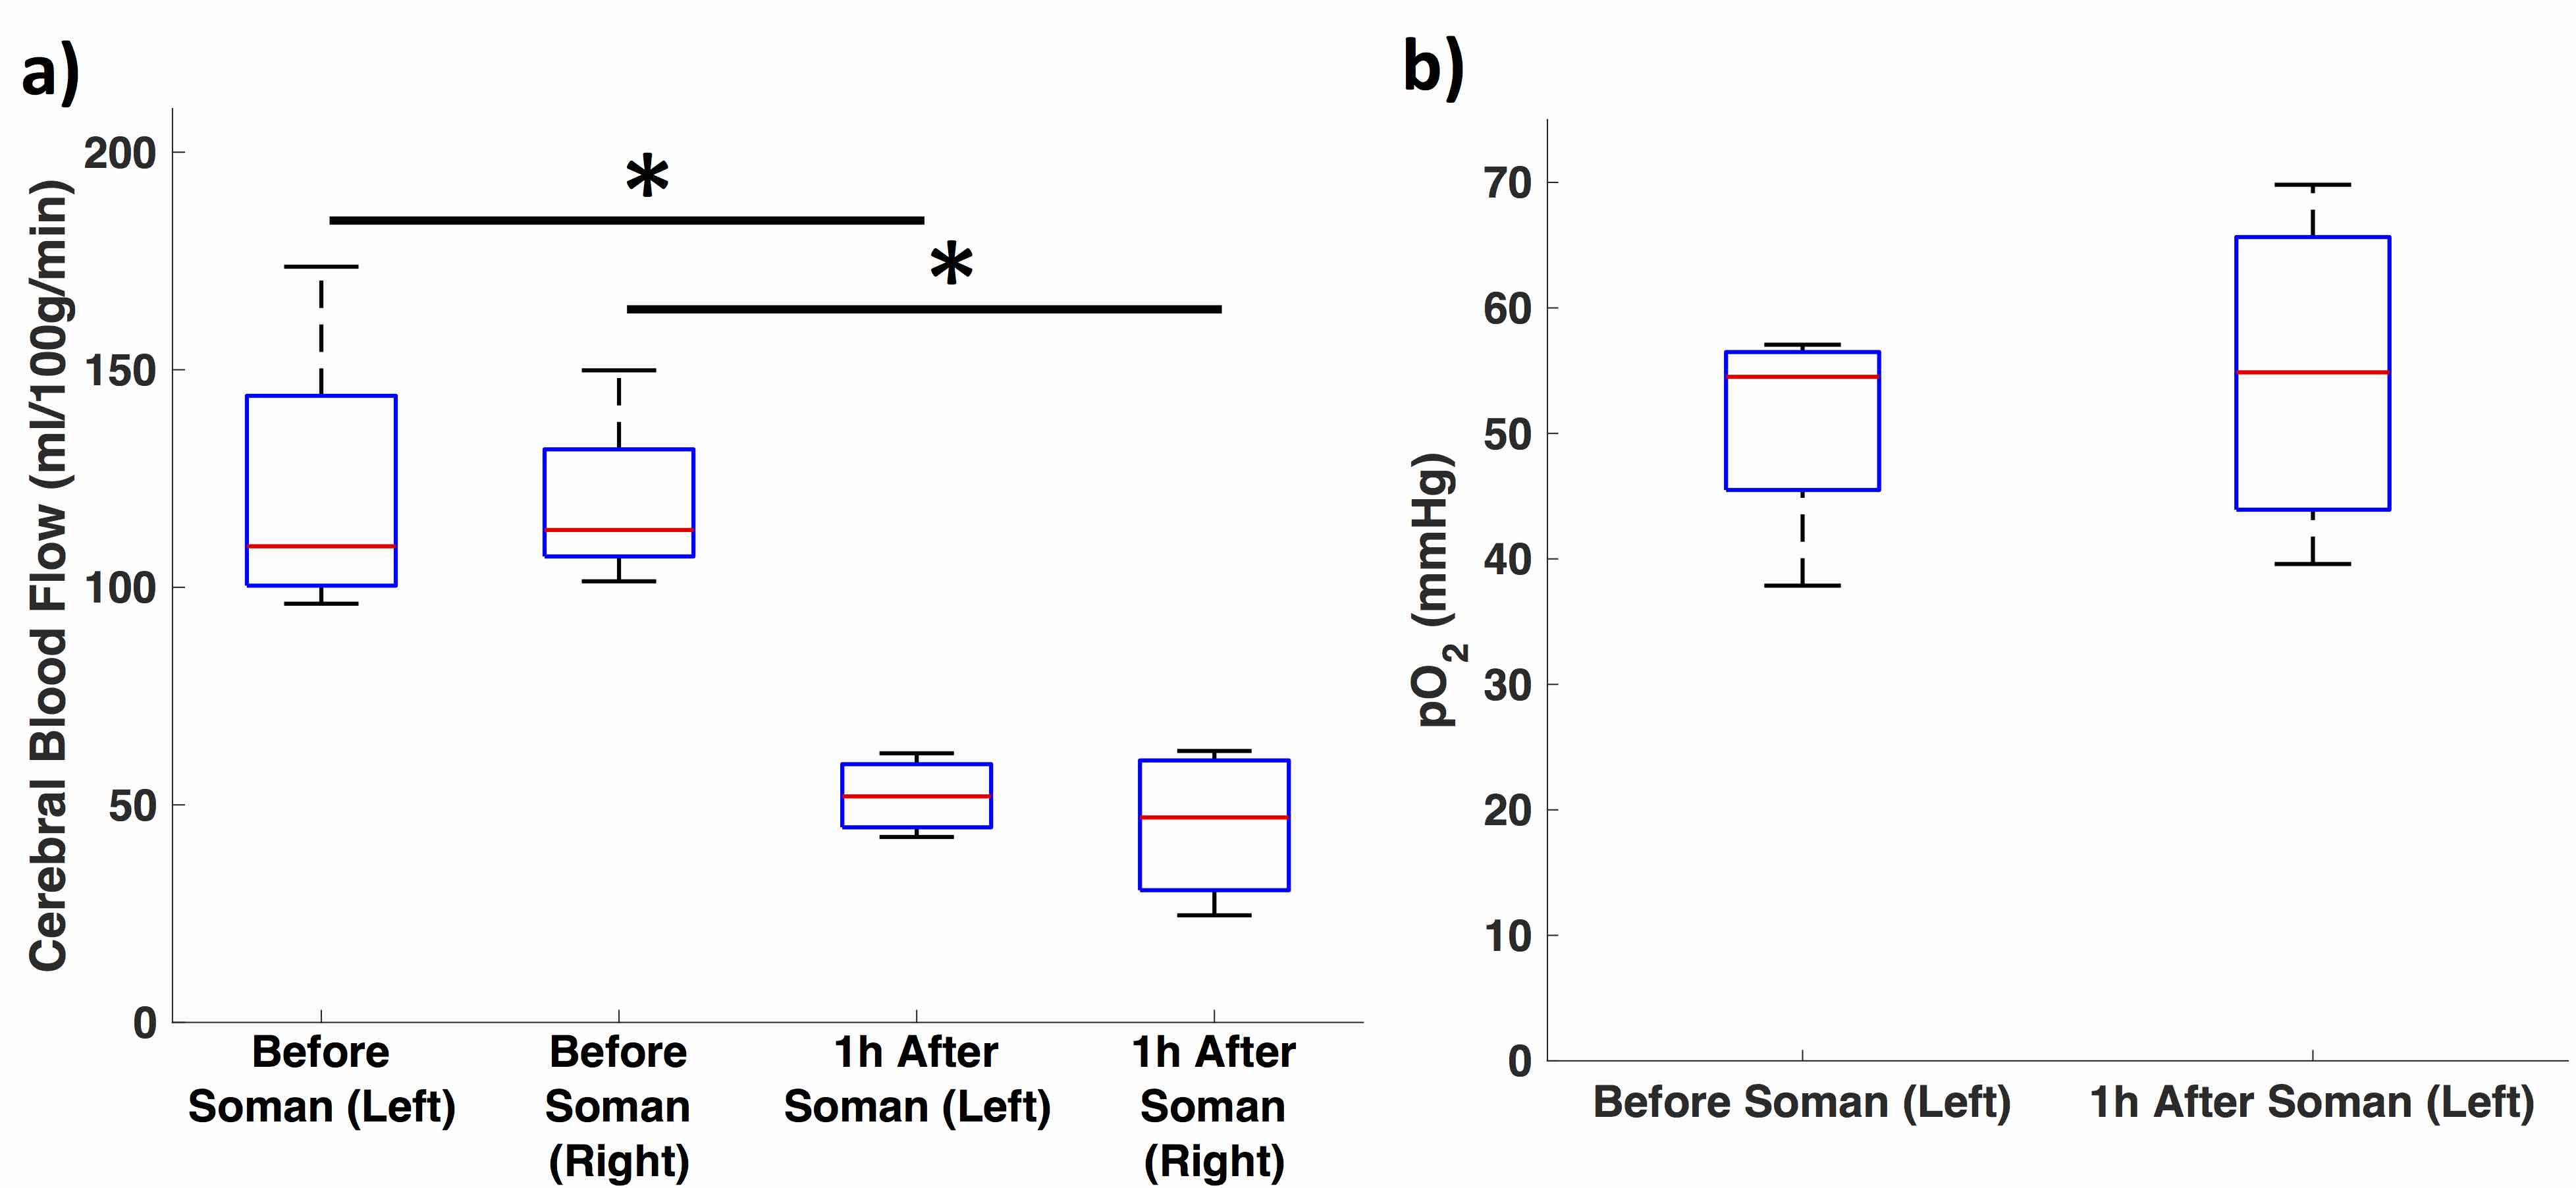
Quantitative perfusion maps 1-hour after soman injection show diffuse hypoperfusion (Fig. 2). There is significantly reduced CBF in the cortex in the regions surrounding the pO2 probe and the contralateral cortex (Fig 3a). pO2 in the motor cortex did not show a significant change (Fig. 3b).Discussion:
We used a novel method to simultaneously measure pO2 using oxygen sensing probes and CBF using MRI. Through this method, we detected hypoperfusion and no change in oxygenation in isoflurane-anaesthetized rats 1-hour after soman exposure. Although we found hypoperfusion, we did not find hypoxia. Also, when we measured pO2 in unanesthetized animals we observed an increase in pO2 (manuscript submitted). The finding suggests an interesting change in hemodynamics after soman. A physiological explanation for hypoperfusion would be a decrease in metabolism. However, this seems unlikely, as generalized seizures are highly metabolically demanding activities.7 Even if isoflurane terminates seizure activity, due to the nature of how soman is injected (subcutaneous bolus) and pharmacokinetics,8 neurons should still remain in a state of hyperexcitability. In addition, studies 1-hour after a convulsive dose of soman found an increase in glucose metabolism and CBF.9 Isoflurane is also vasodilators, where there should be an increase in CBF, despite that, highly restricted blood flow was found.10 The fact that CBF declines without a significant decline in pO2 indicate a major reduction in metabolic rate for oxygen (CMRO2). If there wasn’t a major decline, then pO2 would drop due to reduced oxygen delivery. Oxygen extraction was not elevated even though other seizure-related evidence would support a hyperexcitable membrane state. A compatible explanation would be inhibition of oxygen utilization in mitochondria—resulting in a shift of energy production to anaerobic glycolysis (with an increase in CMRglucose). This reduction in oxidative metabolism occurred even though mitochondrial damage was not found until 8 hours after soman exposure.11 Reactive oxygen species are known to be produced and may be involved in inhibiting mitochondrial function.12 There is growing evidence of seizures and epilepsy having abnormal vascular regulation and therapies to restore perfusion are being explored.4 Based these results, restoring metabolic and mitochondrial function could also be an avenue for treatment.Conclusion:
We combined perfusion MRI with measures of tissue pO2 before and after exposure to soman. At 1-hour after soman exposure in isoflurane-anaesthetized rats, there is evidence for uncoupling between metabolism and CBF, indicated by reduced CBF without reduced PO2. This novel physiological observation could have implications for both soman exposure as well as other seizure-related conditions, given that abnormal vasodynamics have now been observed in both conditions.4,5Acknowledgements
This research was supported by the Department of National Defence, Canada. We thank our colleagues from the Defence Research and Development Canada- Suffield Research Centre for providing the materials necessary for the research.
We thank Brain Canada Platform grant.
We thank Big Horn Sheet Metal, Canmore, AB, Canada for developing stereotaxic parts for the research.
References
1. Shih, T. M., Koviak, T. A. & Capacio, B. R. Anticonvulsants for poisoning by the organophosphorus compound soman: pharmacological mechanisms. Neurosci Biobehav Rev 15, 349-362 (1991).
2. McDonough, J. H., Jr. & Shih, T. M. Pharmacological modulation of soman-induced seizures. Neurosci Biobehav Rev 17, 203-215 (1993).
3. Lallement, G. et al. Neuroprotective activity of glutamate receptor antagonists against soman-induced hippocampal damage: quantification with an omega 3 site ligand. Brain Res 618, 227-237 (1993).
4. Farrell, J. S. et al. Postictal behavioural impairments are due to a severe prolonged hypoperfusion/hypoxia event that is COX-2 dependent. Elife 5, doi:10.7554/eLife.19352 (2016).
5. Leal-Campanario, R. et al. Abnormal Capillary Vasodynamics Contribute to Ictal Neurodegeneration in Epilepsy. Sci Rep 7, 43276, doi:10.1038/srep43276 (2017).
6. Lei, H. et al. The effects of ketamine-xylazine anesthesia on cerebral blood flow and oxygenation observed using nuclear magnetic resonance perfusion imaging and electron paramagnetic resonance oximetry. Brain Res 913, 174-179 (2001).
7. Duffy, T. E., Howse, D. C. & Plum, F. Cerebral energy metabolism during experimental status epilepticus. J Neurochem 24, 925-934 (1975).
8. Worek, F., Thiermann, H., Szinicz, L. & Eyer, P. Kinetic analysis of interactions between human acetylcholinesterase, structurally different organophosphorus compounds and oximes. Biochem Pharmacol 68, 2237-2248, doi:10.1016/j.bcp.2004.07.038 (2004).
9. Shih, T. M. & Scremin, O. U. Cerebral blood flow and metabolism in soman-induced convulsions. Brain Res Bull 28, 735-742 (1992).
10. Schwinn, D. A., McIntyre, R. W. & Reves, J. G. Isoflurane-induced vasodilation: role of the alpha-adrenergic nervous system. Anesth Analg 71, 451-459 (1990).
11. Baille, V. et al. Soman-induced convulsions: the neuropathology revisited. Toxicology 215, 1-24, doi:10.1016/j.tox.2005.05.028 (2005).
12. Rowley, S. et al. Mitochondrial respiration deficits driven by reactive oxygen species in experimental temporal lobe epilepsy. Neurobiol Dis 75, 151-158, doi:10.1016/j.nbd.2014.12.025 (2015).
Figures