3604
Exploratory Group Independent Components Analysis of resting state fMRI data reveals widespread brain function impairments in Gulf War Illness1Department of Radiology, Emory University, Atlanta, GA, United States, 2University of Houston Clear-Lake, Houston, TX, United States, 3VA RR&D Center of Excellence, Atlanta VAMC, Decatur, GA, United States, 4Department of Neurology, Emory University, Atlanta, GA, United States, 5Department of Internal Medicine, UT Southwestern Medical Center, Dallas, TX, United States
Synopsis
Around 200,000 veterans (up to 32% of those deployed) of the 1991 Gulf War (GW) suffer from GW illness (GWI), which is characterized by multiple deficits in cognitive, emotion, sensory and interoception domains. In this study we examined 23 GWI patients and 30 age-matched controls with resting state fMRI (rsFMRI) in order to map impairments in brain function networks in GWI with group independent components analysis. The results show that GWI veterans exhibit impaired, or abnormally increased functional connectivity in a lot of brain function networks consistent with their self-reported symptoms.
INTRODUCTION
Around 200,000 veterans (up
to 32% of those deployed) of the 1991 Gulf War (GW) suffer from GW illness
(GWI). GWI is a poorly understood chronic medical condition, characterized by multiple symptoms indicative of brain function
deficits in cognitive, emotion, sensory and
interoception domains1-8. In
this study, we employed resting state fMRI (rsFMRI) to explore impairments in
brain function networks in GWI, with group independent components analysis9 (ICA).METHODS
Twenty-three GWI veterans (mean age 49.4 yrs.) and thirty normal controls (NC) (mean age 49.8 yrs.), were scanned in a Siemens 3T MRI scanner using a 12-channel Rx head coil. Written informed consent was obtained from all participants in the protocol approved by the local Institutional Review Board. RsFMRI data were acquired with a 10-min whole-brain gradient echo EPI (TR/TE/FA = 2000/24ms/90°, resolution = 3mm x 3mm x 3.5mm). RsFMRI preprocessing steps included attenuation of signal related to subject-motion and physiological responses, using advanced ICA based artifact reduction techniques10, and spatial smoothing with FWHM = 6mm isotropic Gaussian kernel. A group spatial ICA9 was performed on temporally concatenated data of the whole group of 53 subjects, with the Infomax algorithm, using the GIFT software9,11. In order to adequately account for differences in resting state networks between GWI and control subjects, high-dimensional group ICA12 was employed, with the stability of the resultant ICs checked with GIFT’s Icasso13 utility. For each subject, the functional network connectivities (FNCs) between the different ICs (obtained through back-projection9 of the group ICs), were assessed with cross-correlation (CC) analysis. Between-group differences in FNCs were assessed with 2-sample t-tests on z-transformed CCs.RESULTS & DISCUSSION
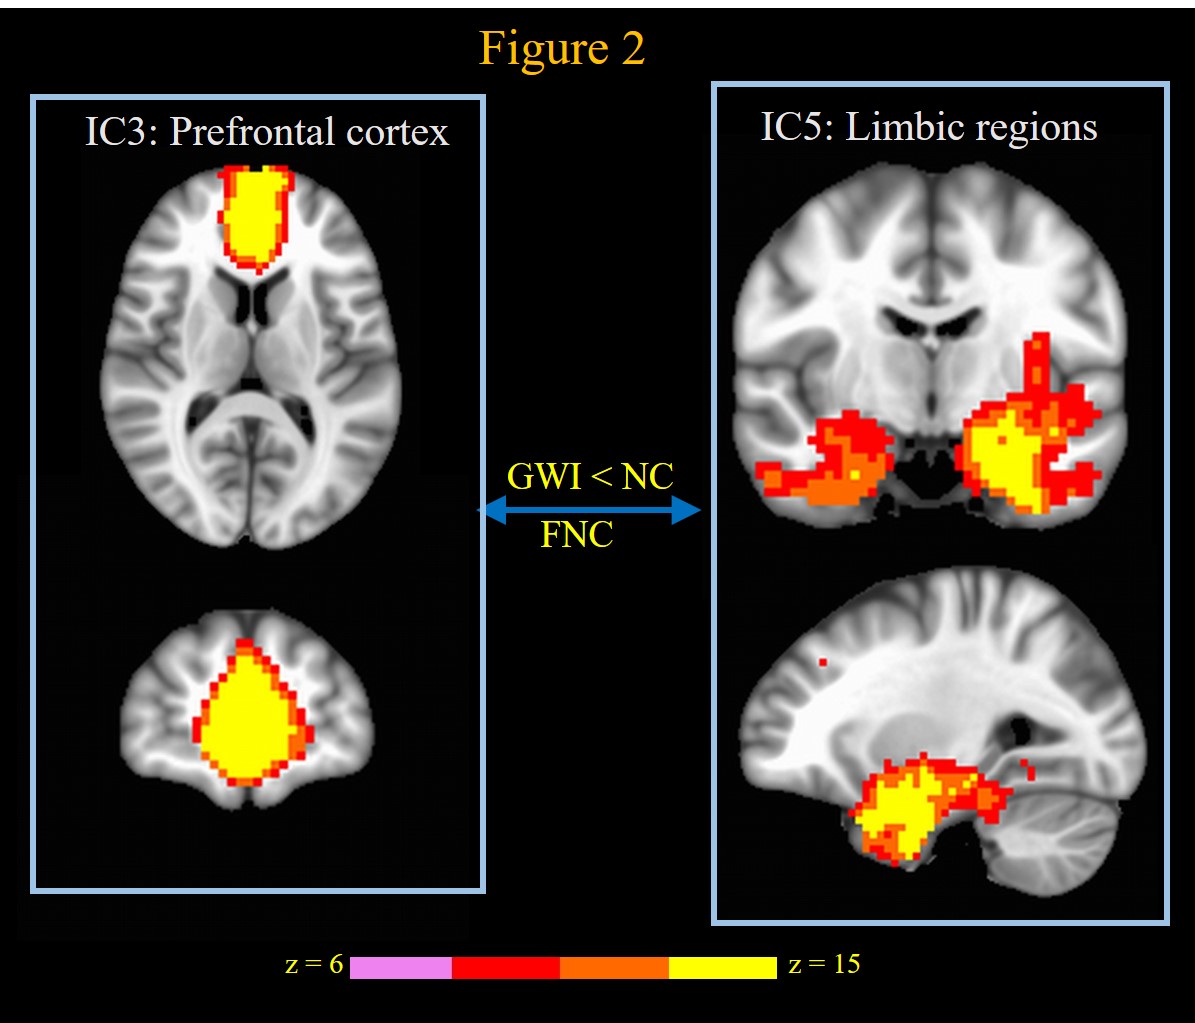
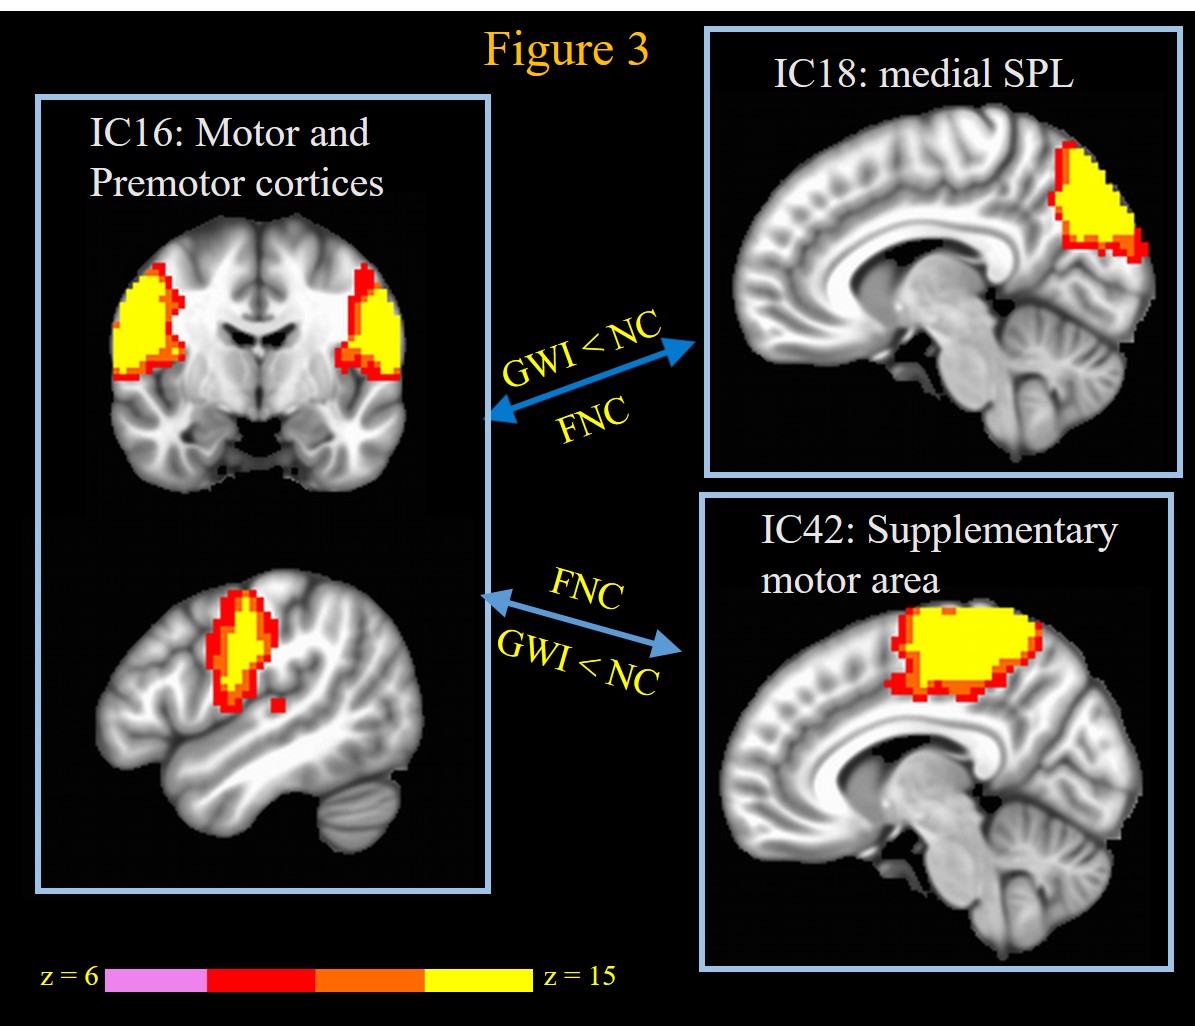
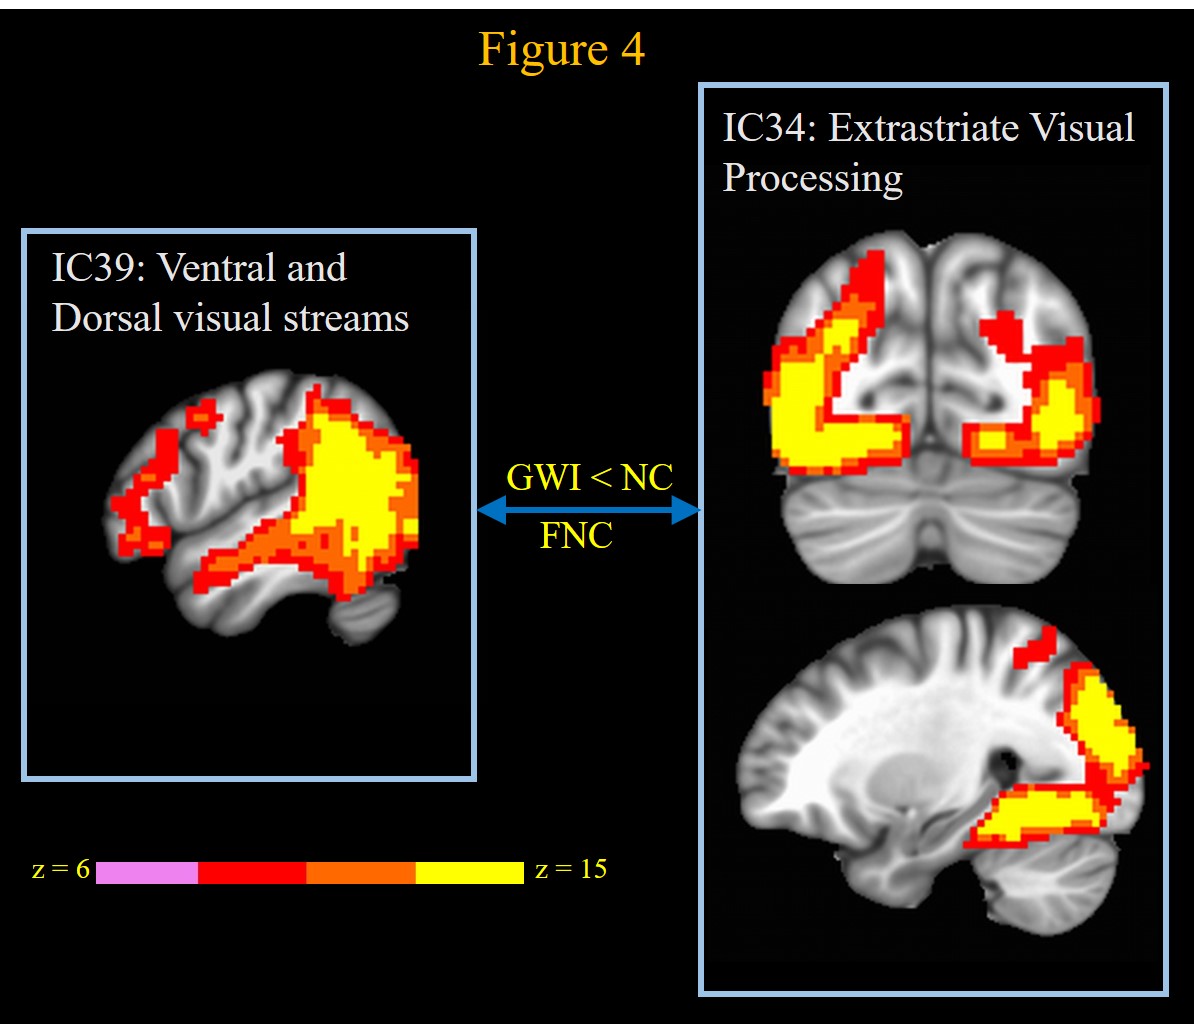
GWI veterans exhibited significantly (2-sample t-test p < 0.05) decreased FNCs compared to NC between ICs that constituted left hemisphere language areas, and ICs that corresponded to visual (Figure 1), auditory, and sensorimotor input processing regions, that are involved in semantic processing8,14, consistent with their word-finding deficits2,4,6-8. On the other hand, GWI veterans exhibited hyper-connectivity (i.e., significantly increased FNC) between the language network ICs and fronto-striatal network ICs (Figure 1), indicating increased engagement of language executive function networks as a compensatory mechanism for decreased communication between language and sensory processing centers of the brain. GWI patients also exhibited decreased FNC between ICs constituting pre-frontal cortex and those representing limbic regions (Figure 2), indicating loss of cognitive control of limbic function as a mechanism underlying their mood symptoms1,2,5-7. GWI veterans also exhibited decreased FNC between ICs constituting motor and premotor cortices and those constituting mid-parietal association cortices, as well as motor programming areas (Figure 3), consistent with deficits in fine motor skills seen in GWI veterans2. Consistent with self-reported deficits in visual processing6, GWI veterans also exhibited decrease FNC between extrastriate visual cortex ICs, and dorsal and ventral stream ICs (Figure 4). Further, GWI veterans also exhibited decreased FNC between posterior and anterior default mode network (DMN) regions (not shown). In contrast, GWI veterans showed increased FNC between ICs involved in pain processing, as well as between pain-processing and DMN ICs (Figure 5), consistent with symptoms of chronic pain seen in GWI2,3. Finally, the GWI functional network connectivity architecture was characterized by a general loss of modularity, i.e., abnormally increased FNCs between functionally disparate regions. For instance, GWI veterans exhibited increased FNCs compared to NC, between DMN, and task-positive, and salience networks. Similar loss of modularity has also been observed in other neurodegenerative diseases, including Alzheimer’s15 and Parkinson’s16.CONCLUSION
The results show that GWI veterans exhibit impaired, or abnormally increased functional connectivity in a lot of brain function networks consistent with their self-reported symptoms. The results also provide putative mechanisms for some of the brain function impairment in GWI. Thus, the results support a neurological basis for GWI, which could have been potentiated by various neurotoxic exposures experienced by these veterans in the Gulf War theater1,2. In future work, we will correlate these findings with neuropsychological testing scores obtained from these GW veterans, and extend our analyses to a larger GW veterans cohort.Acknowledgements
This work was supported by the Office of Assistant Secretary of Defense for Health Affairs, through the Gulf War Illness Research Program under Award No. W81XWH-16-1-0744 (PI: Gopinath). Opinions, interpretations, conclusions and recommendations are those of the author and are not necessarily endorsed by the Department of Defense.References
1. Haley RW, Kurt TL, et al. Is there a Gulf War Syndrome? Searching for syndromes by factor analysis of symptoms. JAMA 1997;277:215-22.
2. Binns JH, Barlow C, et al. Report of Research Advisory Committee on Gulf War Veterans’ Illnesses. In: Affairs DoV, ed. Washington, D.C.: U.S. Government Printing Office; 2008.
3. Gopinath K, Gandhi P, et al. FMRI reveals abnormal central processing of sensory and pain stimuli in ill Gulf War veterans. Neurotoxicology 2012;33:261-71.
4. Moffett K, Crosson B, et al. Word-finding impairment in veterans of the 1991 Persian Gulf War. Brain Cogn 2015;98:65-73.
5. Goldstein G, Beers SR, et al. A preliminary neuropsychological study of Persian Gulf veterans. J Int Neuropsychol Soc 1996;2:368-71.
6. White RF, Proctor SP, et al. Neuropsychological function in Gulf War veterans: relationships to self-reported toxicant exposures. Am J Ind Med 2001;40:42-54.
7. Toomey R, Alpern R, et al. Neuropsychological functioning of U.S. Gulf War veterans 10 years after the war. J Int Neuropsychol Soc 2009;15:717-29.
8. Calley CS, Kraut MA, et al. The neuroanatomic correlates of semantic memory deficits in patients with Gulf War illnesses: a pilot study. Brain Imaging Behav 2010;4:248-55.
9. Calhoun VD, Adali T, et al. A method for making group inferences from functional MRI data using independent component analysis. Hum Brain Mapp 2001;14:140-51.
10. Pruim RH, Mennes M, et al. ICA-AROMA: A robust ICA-based strategy for removing motion artifacts from fMRI data. Neuroimage 2015;112:267-77.
11. Eolf E, Rachakonda S, et al. Group ICA fMRI Toolbox (GIFT): New signal processing techniques applied to brain imaging: Abstracts of the Society of Biological Psychiatry 59th Annual Meeting. April 29-May 1, 2004, New York, New York, USA. Biol Psychiatry 2004;55:1S-256S.
12. Dipasquale O, Griffanti L, et al. High-Dimensional ICA Analysis Detects Within-Network Functional Connectivity Damage of Default-Mode and Sensory-Motor Networks in Alzheimer's Disease. Front Hum Neurosci 2015;9:43.
13. Himberg J, Hyvarinen A, et al. Validating the independent components of neuroimaging time series via clustering and visualization. Neuroimage 2004;22:1214-22.
14. Haberling IS, Steinemann A, et al. Cerebral asymmetry for language: Comparing production with comprehension. Neuropsychologia 2016;80:17-23.
15. Brier MR, Thomas JB, et al. Functional connectivity and graph theory in preclinical Alzheimer's disease. Neurobiol Aging 2014;35:757-68.
16. Ma Q, Huang B, et al. Altered modular organization of intrinsic brain functional networks in patients with Parkinson's disease. Brain Imaging Behav 2017;11:430-43.
Figures