3602
Resting-State fMRI Low-Frequency Fluctuations in Temporal-Lobe Epilepsy Patients and The Relationship with Hemodynamic Correlates1University of Rochester, Rochester, NY, United States, 2Vanderbilt University Institute of Imaging Science, Nashville, TN, United States
Synopsis
Introduction
Amplitude of low-frequency fluctuations (ALFF) of blood oxygenation is a marker of resting-state functional magnetic resonance imaging (fMRI) used to measure local spontaneous activity of the brain1. It is hypothesized that changes in this measure will identify regions of epileptogenicity. However, studies have reported both increases1 and decreases2 in ALFF in regions ipsilateral to the seizure focus in temporal lobe epilepsy (TLE). Because little work has been done to elucidate the mechanism of this measure, the interpretation of these results is unclear. The goals of this study were to 1) investigate the relationship of ALFF between right and left TLE patients compared to healthy controls, and 2) investigate the relationship of ALFF and two hemodynamic correlates in the healthy brain: cerebral blood flow (CBF) and cerebrovascular reactivity (CVR) to provide a more informed interpretation of the results of the first goal.Materials and Methods
To address the first goal, 3T MRI scans were acquired in 44 healthy controls (23 M, 39.3 yrs +/- 14.3 yrs) and 27 Temporal-Lobe epilepsy (TLE) patients (15 M, 35.8 yrs +/- 15.7 yrs, 4 left TLE and 20 right TLE). The MRI included a T2*-weighted fMRI Blood Oxygenation Level Dependent image at rest with eyes closed for FC (matrix = 80 x 80, field of view = 240 mm, 34 axial slices, echo time = 35 ms, repetition time = 2 sec, slice thickness = 3.5 mm/ 0.5 mm gap, 2 x 300 volumes, 10 minutes).
To compute ALFF, each voxel time series was transformed into the frequency domain with a fast Fourier transform to obtain the power spectrum. Then, the square root was calculated at each frequency in the power spectrum, and the average square root was obtained across a standard frequency band (0.01-0.08Hz) at each voxel3. This value was divided by the mean value of the whole brain to obtain the ALFF value for each voxel (unitless). Groups were compared using a multi regression model using Statistical Parametric Mapping (SPM) with age as a covariate.
ALFF = mean(sqrt(ftc(0.01Hz-0.08Hz)))/(Mean ALFF of brain)
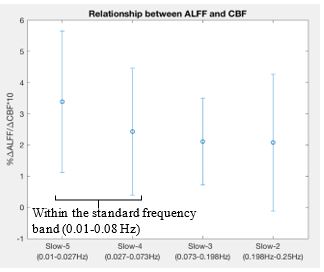
To address the second goal, three MRI scans were acquired in 11 healthy controls (5M/6F, 18–23 years old). 1) CVR was measured using fMRI during a hypercapnia challenge (units: %ΔBOLD/mmHg). 2) Resting CBF was quantified using arterial spin labeling MRI methods (units: ml/100g tissue/min). 3) ALFF was measured using resting-state fMRI. To compare the different measures, a linear mixed-effects model was fitted to find the relationship between ALFF, CBF and CVR. For significant relationships found in the standard band, ALFF computations were then narrowed into four distinct frequency bands (slow-5: 0.01-0.027 Hz; slow-4: 0.027-0.073 Hz; slow-3: 0.073-0.198 Hz; slow-2: 0.198-0.25 Hz)4 for further comparison.
Results and Discussion
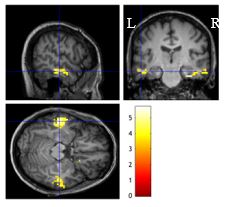
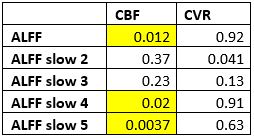
Group results showed that ALFF was significantly higher than the controls (p < 0.001 uncorrected, extent threshold 10 voxels) for right TLE patients in the right hippocampus region, which is the presumed seizure focus (Figure 1). In left TLE patients, there were increases in bilateral regions in the temporal lobe (p < 0.001 uncorrected, extent threshold 10 voxels) (Figure 2). Analysis of the 11 healthy controls demonstrated a significant relationship between ALFF and CBF in the standard band (p=0.01). No relationships with CVR were significant. The ALFF slow-5 and slow-4 showed significant relationships with CBF (p=0.004, p=0.02). The ALFF slow-5 band had the highest relationship with CBF but there were no significant differences in the overall effect of frequency bands on the CBF and ALFF relationship (p=0.43) (Figure 3).Conclusion
Our results show that ALFF is increased in the seizure focus (right TLE) or related seizure propagation regions (left TLE) in temporal lobe epilepsy. In a separate cohort of healthy controls, increases in CBF were found to be associated with increases in ALFF, especially in the lower frequency bands that are usually used to compute ALFF. This suggests that CBF increases may be partially responsible for increases in ALFF in epileptic regions of the brain. While we were not able to measure cerebrovascular parameters in the same epilepsy patients, increases in CBF are expected when utilizing methods such as Single Photon Computed Tomography (SPECT) to localize the seizure focus. These results imply that development of ALFF measures may potentially provide similar information to SPECT scanning without the use of ionizing radiation.Acknowledgements
This study was funded by NIH UL1 TR000445 and RO1 NS75270.References
[1] Z. Zhang et al, "FMRI Study of Mesial Temporal Lobe Epilepsy Using Amplitude of Low-Frequency Fluctuation Analysis," Human Brain Mapping, vol. 31, (12), pp. 1851-1861, 2010. \
[2] A. Reyes et al, "Resting‐state functional MRI distinguishes temporal lobe epilepsy subtypes," Epilepsia, vol. 57, (9), pp. 1475-1484, 2016.
[3] Yu-Feng, Wang, et al. "Altered Baseline Brain Activity in Children with ADHD Revealed by Resting-State Functional MRI." Brain and Development, vol. 29, no. 2, 2007, pp. 83-91.
[4] Zuo XN, Di Martino A, Kelly C, Shehzad ZE, Gee DG, Klein DF, Castellanos FX, Biswal BB, Milham MP(2010): The oscillating brain: Complex and reliable. Neuroimage 49:1432–1445.
Figures