3597
Translating 19F-based cellular MRI from 9.4T to 3T: Feasibility of future clinical applications1Medical Biophysics, Western University, London, ON, Canada, 2Robarts Research Institute, London, ON, Canada
Synopsis
A limitation of 19F-based MRI is low sensitivity; consequently, many studies have been performed at high field strengths with relatively long scan times (ie. 30 minutes). Because of this, human applications have seemed unreasonable. Here, we investigate the feasibility of translating 19F MRI from 9.4T to a 3T clinical scanner. Upon optimization of 3T scan parameters, 19F image quality was similar and 19F spin quantification was not different to a scan performed at 9.4T. Additionally, a 30 second scan produced the same 19F spin quantification as a 30 minute scan at 3T. These findings show promise for future clinical applications.
Introduction
Fluorine-19 (19F)-based MRI cell tracking can detect PFC-labeled cells with high specificity due to the lack of endogenous fluorine in biological tissues. Additionally, 19F MRI is quantitative, since the signal intensity is linearly related to the number of 19F spins. Compared to the more widely used iron oxide-based MRI cell tracking, 19F is much less sensitive. Consequently, most preclinical 19F cell tracking studies have been performed at high magnetic field strengths and with relatively long scan times (ie. 30 minutes). We have developed the tools for 19F cell tracking at 9.4T to quantify tumor associated macrophages (TAMs) in murine breast cancer and have demonstrated the ability to differentiate between tumors of varying aggressiveness based on TAM content1.
In breast cancer patients, the presence of TAMs correlates strongly with breast cancer progression, metastatic spread and poor outcomes2. The ability to detect and monitor the number of TAMs in individual breast tumors with 19F MRI would allow for identification of breast tumors which are heavily infiltrated with TAMs; this could be used as a biomarker for decisions about how to best treat these patients and for monitoring responses to therapy. The limited sensitivity of 19F MRI, however, presents challenges when translated to clinical MR systems. In this study we examine the feasibility of performing in vivo 19F MRI TAM tracking in a mouse on a 3T clinical scanner with the long term goal of clinical translation.
Methods
19F MR imaging was performed on a 3T GE clinical MRI system and a 9.4T Agilent small animal MRI, using dual tuned 1H/19F surface and birdcage coils, respectively. Murine RAW264.7 macrophage cell pellets (5,000 – 5 million cells), labeled in vitro with a PFC agent were imaged at 3T to determine a lower cell detection limit. 4T1 tumor bearing mice were imaged at approximately 3 weeks post cancer cell implantation, 24 hours post intravenous PFC agent in two separate studies: 1) Consecutively at 9.4T then 3T, keeping voxel size and scan time consistent to determine detection and quantification abilities; 19F spin content in the tumor was quantified for each magnetic field strength. 2) Optimization of signal detection and image quality at 3T by varying flip angle, bandwidth and number of excitations (NEX); 19F spin quantification in the tumor and macrophage cell pellets were compared with decreasing signal to noise ratio (SNR).Results
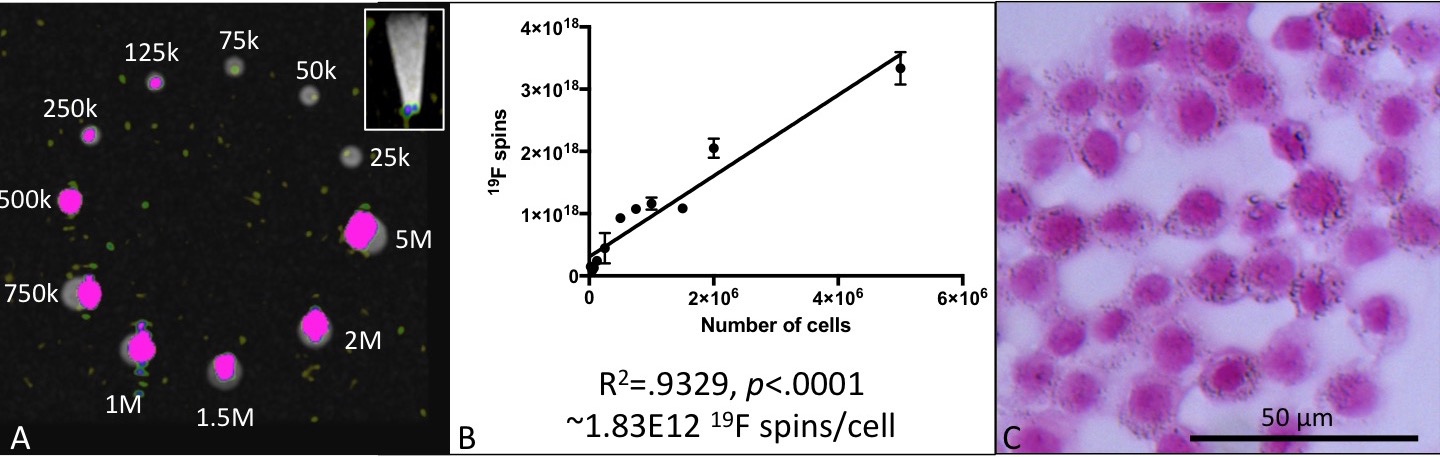
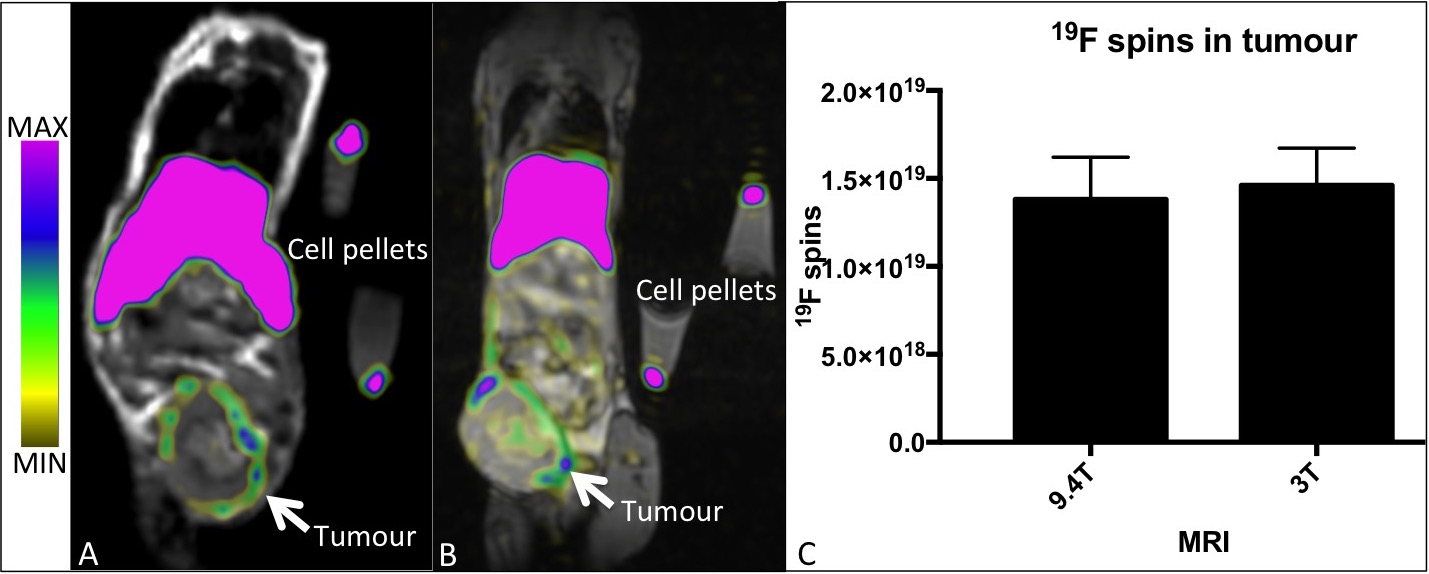
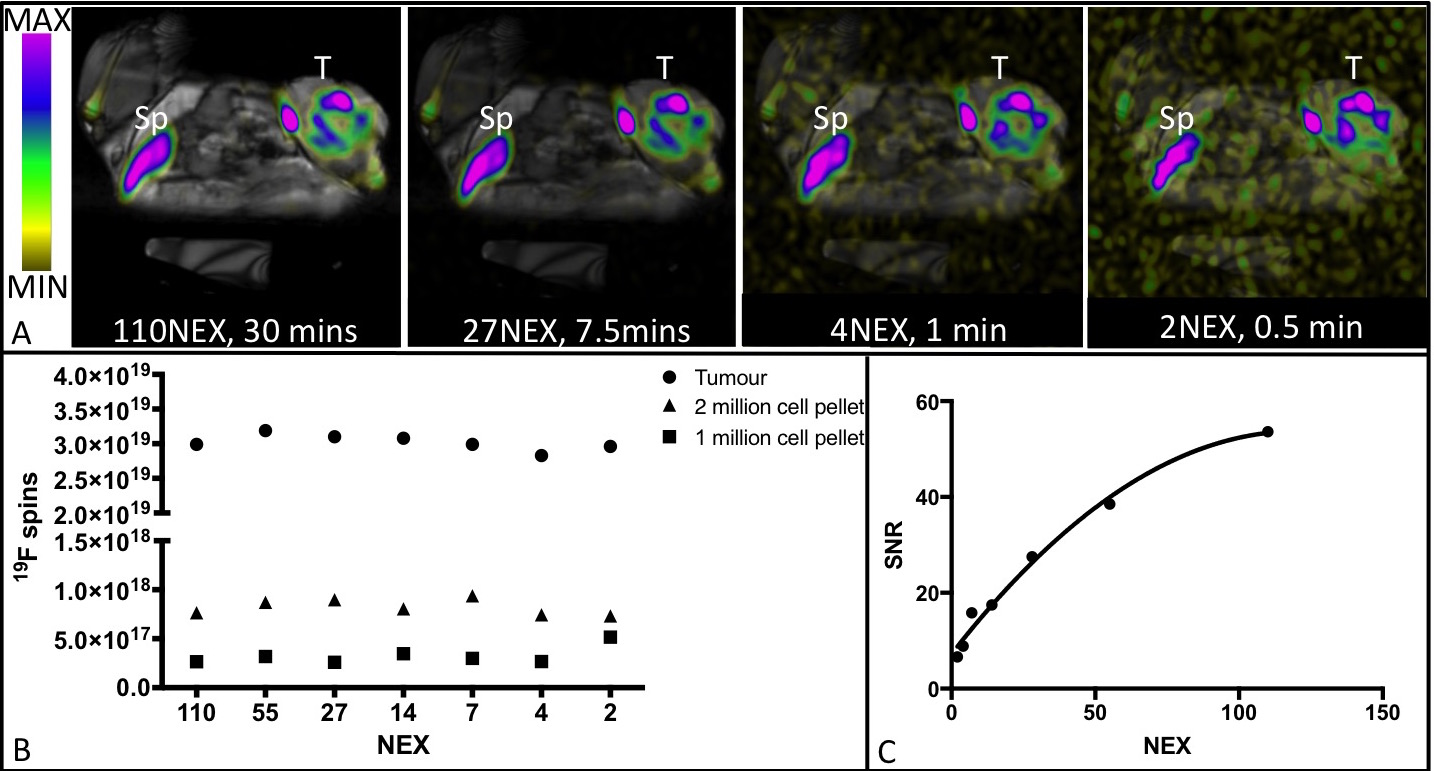
Figure 1 demonstrates a 1H/19F overlay MR image of PFC-labeled macrophage pellets at 3T. A detection limit of 25,000 cells was observed (Fig 1A inset: perpendicular image of 25,000 cell pellet 1H/19F overlay), with a linear correlation between cell number and number of 19F spins (R2=.9329, p<.0001) shown in Figure 1B. Cell pellets with lower numbers of PFC-labeled cells and no 19F signal detected are not shown. PFC droplets are visible without a marker in cells counterstained with nuclear fast red (Fig. 1C). The same 4T1 tumor bearing mouse was imaged at 9.4T (Fig. 2A) then immediately afterwards at 3T (Fig. 2B). 19F images appear similar and quantification of the number of 19F spins in the tumor (Fig. 2C) was not significantly different between the two scans (p>.05). 1H/19F MRI overlays with consistent window/level values demonstrate 19F signal visible in images acquired with 110 NEX/30 minutes to 2 NEX/0.5 minute (Fig. 3A). Figure 3B shows that the number of 19F spins measured in the 4T1 tumor and in the PFC-labeled cell pellets was not visibly different when the SNR was varied (110-2 NEX, 30-0.5 mins). Despite the much lower SNR of the shortest scan (2 NEX, 0.5 min) the quantification of 19F spins was equivalent to that in the highest SNR, (110 NEX, 30 mins). The relationship between NEX and SNR is demonstrated in Figure 3C. This imaging utilized a small surface coil which with mouse imaging did not demonstrate an obvious depth limitation. However, this may be present within human studies.Conclusions
This work demonstrates the ability to accurately quantify 19F spins at 3T with a short scan time which holds promise for clinical applications of 19F based cell tracking of TAMs.Acknowledgements
No acknowledgement found.References
1. Makela A V., Gaudet JM, Foster PJ. Quantifying tumor associated macrophages in breast cancer: a comparison of iron and fluorine-based MRI cell tracking. Sci Rep. 2017;7(42109).
2. Obeid E, Nanda R, Fu YX, Olopade OI. The role of tumor-associated macrophages in breast cancer progression. Int J Oncol. 2013;43(1):5-12. doi:10.3892/ijo.2013.1938.
Figures