3596
A Triple Modality Contrast Agent for Acoustic and Magnetic Particle Imaging (MPI) of Stem Cells1NanoEngineering, University of California, San Diego, La Jolla, CA, United States
Synopsis
Magnetic particle imaging is a novel and background-free imaging technique that offers good depth of penetration and high contrast of iron oxide nanoparticle tracers. Here, we combined MPI with acoustic imaging through multimodal polymeric nanoparticles. We used these nanoparticles for in vivo stem cell tracking.
Introduction
Magnetic particle imaging (MPI) detects iron oxide nanoparticles with zero background and through many centimeters of tissue. Thus, it can help improve stem cell tracking1,2. In cardiac stem cell therapy, methods to improve the injection and tracking of stem cells may help increase patient outcomes. Here we describe a multimodal approach that combines acoustic imaging with MPI3,4. The ultrasound offers real-time guidance of the injection event, and the MPI offers high contrast and deep-tissue imaging for long-term tracking of the implanted cells.Methods
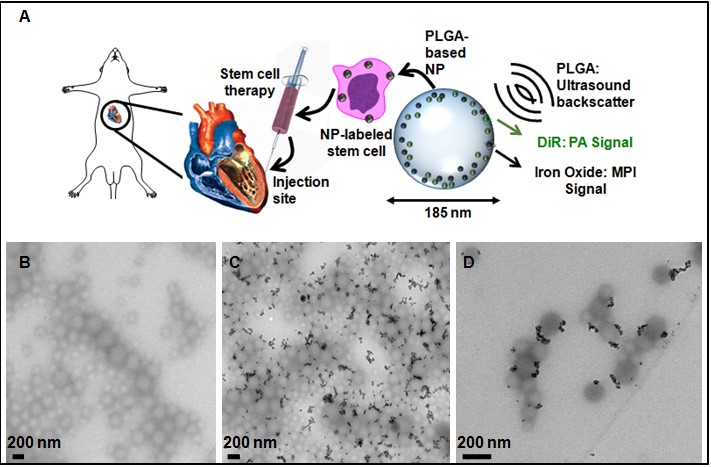
We created a poly(lactic-co-glycolic acid) (PLGA)-based iron oxide nanobubble labeled with DiR as a trimodal contrast agent5. The nanoparticles were characterized by dynamic light scattering and electron microscopy. All cell work used human mesenchymal stem cells (hMSCs). Cells were exposed to at varying concentrations of the nanoparticles (0-0.48 mg/mL) at a constant time (8 hours) to evaluate toxicity. Nude mice were used according to IACUC guidelines, injected with cells in the left ventricle wall, and imaged at 21 – 40 MHz with 730 nm excitation for ultrasound and photoacoustics with a VisualSonics scanner. The MPI imaging used a Momentum scanner from Magnetic Insight.Results and Discussion
The PLGA coating facilitated ultrasound signal, the DiR increased the photoacoustic signal, and the iron oxide facilitated the magnetic particle imaging signal (Fig. 1). The nanoparticles were 185 +/- 2 nm with a polydispersity index of 0.1. We evaluated a variety of labeling concentrations (0 - 0.48 mg/mL) and times (0.25 – 6 hours) and identified 240 μg/ml nanobubbles for 6 hours as optimal conditions. We confirmed that cell metabolism, proliferation, and differentiation ability were not adversely affected by cell treatment with the nanobubbles at these conditions. Flow cytometry data indicated that the labeled hMSCs retained markers CD90, CD73, and CD105. We could image down to 150,000 cells in vivo.
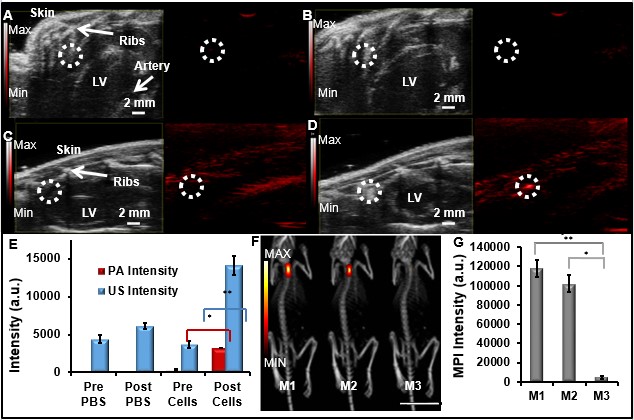
The nanobubble-labeled cells were injected intramyocardially into live mice for real-time imaging (Fig. 2). Ultrasound imaging showed a 3.8-fold increase in imaging intensity of labeled cells post-injection compared to baseline (n=3 mice; p<0.05); PA imaging showed a 10.2-fold increase in cardiac tissue signal post-injection (n=3 mice; p<0.05). The MPI intensity of the nanobubble-treated hMSCs injected into the hearts of mice was ~20-fold greater than the negative control.
Conclusion
This is the first report of multimodal magnetic particle imaging combined with acoustic imaging. This has significant implications for many areas of medicine where both high temporal resolution and good depth of penetration are required. Because MPI has no depth restrictions and is only sensitive to the iron oxide nanoparticle, there is inherent zero background for high contrast imaging of the cells. The acoustic modality offers 300 Hz imaging for instantaneous guidance of the cells into the LV wall. These features—combined with the low toxicity of this PLGA-based contrast agent—suggests that this approach could have broad utility in imaging regenerative medicine or cancer.Acknowledgements
We acknowledge NIH HL117048.References
1 Methods Mol Biol 1052, 1-10 (2013).
2 Am. J. Roentgen. 193, 314 (2009).
3 Phys Med Biol 54, L1-l10 (2009).
4 IEEE transactions on medical imaging 29, 1851-1859 (2010).
5 Colloids and Surfaces A: Physicochemical and Engineering Aspects 292, 125-130 (2007).
Figures