3595
In Vivo Murine Cardiac 19F MRI and Tracking of PFCE- and FuGENE-labeled Progenitor Stem Cells in the C57BL/6 Mouse1U. Oxford, Oxford, United Kingdom, 2Radboud University Medical Center, Nijmegen, Netherlands
Synopsis
Despite advances in the visualization of pre-labeled SCs with perfluorocarbon-ether-nanoparticles (PFCE-NPs) or other MRI contrast agents using 19F MRI, there have been no prior reports on murine cardiac 19F imaging of exogenously administered cardiac SCs following direct, intra-cardiac injections. To-this-date, human or murine in vivo cardiac studies have been limited, while prior reported imaging attempts in rats have been prohibitively lengthy, costly (use of multiple millions of cells/animal), and practically complex to reproduce in mice. We report herein significant enhancements of PFCE-NP label following labeling with the highly efficient agent FuGENE, thereby allowing in vivo murine cardiac 19F MRI visualization with minimal cellular toxicity.
Introduction
Despite advances in the visualization of stem cells (SCs) labeled with PFCE-NPs or other contrast agents [1-2] using 19F MRI, there have been no prior reports on murine cardiac 19F imaging of exogenously administered cardiac SCs following direct, intra-cardiac injections, while reported imaging attempts in rats have been prohibitively lengthy, costly, and practically complex to reproduce in mice [3]. We report increased uptake of PFCE-NPs following FuGENE labeling [4], allowing in vivo murine cardiac 19F MRI visualization. The purposes of this study are to: a) maximize the labeling efficiency of cardiac progenitor cells (CPCs) and the evoked 19F MRI signal/detectability, and b) quantify the temporal MR signal of labeled CPCs in vivo.Methods
Cell Isolation/Labeling: CPCs were isolated from adult, C57BL/6 mouse atria, plated in IMDM, and incubated with FuGENE (Promega, Madison, WI, USA) [4] and PFCE-containing fluorescent NPs (Atto647) for ~24 h. Cell pellet suspensions were used for MRI, confocal microscopy, and for flow cytometry after fixation in 2% paraformaldehyde solution. Successful labeling was confirmed using flow cytometry. CPC Injections: Mice (n=3) were anesthetized with 4% isoflurane (ISO), intubated, and ventilated with 100% oxygen. A left thoracotomy was performed, and FuGENE-labeled cells (~1.7-2×10⁶ CPCs in ~50 μl of IMDM media) were injected in the left ventricular myocardium. MRI/MRS: All experiments were conducted on a 9.4 T Agilent scanner (Agilent Technologies, USA) using a 40×20 mm2 butterfly for 19F-MRI [5]. In Vivo Cardiac 19F MRI/Cellular Tracking: C57BL/6 mice (adult female, 20-30 g, n=6) were anesthetized with 4% ISO, and were maintained with 1.5–2.0% ISO in 100% oxygen. Heart rates were maintained between 350–500 beats/min, and temperature at ~37°C. Three mice were sacrificed on day 1 (D1), two mice were rescanned at D4 and D7, and one mouse at D5 and D8. Poor visualization of 19F signal in one mouse after D1 was likely attributed to mis-localization of injected cells. 1H Imaging: Double-gated, two-dimensional (2D) cardiac multislice, and ungated 2D/3D cardiac 1H images were acquired in vivo (2D: TR/TE=1.9-2.1/1-1.1 ms/flip angle=20-50°/NEX=2-6/FOV=40×40 mm2/matrix= 128×128/acquisition time=3-5 min; 3D: TR/TE=1.9-2.13 /1-1.1 ms/flip angle=20-50°/NEX=2-6/FOV=40×40 mm2/matrix=128×128×128/ acquisition time =3-5 min). 19F MRI/MRS: Ungated 19F image acquisitions matched 1H acquisitions (2D: TR/TE=16.5/8.3 ms/flip angle=50°/NEX=768/FOV=40×40 mm2/1 slice/ST=5 mm/matrix=32×32/BW=2–4 kHz/acquisition time=2.4 min/and 8 phase encoding steps/segment; 3D: TR/TE=16.4/8.3 ms/flip angle=20-30°/NEX=12-72/FOV=40×40 mm2/matrix=32×32×32/BW=1-3 kHz/acquisition time=3-19 min). Image/Spectral Analyses: 19F images were imported and interpolated in ImageJ (NIH, Bethesda, USA) using bicubic spline interpolation to match the 1H matrix size and were overlaid on 1H MRI (opacity=30-70%). For in vitro studies, fluorine concentrations were evaluated by estimating the areas of spectral peaks under fully relaxed conditions with respect to a TFA reference standard. The mean signal was estimated as the average 19F signal from all images in the 3D stack in ImageJ [4-5]. MR spectra (TR=2 or 20 s/512 points/BW=20 kHz/NEX=4 or 16/α=90°) were processed in CSX (Johns Hopkins, USA) and IDL (Harris Geospatial, USA). Histology/Immunofluorescence Staining: Histological evaluation was performed on D1, D7 or D8 to assess CPC injection efficacy and retention sites. After excision, the hearts were dehydrated and fixed (4% methanol-free formaldehyde), processed, embedded in paraffin and sectioned. Sections were blocked for 2 h in DAKO® Protein Block (Thermo Fisher Scientific, UK), and incubated for 2 h with goat polyclonal anti-mouse Galectin 3 antibody (RnD Systems AF1197, Oxford, UK) followed by incubation with the secondary antibody donkey anti-goat Alexa Fluor 488 (A11055, Invitrogen, Thermo-Fisher Scientific, UK). Sections were washed and mounted with Fluoromount G mounting medium (Southern Biotech, USA) with DAPI, and imaged using a Leica bright-field optical microscope or a confocal microscope (Zeiss, Germany). Statistical Analyses: All results denote mean ± standard deviation.Results
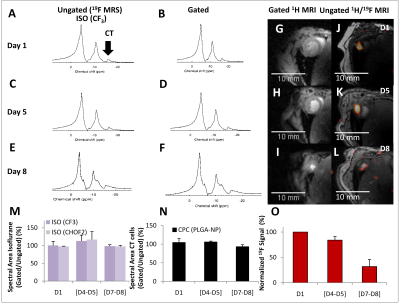
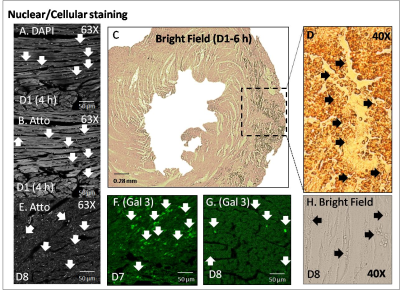
Ungated and gated, in vivo 19F MRS at D1, D5 and D7 are shown in Figure 1(A-F), showing accumulation of ISO in the lungs and the successful detection of FuGENE-labeled cells. High-resolution, gated 1H MRI are shown in Figure 1 (G-L) with separate overlaid 1H/19F MRI of FuGENE-labeled CPC cells at D1, D5, and D7. The 19F signal diminished to ~31% of its value at D1 over 7-8 days. Histology confirmed retention of injected cells (D1), infiltration of macrophages (Gal3) at D7/D8, and CPC dispersion from the injection site.Discussion
We demonstrate in vivo cardiac 19F MRI post-injection of labeled CPCs in the in vivo mouse. We have shown that the persistence/decrease of the 19F signal is primarily dependent on cell dispersion and migration from the injection sites, or lysing and subsequent release of the label into the extracellular space. The proposed protocol for cell preparation and injection has potential to be directly translatable to the clinic.Acknowledgements
We are thankful to Dr. J. Brown, Mr. A. Hale, Dr. A. Worth, and Dr. M. Benson, for their support and guidance with the cell cultures, flow cytometry studies, and FuGENE control studies. We are also most appreciative to Drs. A. Yavari and S. Ghaffari for providing us with FuGENE for initial experimentation studies and for useful discussions on the optimization protocol. Professor C. Lygate and Dr. J. Beglov are thanked for their support with mice intubations. Particular thanks are attributed to Professor J. Reader for his help and support with the electroporation studies, and to Professor L. Ferreira and Dr. A. Rai for useful discussions on the electroporation protocol. We also thank Dr. V. Clark, Mrs. H. Gray, Dr. M. Maguire, Mrs. L. Stork, and Ms. A. Vernet, for their help with the in vivo studies and for useful discussions on the control FuGENE MRS, use of the solenoid coil, and IDL processing (MM). The lead author is also grateful to Ms. L. Trelfa and Ms. V. Rashbrooke for their help with the histology studies.
The project has received funding from the European Union’s Horizon 2020 research and innovation programme under the Marie Sklodowska-Curie grant agreement No. 652986 (CC) European Research Council Grant ERC-2013-StG-336454 (MS) Wellcome Trust Core Award (090532/Z/09/Z)
References
1. Hoehn M, Kustermann E, Blunk H, Wiedermannm D, Trapp T, Wecker S, Focking M, Arnold H, Hescheler J, Fleischmann BK, Schwindt W, Buhrle C. Monitoring of implanted stem cell migration in vivo: a highly resolved in vivo magnetic resonance imaging investigation of experimental stroke in rat. Proceedings of the National Academy of Sciences 2002; 99(25):16267–16272.
2. Srinivas M, Cruz LJ, Boneto F, Heerschap A, Figdor CG, de Vries IJM. Customizable, multi-functional fluoricarbon nanoparticles for quantitative in vivo imaging using 19F MRI and optical imaging. Biomaterials 2010; 31:7070–7077.
3. Aday S, Paiva J, Sousa S, Gomes RSM, Pedreiro S, So PW, Carr CA, Cochlin L, Gomes AC, Paiva A, Ferreira L. Inflammatory modulation of stem cells by Magnetic Resonance Imaging (MRI)-detectable nanoparticles. RSC Advances 2014; 4:31706–31709.
4. Constantinides C, McNeill E, Benson M, Urruela RS, Padilla S, Malandraki-Miller S, Maguire ML, Swider E, Ghaffari S, Carr CA, Srinivas M, Schneider JE. Improvements in the cellular uptake of perfluorocarbon nanoparticles and 19F MRS/MRI detectability using the transfection agent FuGENE. ISMRM Workshop on Molecular and Cellular MRI: Focus on Integration: Amsterdam, Netherlands, June 2016.
5. Constantinides C, Maguire ML, Malandraki-Miller S, Swider E, Srinivas M, Carr CA, Schneider JE. Fast, Quantitative 19F MRI: Optimized Imaging Strategies. ESMRMB 2016, Vienna, Austria, October 2016, #122.
Figures

