3590
A new class of pH-responsive paraCEST agents for MRI1Advanced Imaging Research Center, UT Southwestern Medical Center, Dallas, TX, United States, 2Department of Chemistry, University of Texas at Dallas, Richardson, TX, United States
Synopsis
Many paraCEST agents have reduced sensitivity in vivo due to the reduction of the T2 relaxation of bulk water by T2ex exchange. Phosphonate coordinating side-chains in cyclen-based complexes exclude inner sphere water and this should reduce the interfering T2ex effects. In the new complexes reported here, a combination of phosphonate and hydroxypropyl pendant arms were incorporated to take advantage of the CEST signal from the Ln-bound OH. Protonation of the coordinating phosphonates results in a shift in the resonance frequency of Ln-bound OH CEST. These agents display several attractive features for imaging tissue pH in vivo by CEST MRI.
Introduction
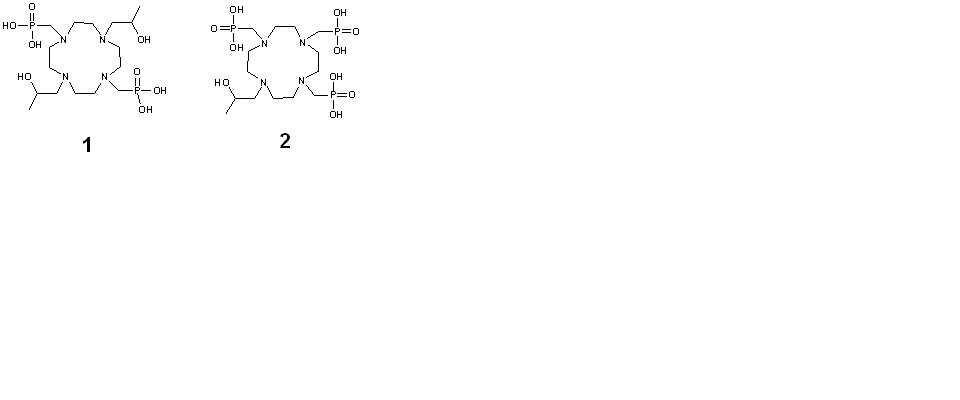
Paramagnetic lanthanide-based DOTA-tetraamide complexes provide an alternative to traditional MRI relaxation agents by a chemical exchange saturation transfer (CEST) mechanism. Selective radiofrequency saturation of the exchanging protons followed by chemical exchange of that proton with the bulk water results in a reduction of the magnetization of the bulk water proton spins, and are extremely sensitive to the proton exchange rates.1 The T1 and T2 relaxation times also have an influence on the magnitude of CEST effect. The agents designed so far for paraCEST are mostly based on the exchange of magnetization between the lanthanide bound inner sphere water molecule and the bulk water, which also causes a significant reduction of the bulk water T2 through a T2ex mechanism, affecting the sensitivity of the paraCEST effect.2 To eliminate the inner sphere water molecule, we designed ligands containing bulky phosphonate pendant arms and one or two hydroxypropyl side-arms with exchanging –OH groups that coordinate to the Ln3+ ion. (Chart 1).Methods
Ligands 1 and 2 were synthesized in multiple steps, starting from 1,7-bis(benzyloxycarbonyl)-cyclen and 1,4,7-tris(benzyloxycarbonyl) respectively. The pendant arm that contains the exchanging –OH group is formed by the ring opening reaction between an epoxide and the di- or tri - protected cyclen. The phosphonates were introduced by reacting the deprotected product with triethylphosphite and formaldehyde. Acid hydrolysis of the phosphonate diethyl ester groups gave the final ligand in reasonable yields. The Yb3+ complexes of free ligands 1 and 2 were synthesized by the reaction of the free ligand with YbCl3 in water at pH 6. The 1H, 31P NMR and paraCEST spectra, were recorded in water on a Varian/Agilent VNMRS direct drive spectrometer operating at 400 MHz and 161 MHz, respectively.Results and discussion
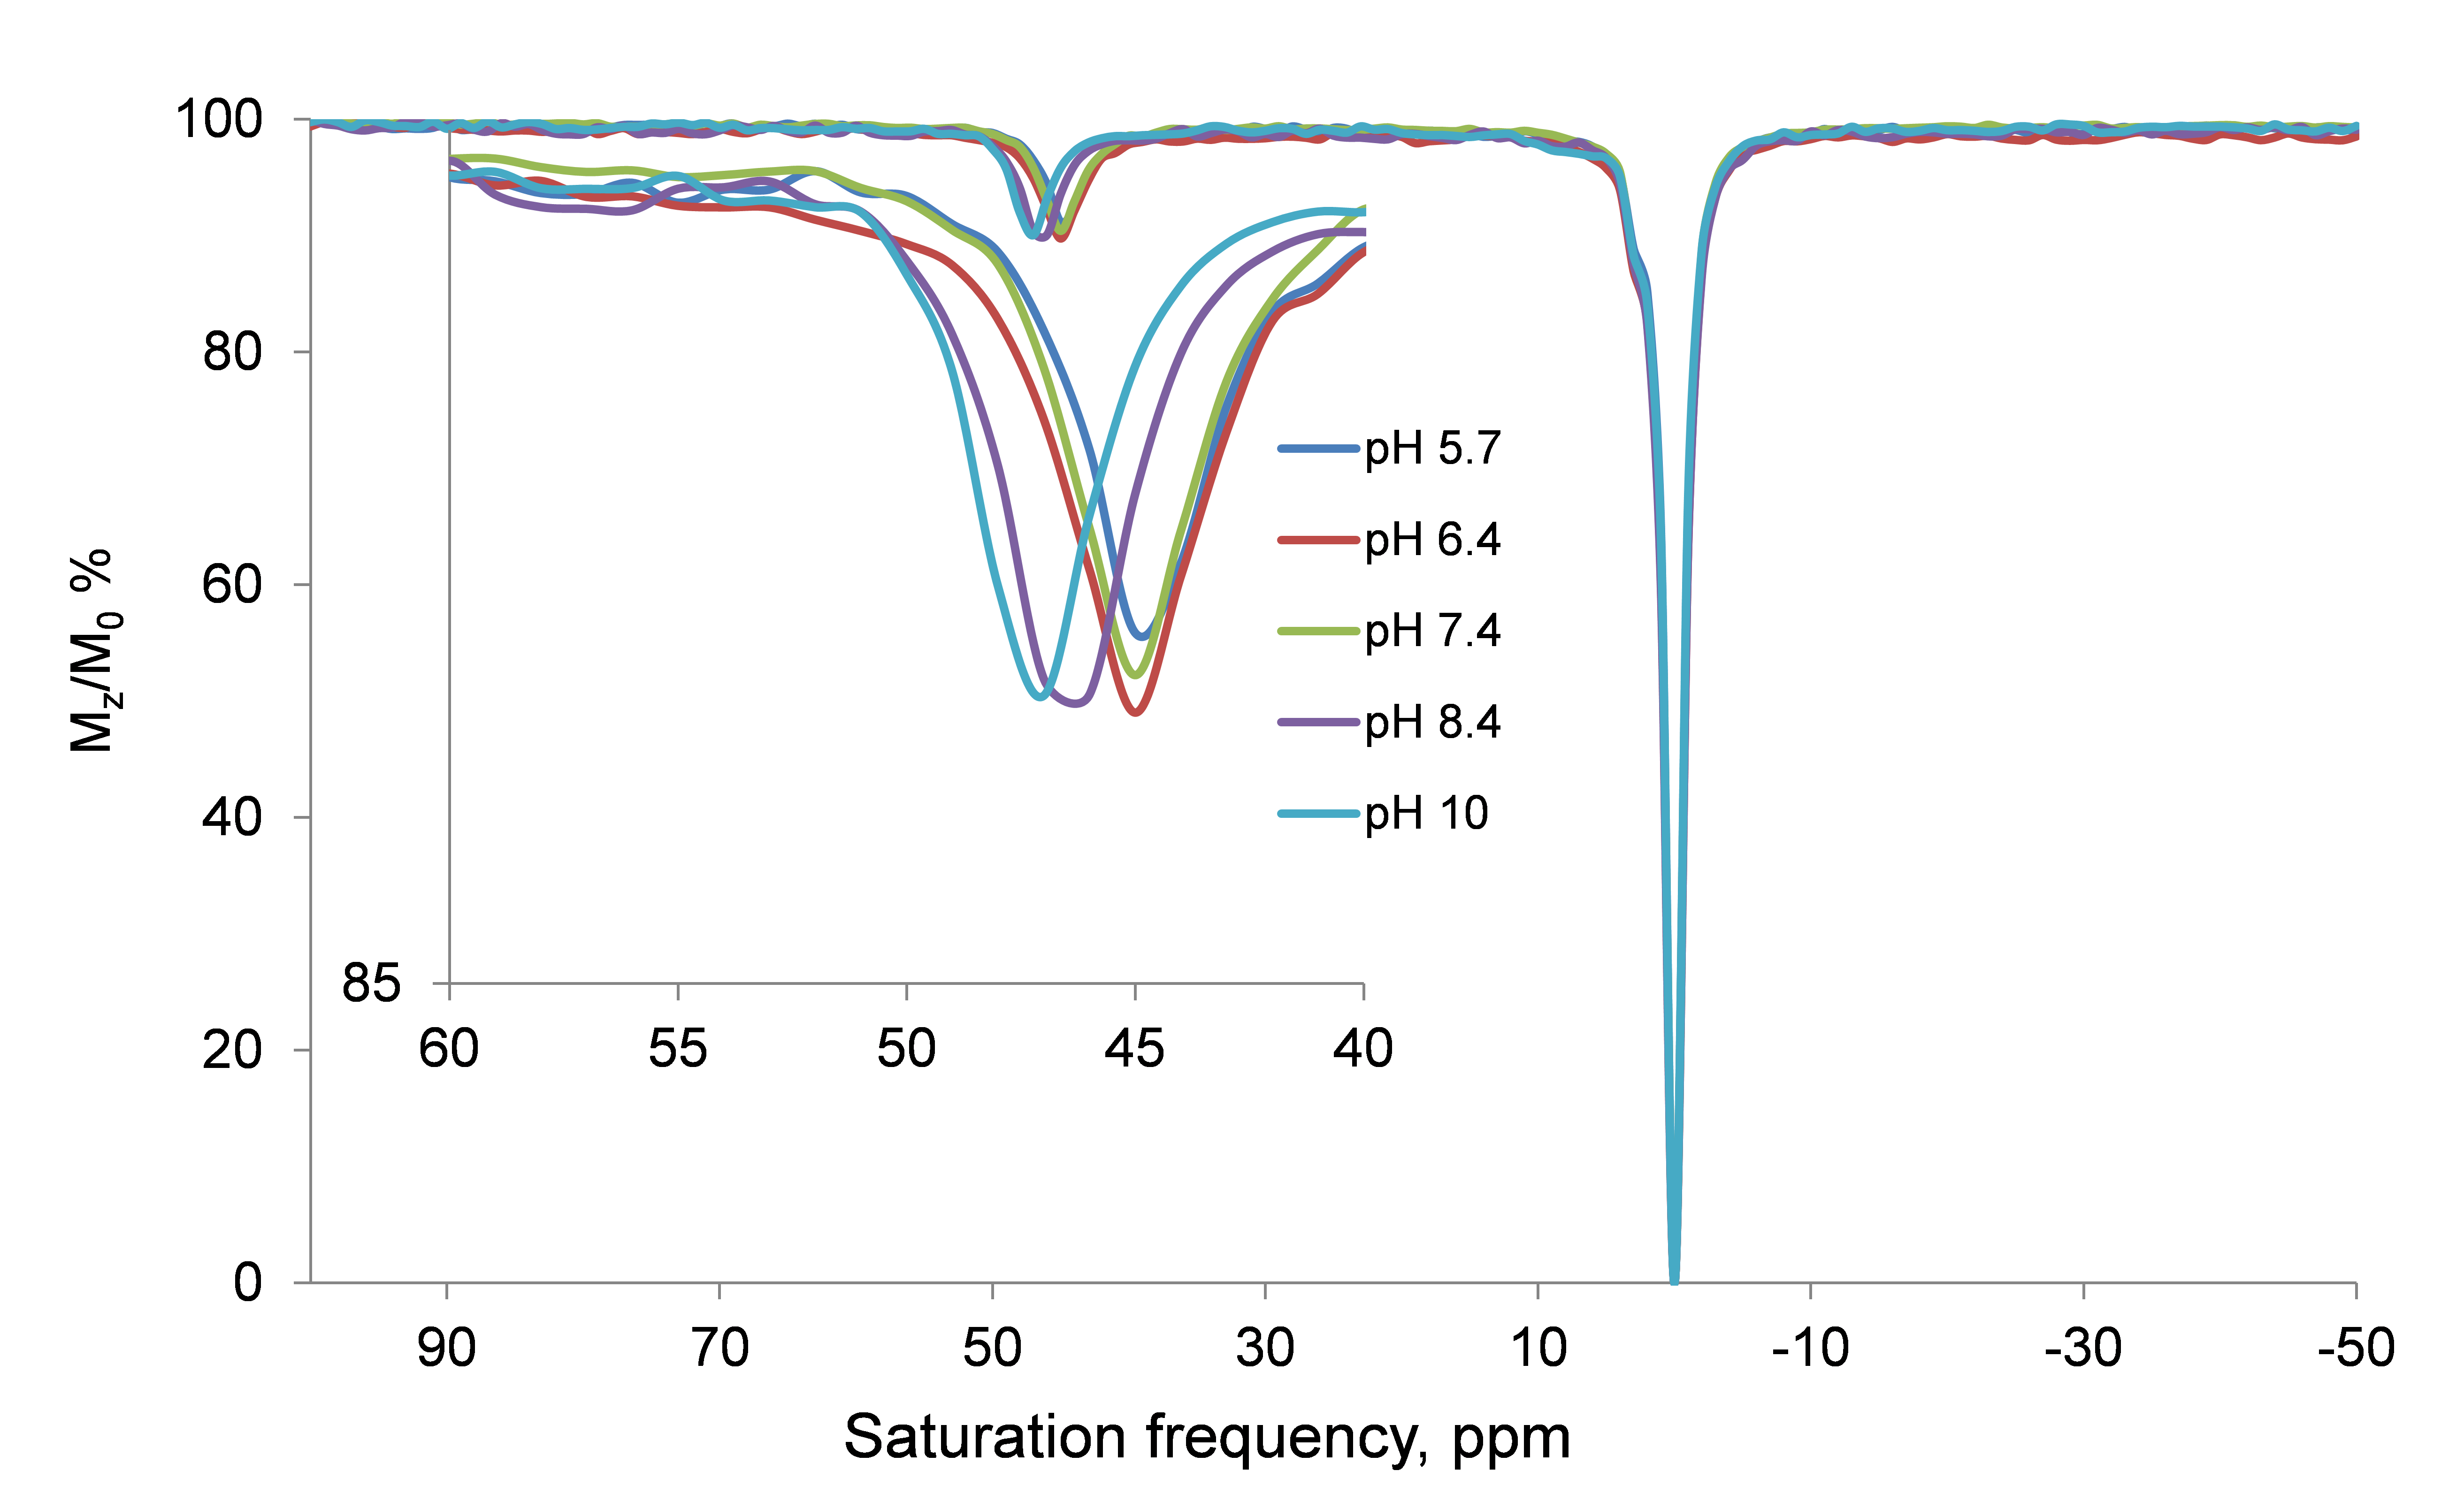
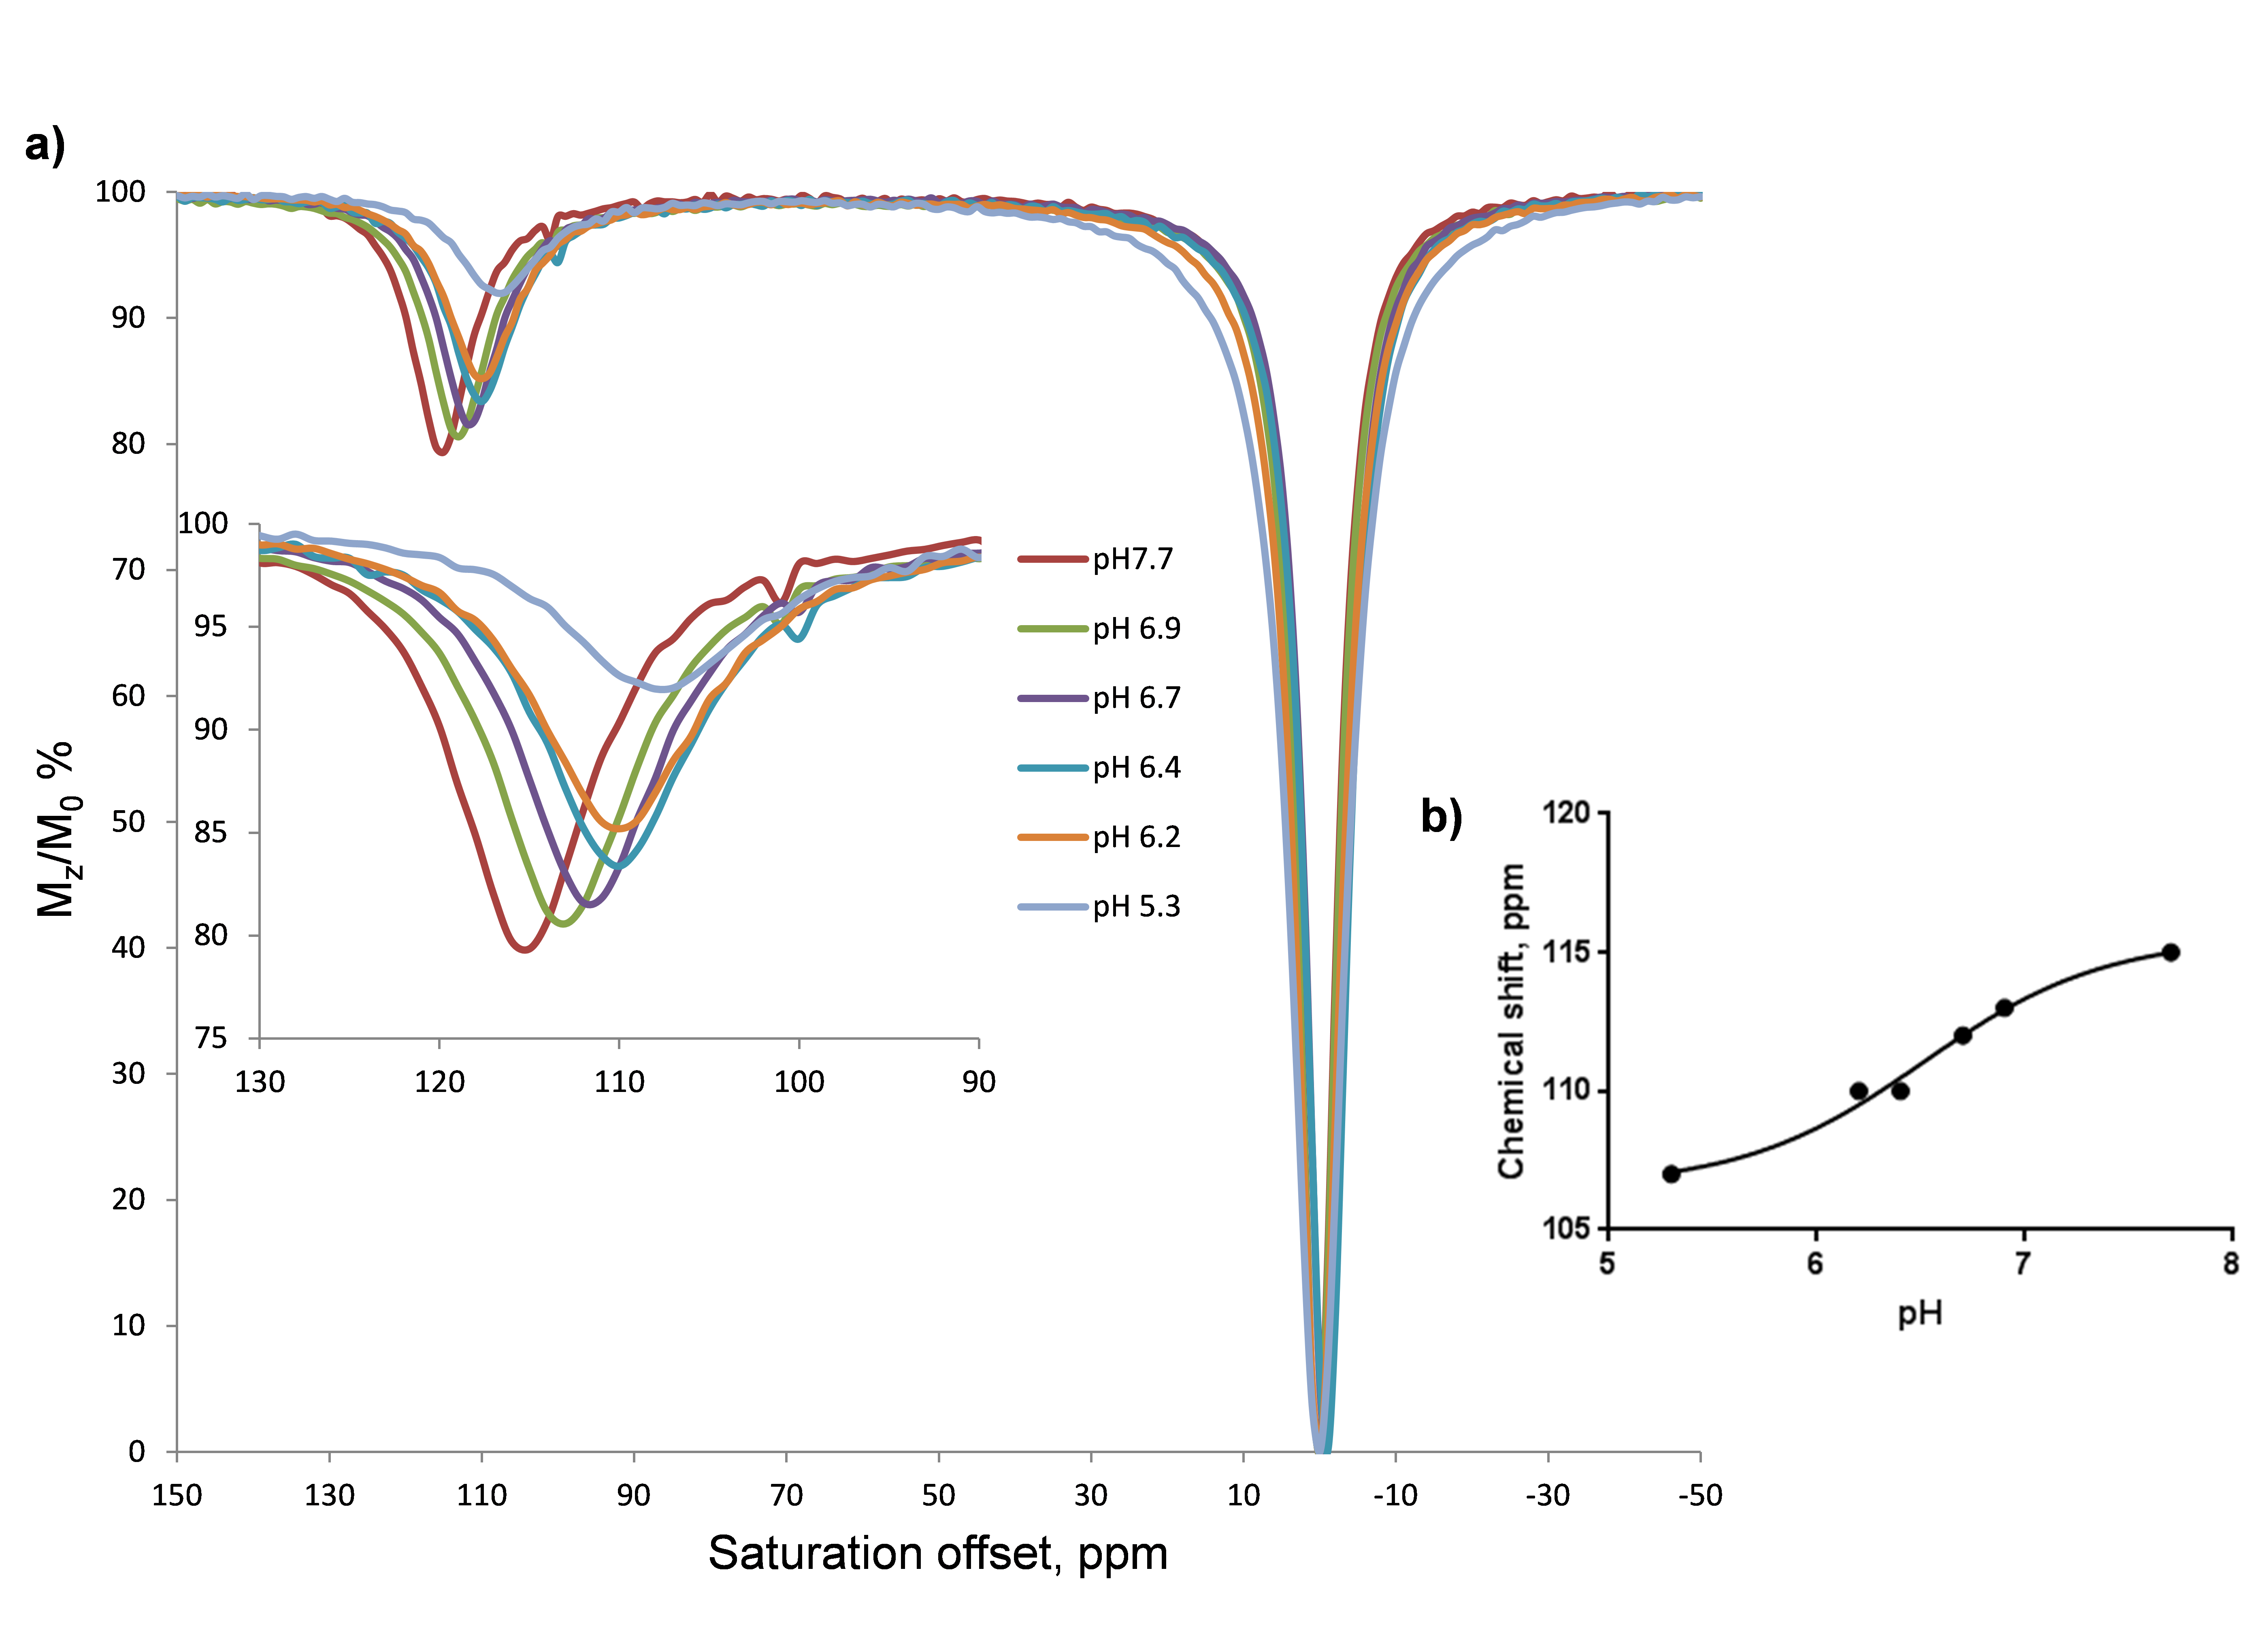
The 31P NMR chemical shifts of the phosphonate groups in Yb-(1) recorded at different pH values shows an upfield shift with increasing pH. However, the chemical shift dispersion in the biologically relevant pH range is not significant. The paraCEST spectrum of Yb-(1) in water at 25° C shows a CEST peak arising from the exchange of the coordinated –OH proton with the bulk at ~45 ppm but it only shifts about one ppm with pH in the biologically relevant range (Figure 1). The chemical shift of the H4 protons of Yb-(1) in water revealed that these complexes have twisted square antiprism (TSAP) geometry, the geometry that displays the smallest hyperfine shifted resonances in the 1H NMR spectrum. Therefore, we turned our attention to a ligand that has three phosphonate and one exchanging -OH in the pendant arms (2). 1H NMR studies showed that Yb-(2) adopts a square antiprism geometry (SAP) in solution and also showed large 31P chemical shift dispersion in the biologically relevant pH range. The CEST spectrum of Yb-(2) in water at 25°C displays a single CEST peak at ~125 ppm arising from the exchange of the lanthanide coordinated –OH proton with the bulk water protons. The CEST peak shifts from 120 ppm at pH 5 to about 135 ppm at pH 7.5. The line-width and the intensity of the CEST peak do not change significantly in this pH range. Calibration curves obtained by plotting the frequency of the proton exchange CEST peak versus pH reveal that this agent could be used to read the pH solely on the basis of the observed chemical shift of the exchanging –OH proton (Figure 2). As expected, at 37°C, the observed hyperfine shifts were smaller and the CEST peak shifts from 109 ppm at pH 5 to 117 ppm at pH 7.7. The intensity of the -OH CEST peak also decreased somewhat at lower pH values (Figure 3).Conclusions
Complex Yb-(1) with two –OH exchanging sidearm and two phosphonate pendant arms adopts a TSAP geometry and consequently, the CEST signal was not large (within the MT window) and not very sensitive to pH. On the other hand, the complex with one –OH group and three phosphonate pendant arms [Yb-(2)] was found to adopt the SAP geometry, and the CEST peak of the bound OH was shifted outside the MT window (125 ppm). In addition, the frequency of the CEST peak showed about 8 ppm dispersion in the biologically relevant pH range and temperature, making this complex an ideal candidate for pH imaging in vivo.Acknowledgements
This project was supported by NIH grants R01-CA115531 and P41-EB015908.References
1) Viswanathan, S; Kovacs, Z., Green, K. N.; S. James Ratnakar, Sherry, A. D., Chem. Rev., 2010, 110, 2960 - 3018.
2) Todd C. Soesbe, S. James Ratnakar, Mark Milne, Shanrong Zhang, Quyen N. Do, Zoltan Kovacs, and A. Dean Sherry, Magn. Res. Med., 2014, 71, 1179 - 1185
Figures