3569
Combined FDG-PET and hyperpolarized pyruvate-MRSI (hyperPET) for cancer metabolic phenotyping – a pilot studySissel Bisgaard1, Andreas Ettrup Clemmensen1, Abubakr Eldirdiri2, Helle Hjorth Johannesen1, Jan Henrik Ardenkjær-Larsen2, Adam Espe Hansen1, and Andreas Kjær1
1Department of Clinical Physiology, Nuclear Medicine & PET and Cluster for Molecular Imaging, Rigshospitalet and University of Copenhagen, Copenhagen, Denmark, 2Center for Hyperpolarization in Magnetic Resonance, DTU Elektro, Technical University of Denmark, Kgs. Lyngby, Denmark
Synopsis
Molecular imaging of cancer metabolism in vivo is increasingly employed in clinical settings. Both 18F-FDG PET and hyperpolarized [1-13C]pyruvate MRSI are sensitive to glucose metabolism but differ in which part of the glycolytic pathway is probed. We hypothesize that hyperPET may improve cancer specific metabolic phenotyping. Simultaneous 18F-FDG PET and hyperpolarized [1-13C]pyruvate MRSI (hyperPET) was used in a pilot study, examining the metabolic characteristics exhibited by four different cancer cell lines in nude mice. The results indicated that the combined modalities may distinguish between cancer types.
Introduction
18F-FDG PET and hyperpolarized [1-13C]pyruvate MRS both characterize glucose metabolism but differ in which part of the glycolytic pathway is probed1,2. Here, simultaneous 18F-FDG PET and hyperpolarized [1-13C]pyruvate MRS (hyperPET) was employed in a controlled cancer metabolism study, examining the metabolic characteristics exhibited by four different cancer cell lines. The primary purpose was to examine the possibility of identifying cancer-specific metabolic behaviors based on combined hyperPET measures of metabolism.Materials
Two carcinoma cancer cell lines (PC-3, FaDu) and two non-carcinoma cancer cell lines (HT-1080, U-87 MG; gliobastoma and fibrosarcoma) were used and a total of 32 NMRI nude female mice were included in the experiment. The mice were divided into four groups and inoculated subcutaneously in each flank. This model resulted in a total of 36 eligible tumors. The experiments were performed in a 3T PET/MR (mMR Biograph, Siemens Healthcare, Erlangen) using 1H/13C transmit/receive flex coil (RAPID Biomedical, Germany). Two mice were imaged at a time with tumors aligned vertically. The hyperpolarized [1-13C]pyruvate sample was prepared using SPINlab (GE Healthcare, Millwaukee, WI, USA). The sample compound was composed of 14M [1-13C]pyruvic acid and 15 mM trityl radical (AH111501)3. A 0.5 mL sample was polarized for a minimum of 120 min. The polarized sample was dissolved and neutralized producing a 250 mM solution of pyruvate.Methods
18F-FDG PET (20 MBq) was acquired dynamically for 60 min. T2-weighted MRI was used to plan a single-slice MRSI through all tumors. A symmetric EPSI sequence with a trapezoidal readout gradient and ramp sampling was employed for spectroscopic data acquisition [TR 70 ms, TE 2.4 ms, field of view 84x80 mm2, matrix size 16x16, flip angle 6 degrees, slice thickness 18 mm, spectral bandwidth 641 Hz, 64 spectral points, repeated for 30 frames with 1.9 s between frames, resulting in a TA of 1.29 minutes]. The acquisition commenced with the injection of the hyperpolarized 13C-pyruvate (8 mL/kg) simultaneously into the tail vein of both animals. FDG-PET was reconstructed from 50-60 minutes using 3 iterations, 21 subsets and 2 mm filter. EPSI data reconstruction was performed by separating the odd and even echoes4. Peak areas of [1-13C]pyruvate, [1-13C]lactate, [1-13C]pyruvate-hydrate and [1-13C]alanine were determined using a general linear model and integrated over time to provide Area-Under-Curve (AUC) maps. AUC maps were subsequently interpolated to 256x256 images. Maximum AUC(lactate)/AUC(pyruvate) ratio, pyruvate-to-lactate transfer constant kPL5, and FDG uptake expressed as standard uptake value (SUV) were measured in tumor ROIs. The ratio between measures of lactate generation and FDG uptake were employed as a combined expression of cancer cell glycolysis and compared between groups of carcinoma and non-carcinoma tumors.Results
Figure 1 shows representative images obtained from simultaneous 18F-FDG PET and hyperpolarized [1-13C]pyruvate MRSI. The images display expected uptake patterns, with increased FDG and lactate/pyruvate uptake in tumor regions. Maximum tumor AUC(lactate)/AUC(pyruvate) to SUVmean ratios differed between cancer types, showing a significant increase for non-carcinomas compared to carcinomas (P = 0.006) as seen in figure 2.A. The same trend occurred when normalizing the maximum AUC(lactate)/AUC(pyruvate) with SUVmax values (P = 0.030). Finally, a significant difference was also present for the pyruvate-to-lactate transfer constant kPL when normalized by the SUVmean values (P = 0.020, Figure 2.B.) but not SUVmax (P = 0.088). SUVmax and SUVmean did not differ between cancer types. kPL and both the SUVmean and SUVmax values were significantly correlated (P = 0.019 and P = 0.040) within the non-carcinoma group, but not the carcinoma group (data not shown).Discussion
The hyperPET combination of 18F-FDG PET and hyperpolarized [1-13C]pyruvate MRSI, but not FDG uptake alone, was found to be able to differentiate between carcinomas and other cancer cell types. The combination of 18F-FDG PET and hyperpolarized [1-13C]pyruvate provides valuable information in relation to cancer-specific glucose metabolism: The FDG uptake reflects total glucose turnover whereas hyperpolarized 13C -pyruvate MRS more specifically expresses the shift to aerobic glycolysis, i.e. the Warburg effect, typical of cancer cells. The cancer cell lines were chosen to represent carcinomas and non-carcinomas, representing a rough grouping of cancer types. Hence the data presented serves as a proof of principle of the ability of the method to differentiate cancer cells type.Conclusion
The applied approach introduces new possibilities within the field of molecular imaging. The results indicate the possibility of deeper metabolic phenotyping by the combination of 18F-FDG PET and hyperpolarized [1-13C]pyruvate MRSI, here exemplified by the differentiation of carcinomas and non-carcinomas.Acknowledgements
No acknowledgement found.References
- Gallagher FA, Bohndiek SE, Kettunen MI, Lewis DY, Soloviev D, and Brindle KM. (2011). Hyperpolarized 13C MRI and PET: In Vivo Tumor Biochemistry. J Nucl Med 2011; 52:1333–1336 DOI: 10.2967/jnumed.110.085258
- Gutte H, Hansen AE, Johannesen HH, Clemmensen AE, Ardenkjær-Larsen JH, Nielsen CH, & Kjær A. (2015). The use of dynamic nuclear polarization (13)C-pyruvate MRS in cancer. American Journal of Nuclear Medicine and Molecular Imaging, 5(5), 548-60.
- Chen, A. P., Albers, M. J., Cunningham, C. H., Kohler, S. J., Yen, Y.-F., Hurd, R. E., Tropp, J., Bok, R., Pauly, J. M., Nelson, S. J., Kurhanewicz, J. and Vigneron, D. B. (2007), Hyperpolarized C-13 spectroscopic imaging of the TRAMP mouse at 3T—Initial experience. Magn. Reson. Med., 58: 1099–1106. doi:10.1002/mrm.21256
- Eldirdiri A, Posse S, Hanson LG, Hansen AE, Ardenkjær-Larsen JH. (2017). Echo Planar Spectroscopic Imaging of Hyperpolarized 13C in a Clinical System with Reduced Chemical Shift Artifacts. ISMRM 2017 ID: 2371381825
- Hill DK, Orton MR, Mariotti E, Boult JKR, Panek R, et al. (2013). Model Free Approach to Kinetic Analysis of Real-Time Hyperpolarized 13C Magnetic Resonance Spectroscopy Data. PLoS ONE 8(9): e71996. doi:10.1371/journal.pone.0071996
Figures
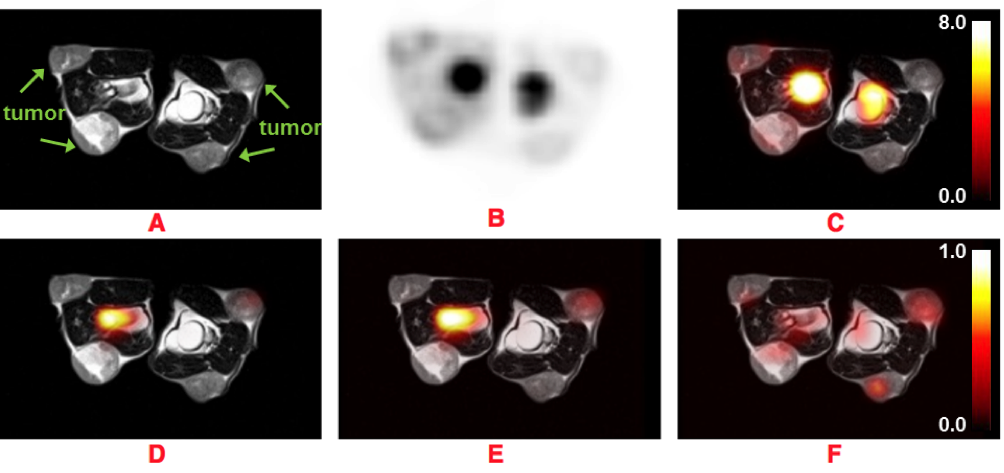
Figure 1: Images obtained from simultaneous 18F-FDG PET and hyperpolarized 13C-pyruvate MRSI of two mice. The top row shows anatomical reference T2-TSE image (A), a static reconstruction (B) of the dynamic PET from 50-60 min post-injection, and the combined fusion in units of SUV (C). The bottom row shows AUC metabolite images; pyruvate (D), lactate (E), and lactate-to-pyruvate ratio (F) respectively. High FDG uptake regions correspond to bone marrow whereas high lactate and pyruvate regions to a vessel.
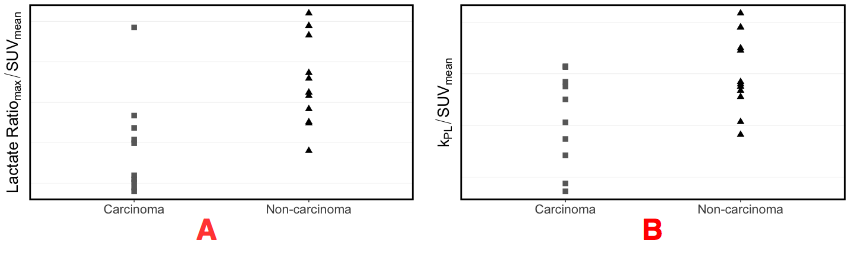
Figure 2: Comparison of glycolytic measures between carcinomas and non-carcinomas. The maximum lactate/pyruvate ratio normalized by SUVmean (A). The difference in means between the two groups was significant with a p-value = 0.006. The maximum pyruvate-to-lactate rate constant (kPL) normalized by SUVmean (B). The difference in means between the two groups was significant with a p-value = 0.020.