3567
Susceptibility-Induced Distortion Correction in Hyperpolarized Echo Planar Imaging1Oxford Centre for Clinical Magnetic Resonance Research, University of Oxford, Oxford, United Kingdom, 2Department of Physics, University of Oxford, Oxford, United Kingdom, 3Department of Physiology, Anatomy and Genetics, University of Oxford, Oxford, United Kingdom, 4Sunnybrook Research Institute, Toronto, ON, Canada
Synopsis
Echo Planar Imaging is an attractive rapid imaging readout that can image hyperpolarized compounds in vivo. By alternating the sign of the phase encoding gradient waveform, spatial offsets arising from uncertain frequency shifts can be determined. We show here that blip-reversed EPI can also be used to correct for susceptibility and $$$B_0$$$ inhomogeneity effects that would otherwise produce image-domain distortion in the heart, through the use of an estimated deformation field that is calculated from the acquired data.
Purpose
Hyperpolarized [1-$$$^{13}$$$C]pyruvate forms a versatile metabolic probe that has been used extensively to quantify cardiac metabolism and pH in health and disease.[1-5] Many conditions where metabolic dysregulation is implicated are often spatially localized, such as myocardial ischaemia. Echo Planar Imaging (EPI) is an attractive fast imaging readout to use for hyperpolarized experiments, owing to simplicity,[6-8] speed, commonly availability on commercial scanners, and the fact that it produces artefacts that are analytically understood. Within the context of hyperpolarized imaging, there are three main sources of artefact that need to be overcome: (1) the Nyquist ghost; (2) image-domain distortions such as compressions, expansions, and tearings that arise from susceptibility changes and their associated $$$B_0$$$ effects; and (3) slight errors in the central transmitter frequency that lead to frequency shifts. Here we show with 3D-spectral spatial EPI that by acquiring alternate images with the sign of the phase encoding direction reversed, it is possible to estimate geometric distortions and off-resonance artefacts simultaneously, and hence reconstruct undistorted images.
Methods
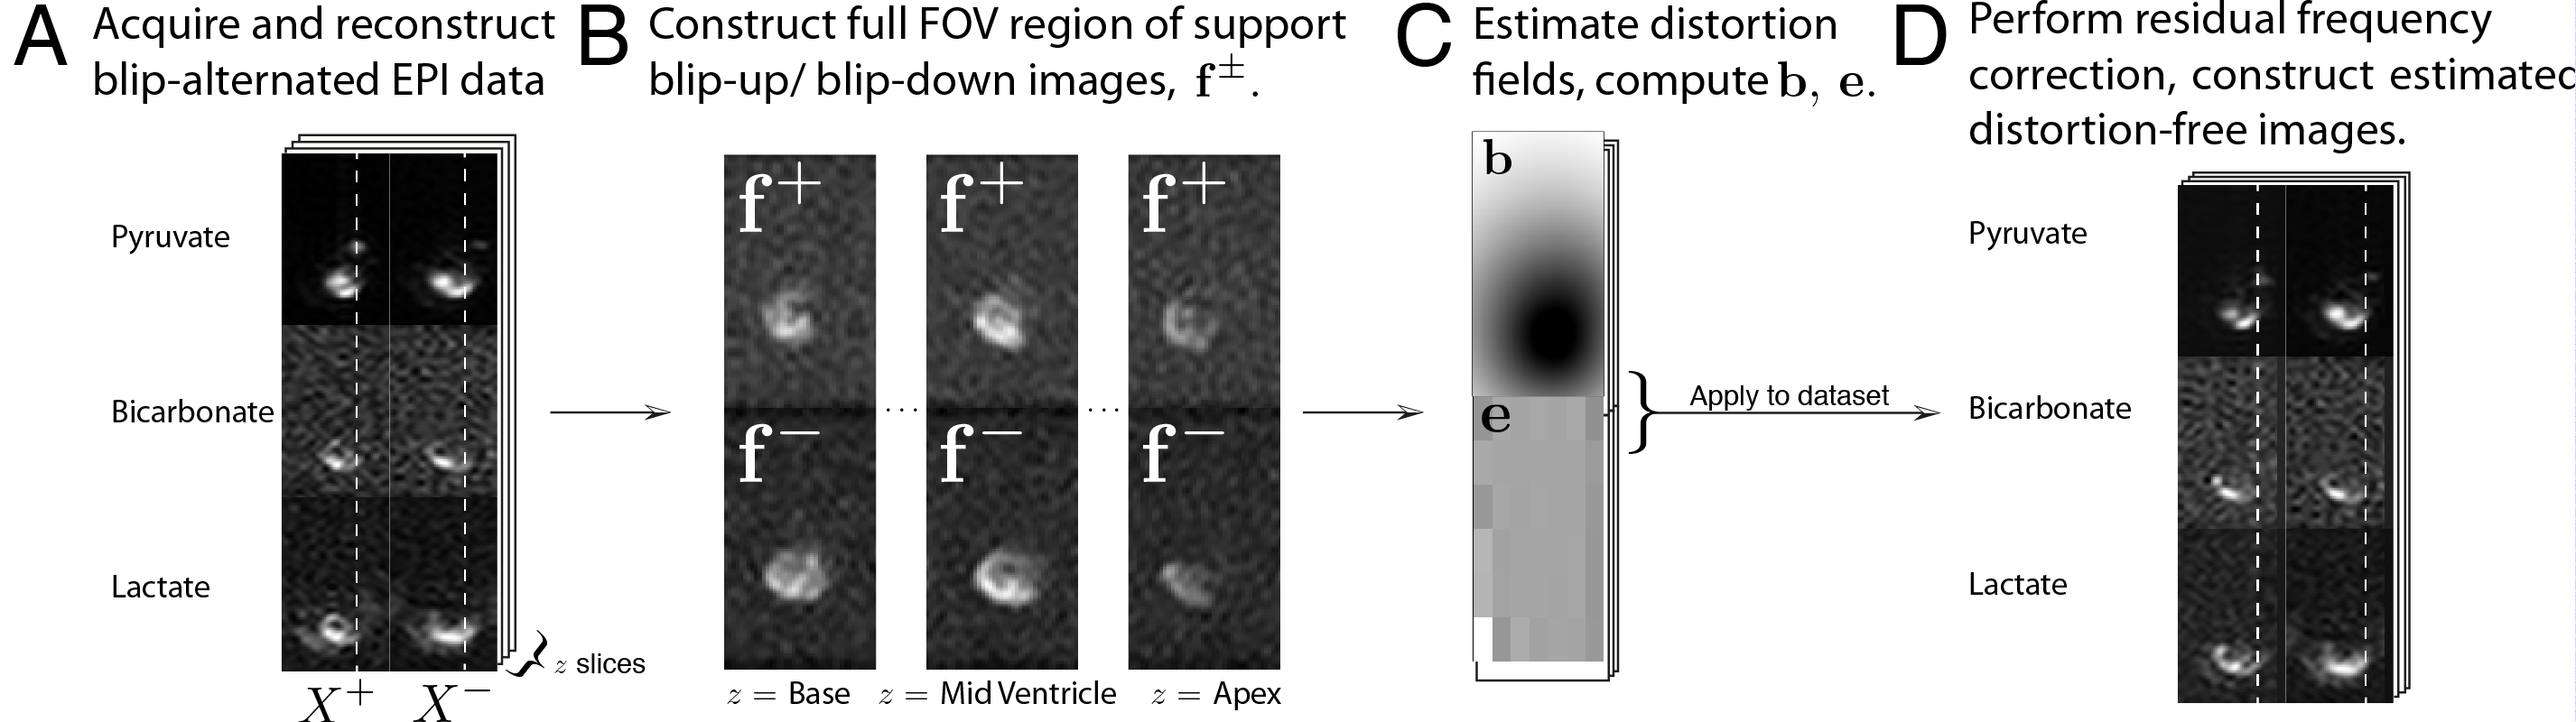
$$$^{13}$$$C-images were acquired either from a phantom or the healthy fed rat heart after infusion of hyperpolarized [1-$$$^{13}$$$C]pyruvate via a 3D-spectral-spatial EPI sequence described previously.[9] The reconstruction algorithm was as follows:
- Regrid data, correcting for the Nyquist ghost via either the use of Navigator echoes or direct minimisation, then Fourier transform and performing a multicoil recombination if appropriate.
- For each metabolite, correct for bulk frequency shifts by grossly aligning the blip-up and blip-down images along the readout direction.
- Construct a pair of blip-up/blip-down SNR-weighted mean images $$$\mathbf{f}_\pm$$$ from all metabolites acquired, scaled to maximum metabolite level. We performed this via obtaining a mean of the SNR-weighted sum of each metabolite time course, i.e. if $$$\sigma_{™}$$$ represents the relative noise (relative to maximum signal) term in image $$$X_{xyztm}^{\pm}$$$ where $$$t$$$ represents time, $$$m$$$ metabolite, and the $$$\pm$$$ label denotes the overall sign of the phase encoding gradient waveform, compute \begin{equation} \mathbf{f}^{\pm} = \frac{1}{M \sum_{tm}(1/\sigma_{tm}^2)} \sum_{m=1}^{M} \sum_{t=1}^{T} \frac{1}{\sigma_{tm}^2} X_{xyztm}^{\pm}.\end{equation}
- Subsequently, estimate a deformation field $$$\mathbf{b}\in\mathbb{R}^3$$$ consistent from the blip-up to blip-down data that satisfies\begin{equation}\label{eqn:topup}\text{argmin}_{\mathbf{b}} \left ( \sum_{c=1}^{m} \, \left [\,\mathbf{f}_{c+}^{\intercal} \quad \mathbf{f}_{c-}^{\intercal} \right ] \,\,\mathbf{R}_c(\mathbf{b})\, \begin{bmatrix}\mathbf{f}_{c+} \\\mathbf{f}_{c-}\end{bmatrix} \right) \end{equation}where $$$\mathbf{f}$$$ is the acquired data, and $$$\mathbf{R}(\mathbf{b})$$$ an operator that can be estimated given knowledge of the taken $$$k$$$-space trajectory.[1]
- Apply the computed $$$\mathbf{b}^{\mp}$$$ to each acquired image $$$X$$$ to estimate a stack of undistorted images.
- Correct for residual frequency shifts (i.e. alternating translations) via the affine registration algorithm separately for each metabolite, and obtain two (Hermitian) matrices $$$\mathbf{c},\mathbf{d}$$$ mapping between the sets of images.
- Construct the interpolator $$$\mathbf{e}=\sqrt{\sqrt{\mathbf{c}} \sqrt{\mathbf{d}}}$$$ (here via a Schur method[11,12]), apply it, and hence obtain a distortion-corrected registered volumetric stack for each time point and metabolite. Note that the Hermiticity of $$$\mathbf{c},\,\mathbf{d}$$$ ensure that their square root exists.
This method is graphically illustrated in Fig. 1.
Results
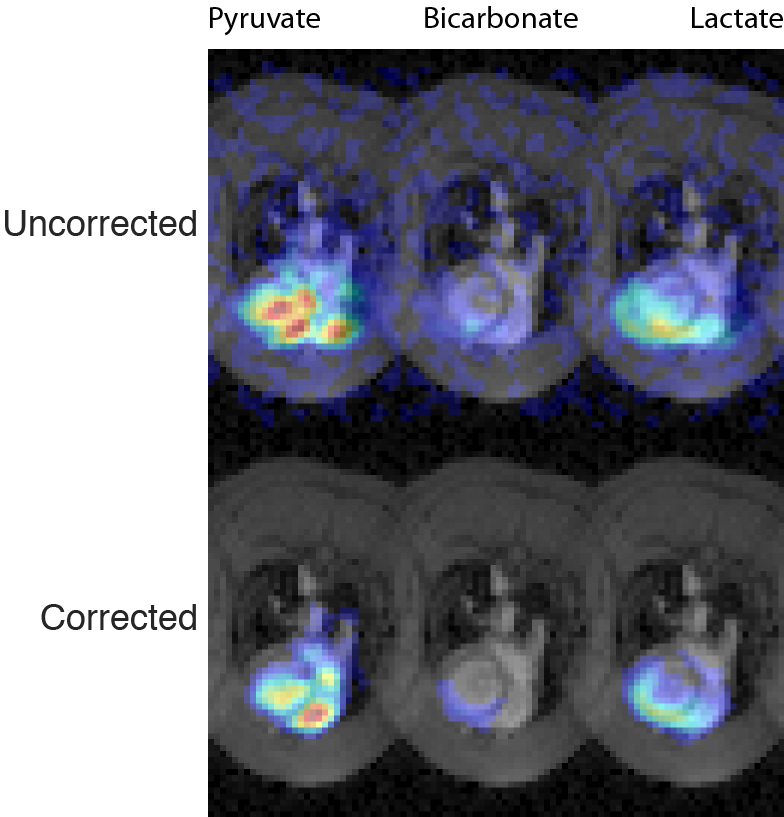
We found that the method proposed is able to correct for susceptibility artefacts arising in the rodent heart or phantoms, even in the low SNR environment of hyperpolarized imaging experiments (Fig. 2).
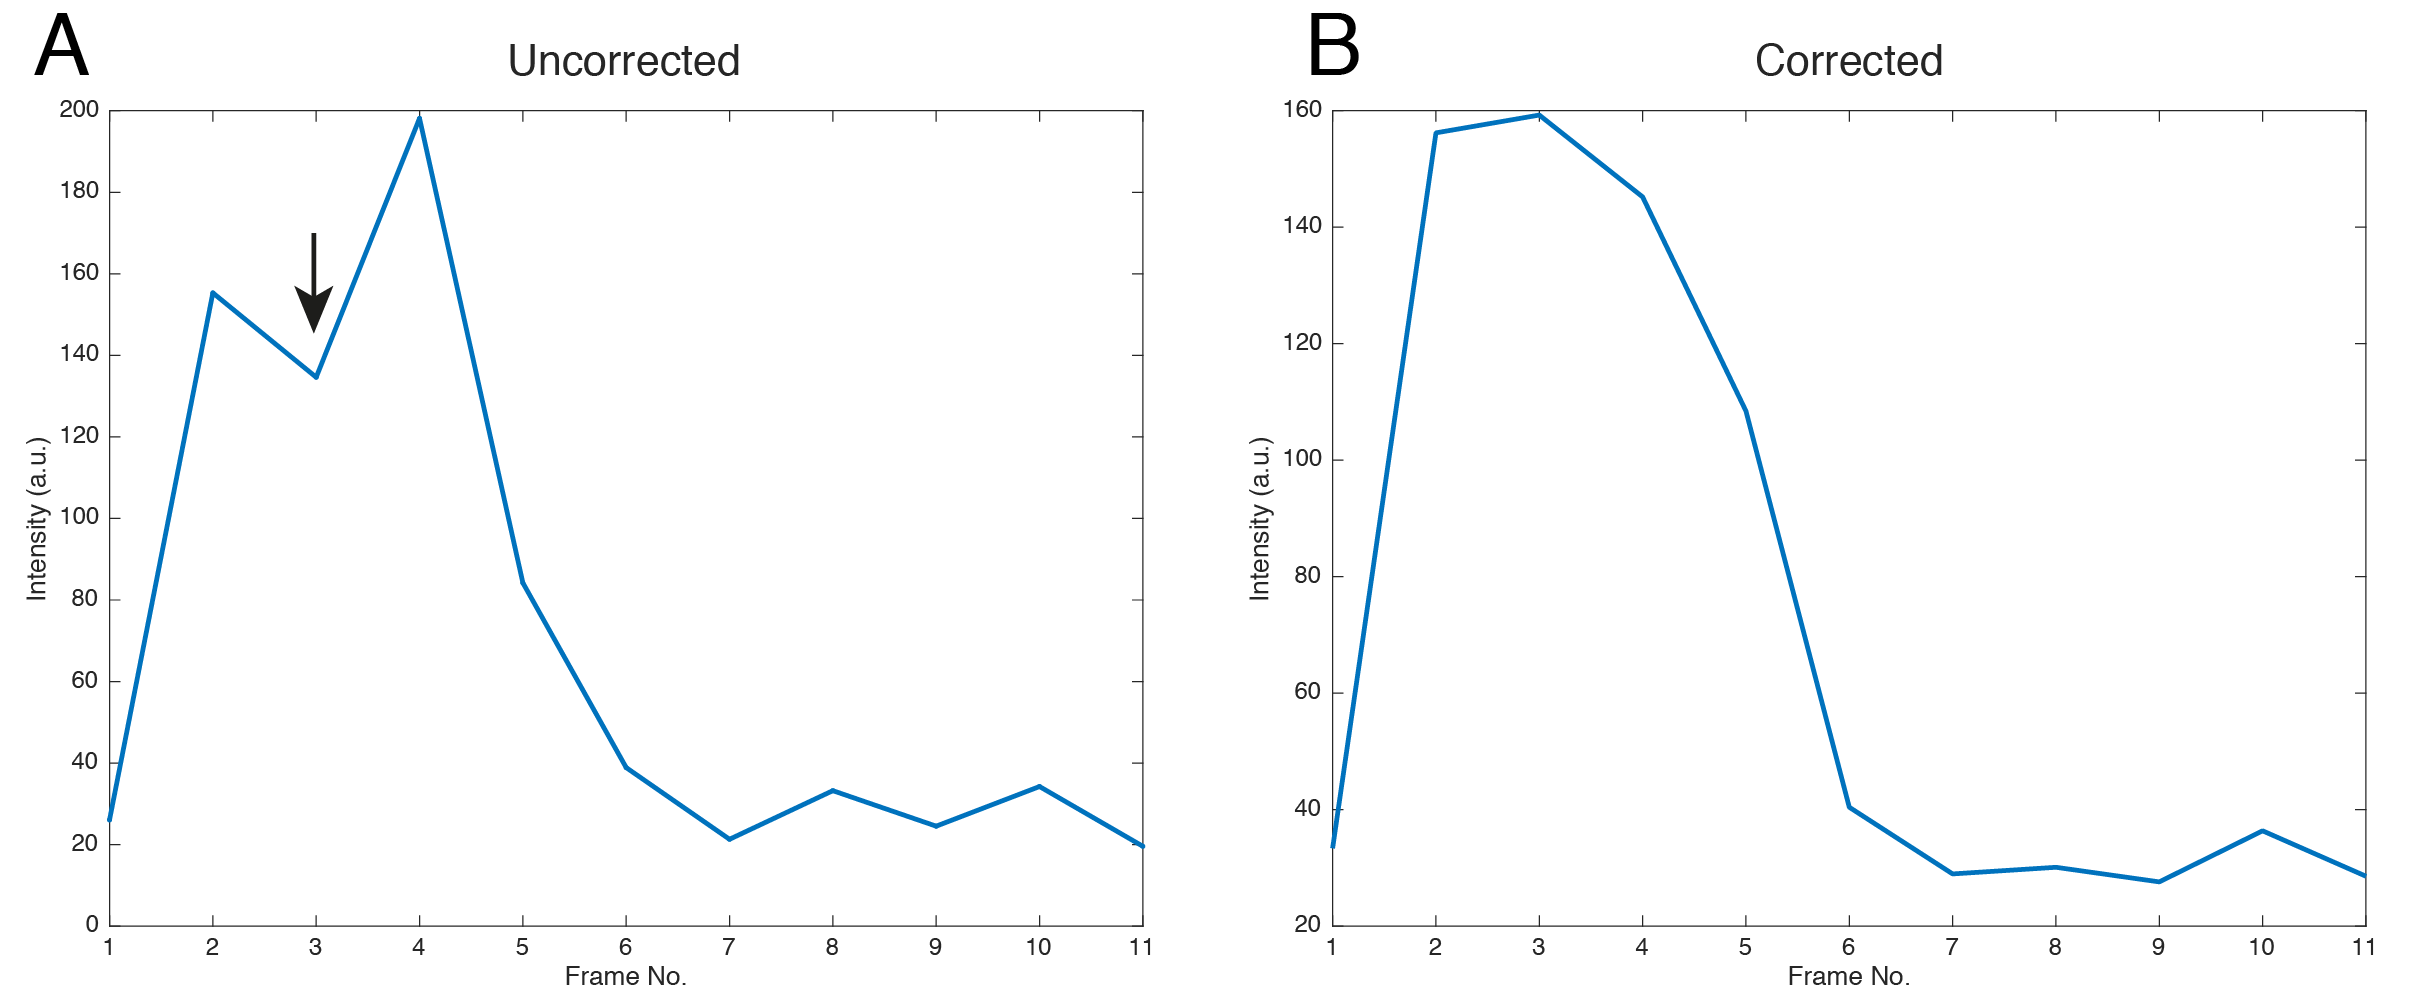
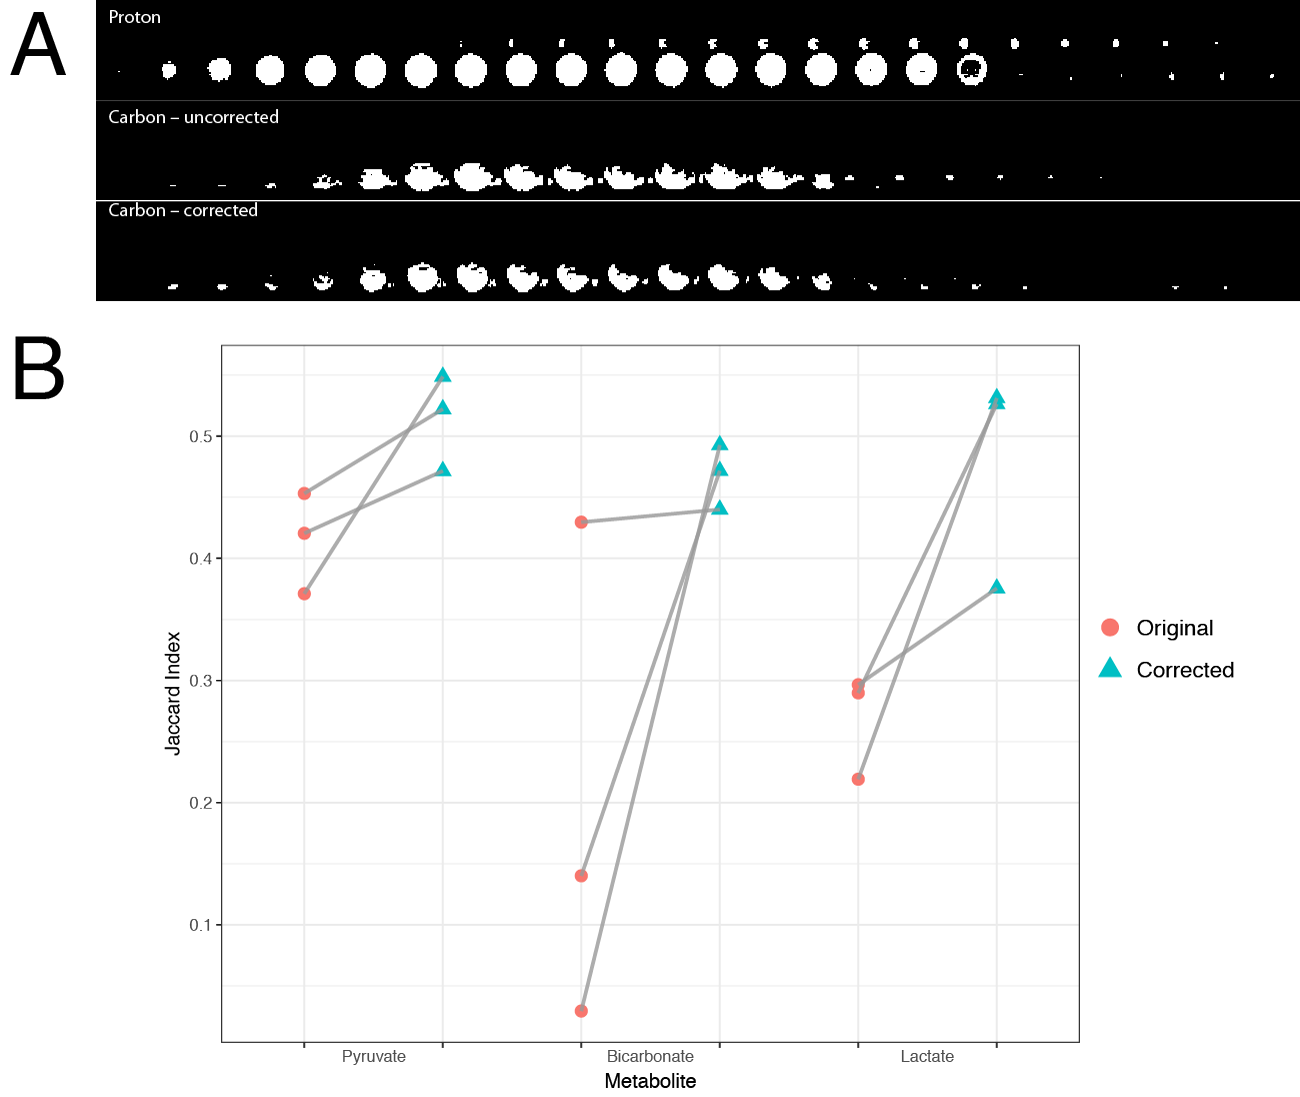
By plotting the through-time behaviour of a single voxel any compression/stretching artefacts present would be observed as alternating regions of high/low signal on alternate frames, as the object imaged 'moves' between acquisitions. Such a profile is shown pre- and post-correction in Fig. 3. The Jaccard self-similarity index between odd and even frames was significantly increased by use of the technique, which indicates that alternating compression/expansion artefacts on nearly identical bright regions have been ameliorated.
Discussion and Conclusion
The proposed distortion correction algorithm is able to ameliorate image-domain shifts in hyperpolarized EPI data that are believed to come from cardiac susceptibility artefacts, despite the varying image SNR and multidimensional nature of hyperpolarized datasets. The use of image-domain distortion correction algorithms, such as that proposed here, can ameliorate susceptibility artefacts present in all EPI readouts, including those of hyperpolarized experiments, and represents a straightforward extension to other methods previously proposed.[13,14] The non-uniform and temporally varying SNR necessarily present within hyperpolarized experiments necessitates care in their application to the data. We have shown a particular algorithm is able to ameliorate image-domain shifts and better co-register acquired data to underlying anatomy.Acknowledgements
We would like to acknowledge the National Institute for Health Research Oxford Biomedical Research Centre program, the British Heart Foundation and EPSRC. JJM would like to thank Nvidia Corporation for the gift of a GPU which was used in this work, and Jesper Anderson for both maintaining topup and promptly fixing segfaults that the author identified in the course of this work.References
[1] L. M. Le Page, D. R. Ball, V. Ball, M. S. Dodd, J. J. Miller, L. C. Heather, D. J. Tyler, NMR Biomed. 2016, 29, 1759–1767.
[2] A. J. M. Lewis, J. J. J. Miller, C. McCallum, O. J. Rider, S. Neubauer, L. C. Heather, D. J. Tyler, Diabetes 2016, db160804.
[3] A. Z. Lau, J. J. Miller, D. J. Tyler, Magn. Reson. Med. 2017, 77, 1810–1817.
[4] A.-M. L. Seymour, L. Giles, V. Ball, J. J. Miller, K. Clarke, C. A. Carr, D. J. Tyler, Cardiovasc. Res. 2015, 106, 249–260.
[5] M. A. Schroeder, L. E. Cochlin, L. C. Heather, K. Clarke, G. K. Radda, D. J. Tyler, Proc. Natl. Acad. Sci. U. S. A. 2008, 105, 12051–6.
[6] P. Mansfield, J. Phys. C Solid State Phys. 1977, 10, L55–L58.
[7] C. B. Ahn, J. H. Kim, Z. H. Cho, IEEE Trans. Med. Imaging 1986, 5, 2–7.
[8] M. Stehling, R. Turner, P. Mansfield, Science (80-. ). 1991, 254, 43–50.
[9] J. J. Miller, A. Z. Lau, I. Teh, J. E. Schneider, P. Kinchesh, S. Smart, V. Ball, N. R. Sibson, D. J. Tyler, Magn. Reson. Med. 2015, 75, 1515–1524.
[10] M. Jenkinson, C. F. Beckmann, T. E. J. Behrens, M. W. Woolrich, S. M. Smith, Neuroimage 2012, 62, 782–790.
[11] Å. Björck, S. Hammarling, Linear Algebra Appl. 1983, 52-53, 127–140.
[12] N. J. Higham, A new sqrtm for Matlab, 1999.
[13] C. H. Cunningham, W. Dominguez Viqueira, R. E. Hurd, and A. P. Chen, “Frequency correction method for improved spatial correlation of hyperpolarized 13C metabolites and anatomy.,” NMR Biomed., vol. 27, no. 2, pp. 212–8, Feb. 2014.
[14] B. J. Geraghty, J. Y. C. Lau, A. P. Chen, and C. H. Cunningham, “Dual-Echo EPI sequence for integrated distortion correction in 3D time-resolved hyperpolarized 13 C MRI,” Magn. Reson. Med., Apr. 2017.
Figures