3562
Improving robustness of hyperpolarized 13C MRSI using k-t spiral acquisitions1Medical Physics, University of Wisconsin-Madison, Madison, WI, United States, 2Morgridge Institute for Research, Madison, WI, United States, 3Laboratory for Optical and Computational Instrumentation, University of Wisconsin-Madison, Madison, WI, United States, 4Radiology, University of Wisconsin-Madison, Madison, WI, United States, 5Biomedical Engineering, University of Wisconsin-Madison, Madison, WI, United States
Synopsis
Hyperpolarized 13C MRSI with chemical shift encoding relies on a priori knowledge of the N 13C-labeled metabolite resonances and N+1 echoes to fully determine the reconstruction. However, the a priori frequencies may shift due to B0 inhomogeneity, local susceptibilities, or motion, causing spectral leakage, blurring, and biased quantitative measures. To address these uncertainties, we apply IDEAL-based k-t spiral imaging with field-of-view oversampling to further constrain the signal model-based reconstruction in situations where the echo-spacing may be suboptimal, and we test the results in digital simulations, phantom experiments, and in vivo studies of murine renal metabolism. Results support improved metabolic quantification.
Introduction
Many hyperpolarized 13C multi-spectral imaging methods rely on a priori knowledge of the number, N, and resonant frequencies of the 13C-labeled metabolites expected in the sample.1 Commonly used IDEAL-based approaches acquire N+1 echoes spaced by ΔTE, chosen to maximize the metabolites’ number of signal averages (NSA).2 However, B0 inhomogeneity, local susceptibilities, and motion can all shift expected resonances, rendering selected ΔTEs suboptimal and causing spectral leakage and blurring in reconstructed images. This work investigates using k-t spiral MRSI3 to further constrain IDEAL reconstructions by providing additional phase information between more densely spaced spiral arms, thereby reducing artifact severity when the selected ΔTE is suboptimal for the distribution of experimental metabolite resonances.Methods
k-t spiral imaging with a direct-IDEAL reconstruction3 was evaluated using digital simulations3, phantom, and in vivo experiments. For all k-t spiral acquisitions, gradients were derated to maintain a 30ms readout. For all digital simulations and phantom experiments, k-t spirals (nominal field-of-view (FOV)=32×32mm2, nominal matrix=16×16) with oversampling factors η=1-7 were tested for good and poor choices of ΔTE, providing NSAs approximately equaling the number of echoes (NE) and ~0, respectively. Metabolite ratios were calculated for each image. All imaging was performed on a 4.7T small animal scanner (Agilent Technologies, Santa Clara, CA) using a dual-tuned 1H/13C volume coil (Doty Scientific, Columbia, SC) and 13C-enriched compounds from Cambridge Isotope Laboratories, Inc. (Tewksbury, MA).
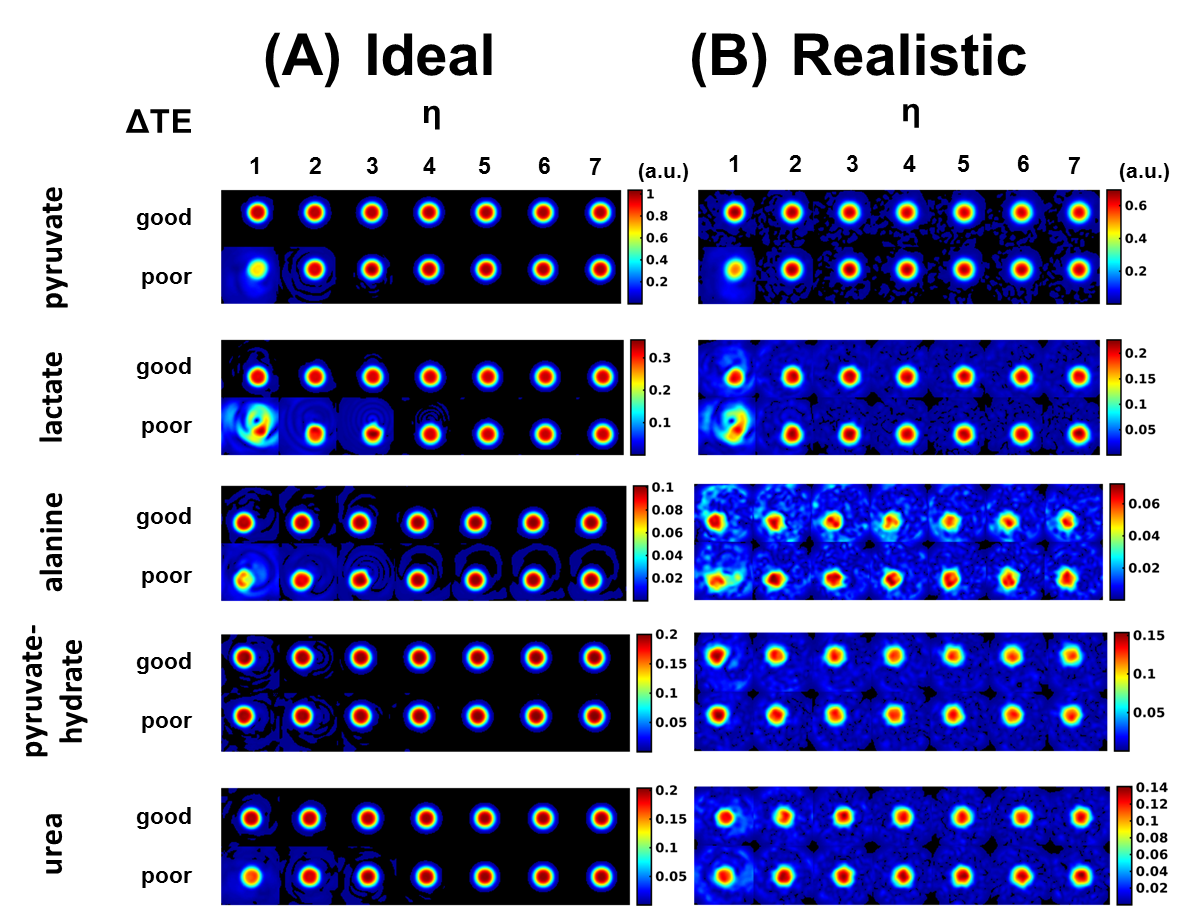
Digital simulations, performed in Matlab (R2015b, The MathWorks, Natick, MA), contained [1-13C]pyruvate (0ppm, relative amplitude (RA)=1.00), [1-13C]lactate (12.2ppm, RA=0.33), [1-13C]alanine (5.4ppm, RA=0.10), [1-13C]pyruvate-hydrate (8.6ppm, RA=0.20), and 13C-urea (-7.3ppm, RA=0.20) imaged with good (1.871ms) and poor (1.630ms) ΔTEs. Ideal (T2*=∞, B0=homogeneous, noise=0%) and realistic (T2*=15ms, B0 inhomogeneity=50Hz, noise=10%) conditions were tested.
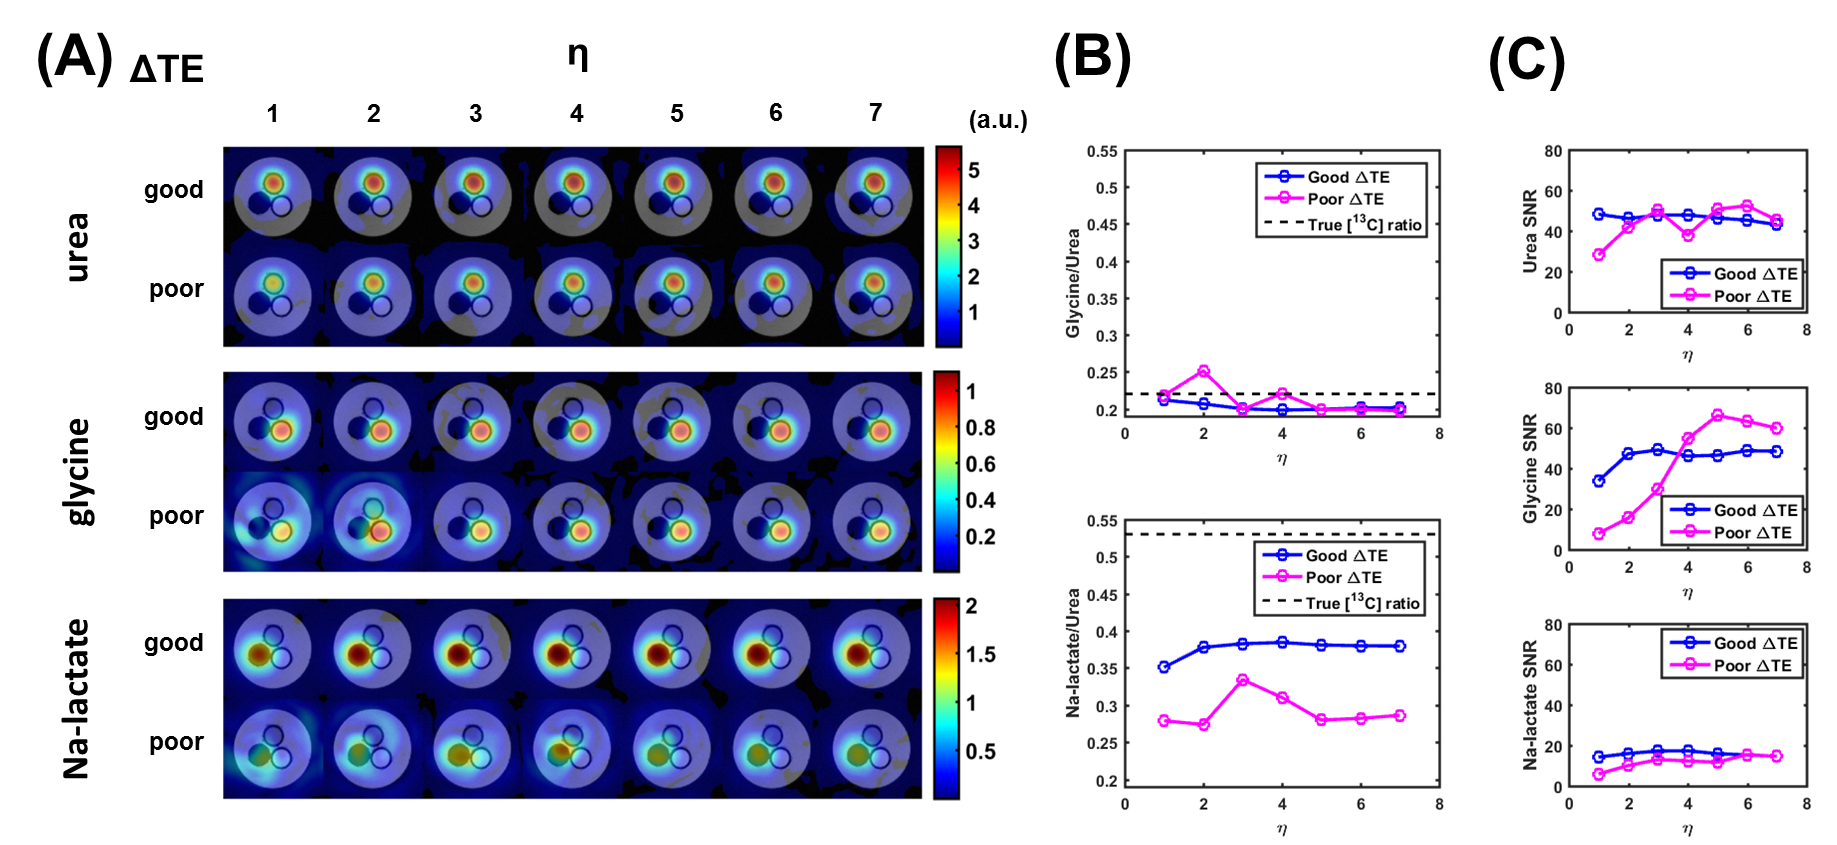
For phantom experiments, microcentrifuge tubes filled with 9.4M 13C-urea (-0.2ppm), 2.1M [1-13C]glycine (9.4ppm), and 5.0M [1-13C]Na-lactate (25.6ppm) doped with 8.5mM, 5.4mM, and 6.3mM of gadobenate dimeglumine (Bracco Diagnostics, Inc., Princeton, NJ), respectively, were placed in a water-filled centrifuge tube and imaged with k-t spiral acquisitions (TR/TE1=55/1ms, NE=4, slice thickness=10mm, FA=90°, bandwidth=250kHz, averages=800) with good (0.576ms) and poor (2.371ms) ΔTEs. 1H spoiled gradient-echo T1-weighted reference images and a field map, to correct for B0 inhomogeneities, were acquired.
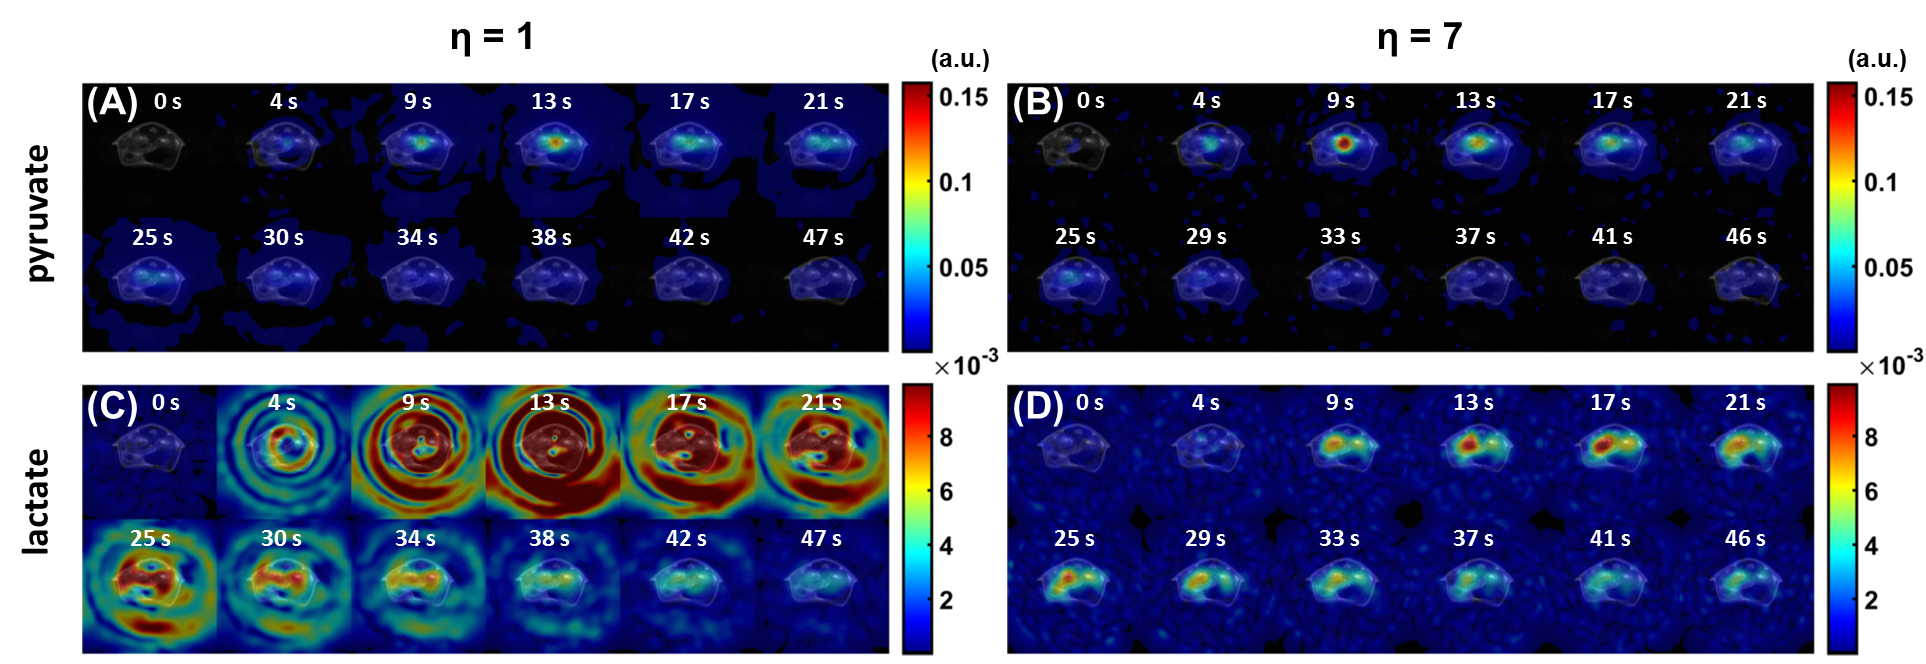
Dynamic, in vivo imaging of renal metabolism, compliant with our Institutional Animal Care and Use Committee, was performed in one ICR mouse in two separate experiments, each with two intravenous injections of hyperpolarized [1-13C]pyruvate. In one experiment, a poor ΔTE (1.630ms) was used. The second experiment (ΔTE=1.871ms) tested a 13C volume-excite/surface-receive coil setup (Doty Scientific, Columbia, SC), making 1H field map estimation difficult due to coil coupling. For all experiments, k-t spiral acquisitions (TR/TE1=140/1ms, NE=6, nominal FOV=48×48mm2, nominal matrix=16×16, slice thickness=5mm, FA=10°, bandwidth=250kHz) were interleaved with slice-selective spectra to identify true metabolite resonances. The first and second injections used η=7 and η=1, respectively. 1H fast spin-echo, T2-weighted images were acquired for anatomical reference.
Results
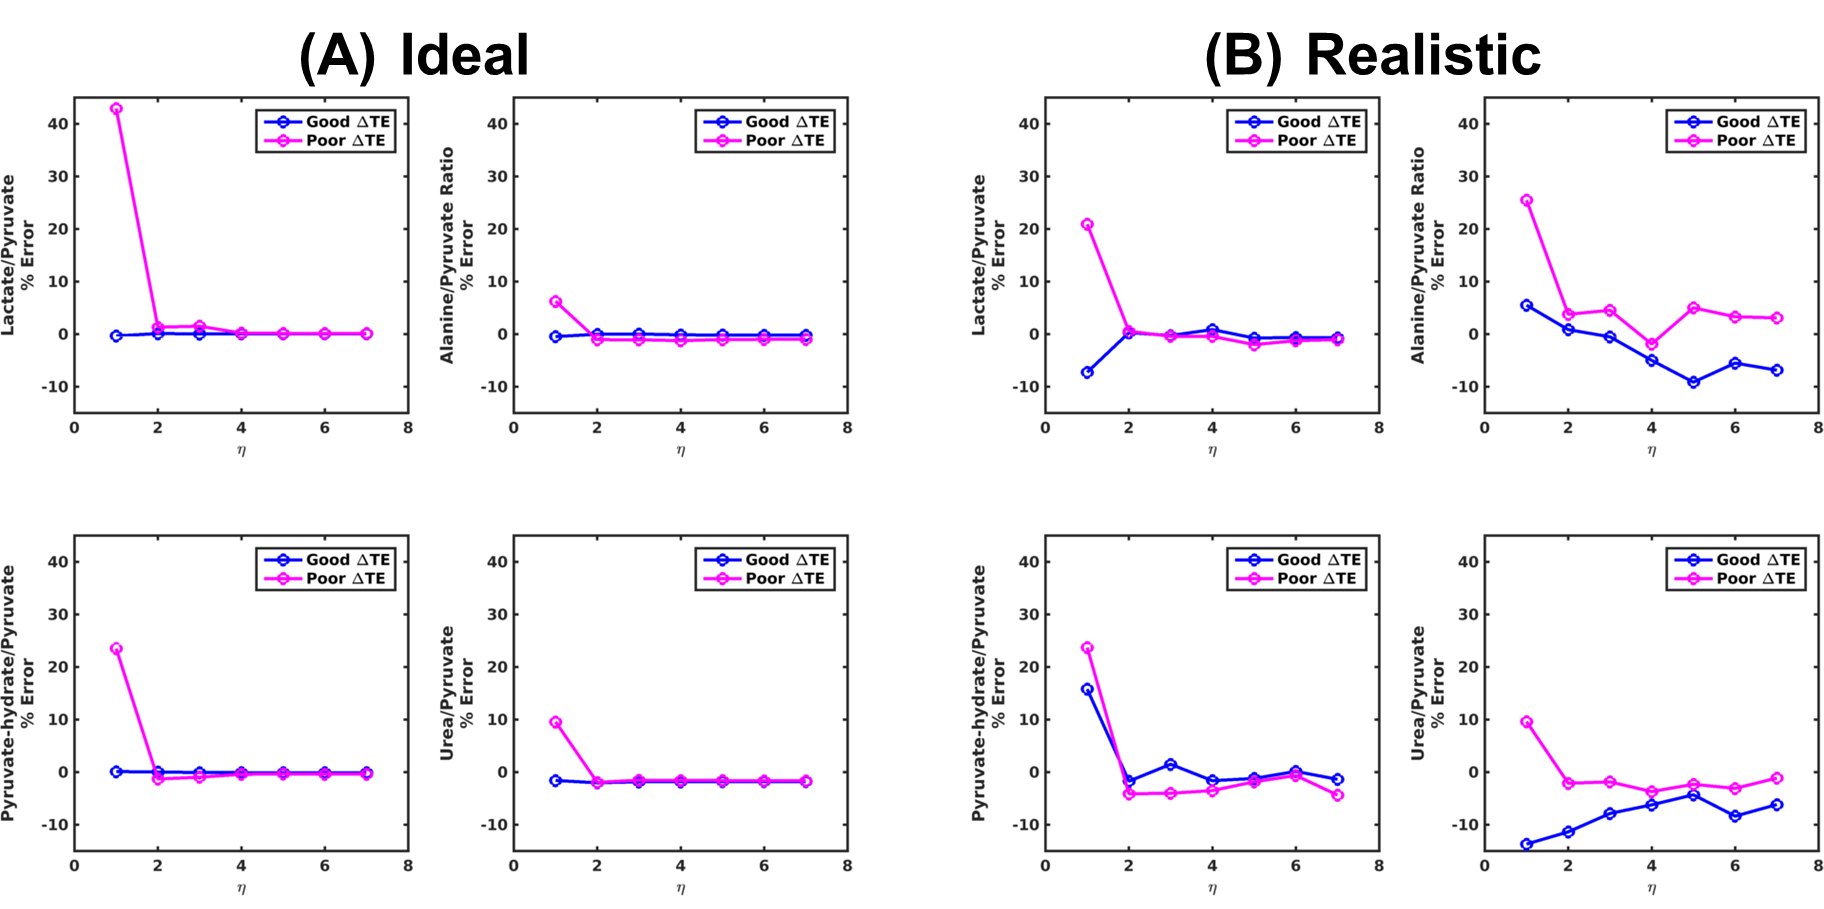
Simulated images (Figure 1) demonstrate reduced spectral leakage for good ΔTE and increasing η for both ideal and realistic cases. Furthermore, the percent error of measured species ratios (Figure 2) trends towards 0% for good ΔTE and increasing η.
Phantom results (Figure 3) also demonstrate reduced spectral leakage for good ΔTE and increasing η. Ratio plots display the glycine/urea ratio stabilizing near the true 13C concentration ratio, 0.22, for η≥3 and η≥5 for good and poor ΔTEs, respectively. The Na-lactate/urea ratio also reaches a plateau for η≥3 and η≥5 for good and poor ΔTEs, respectively, but underestimates the true 13C concentration ratio of 0.53.
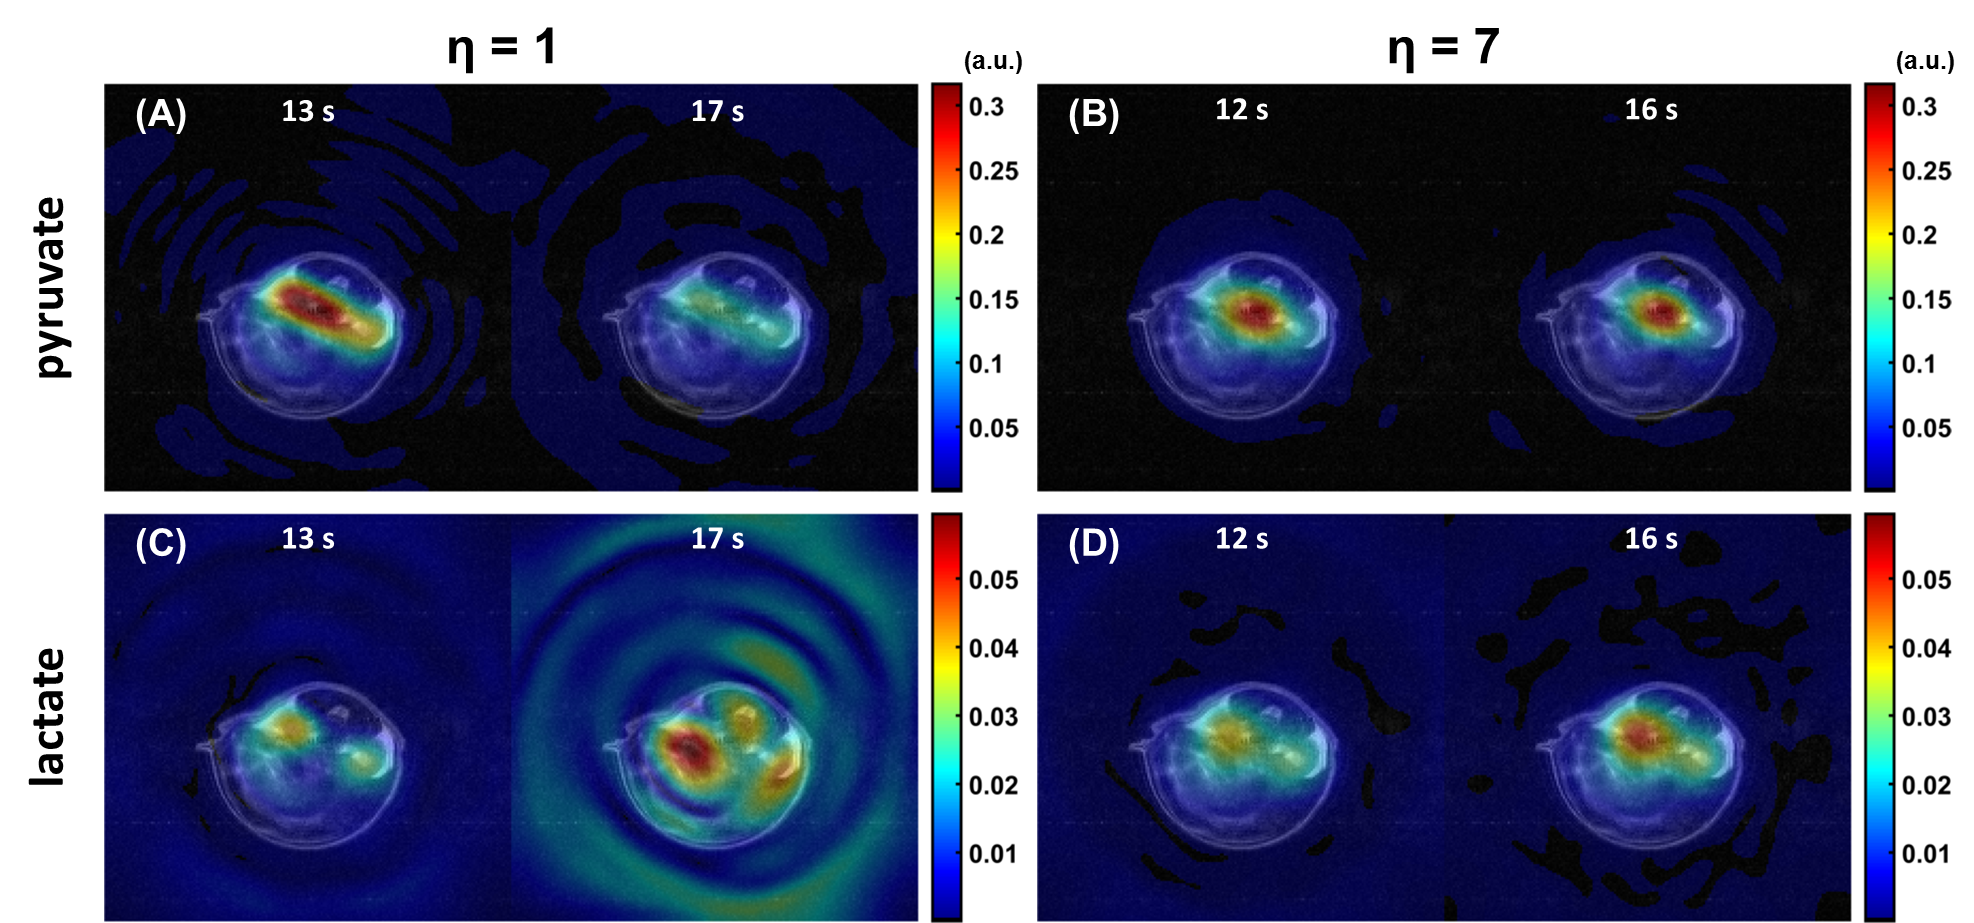
In vivo
results for the poor ΔTE experiment demonstrate significant spectral leakage in
the lactate images for η=1 (Figure 4A) and markedly improved image quality for η=7 (Figure
4B), with the same trend for the volume-excite/surface-receive coil
experiment (Figure 5), although
spectral leakage with η=1 was subtler in this more realistic scenario.
Discussion
Digital simulations, phantom, and in vivo experiments all displayed decreased or comparable spectral leakage for higher η acquisitions compared to the conventional IDEAL-spiral acquisitions (η=1). Simulations indicated that oversampling k-t space, even with a suboptimal ΔTE, reduced the error in measured metabolite ratios, particularly for higher SNR acquisitions. This was corroborated by phantom experiments in which species ratios stabilized near true 13C concentration ratios for higher η values, especially for glycine/urea, even with suboptimal ΔTEs. The larger bias towards underestimation of the Na-lactate/urea ratio was likely due to partial volume effects resulting from blurring.Conclusion
The accuracy of hyperpolarized 13C metabolic imaging and quantification using IDEAL-spiral MRSI in the presence of unexpected resonance shifts can be improved with the use of oversampled k-t spiral acquisitions. This technique also increases the flexibility of ΔTE selection.Acknowledgements
This project received support from an AAPM 2014 Graduate Fellowship, the Department of Medical Physics at the author’s institution, NIH/NIDDK R01 DK092454, and GE Healthcare.References
1. Durst M, Koellisch U, Frank A, et al. Comparison of acquisition schemes for hyperpolarised 13C imaging. NMR Biomed. 2015;28(6):715-725.
2. Reeder S, Brittain J, Grist T, Yen Y. Least-squares chemical shift separation for 13C metabolic imaging. J Magn Reson Imaging. 2007;26(4):1145-1152.
3. Gordon J, Niles D, Fain B, Johnson K. Joint spatial-spectral reconstruction and k-t spirals for accelerated 2D spatial/1D spectral imaging of 13C dynamics. Magn Reson Med. 2014;71(4):1435-1445.
Figures