3561
Slice Profile Induced Errors in Metabolic Quantification of Hyperpolarized Pyruvate.1Imaging Physics, MD Anderson Cancer Center, Houston, TX, United States
Synopsis
Hyperpolarized pyruvate is being explored as a quantitative imaging biomarker of metabolism. Non-ideal slice excitation of hyperpolarized magnetization can result in temporally evolving slice profiles. This work evaluates the impact of slice profile on quantitative analysis of hyperpolarized pyruvate using a perfused Bloch-McConnell simulator. Results indicate that the slice profile can cause significant bias in the measured apparent metabolic exchange constant. Primary sources of bias are
INTRODUCTION
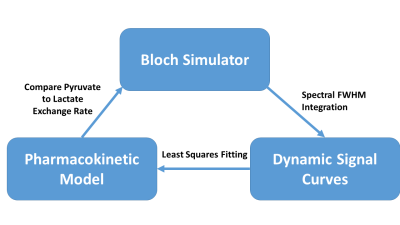
Hyperpolarized pyruvate is being investigated as an imaging biomarker for metabolism, especially in oncology1,2. Slice-selective excitation has been shown to impact quantitative magnetic resonance imaging applications3. Slice profile effects could be compounded for hyperpolarized magnetization due to its inherently transient signal and serial radio frequency excitations that deplete hyperpolarized magnatization4,5. In this work, a perfused Bloch-McConnell simulator6 was used to quantify slice profile effects and the subsequent errors in metabolic rate constant measurement.METHODS
A simulation platform written in MATLAB (MathWorks, Natick, MA) that couples the Bloch-McConnell equations to a pharmacokinetic model7 of tissue perfusion was used6. As a validation, phantom slice profiles were simulated, using a 3 kHz three-lobed sinc pulse for either a single 1H acquisition (30 mm slice, slice gradient Gss = 2.3 mT/m) or dynamic acquisition of hyperpolarized pyruvate (20mm, Gss = 14mT/m) with a flip angle of 20o or 60o and a repetition time of 2 seconds. The density of the numerical phantom along z was linearly modulated to match the slope of the phantom holder and therefore the thickness of water and HP signal in slice profile measurements. Similar slice profiles of water, as well as hyperpolarized 1-13C-pyruvate, were acquired on a 7-T/30-cm Biospec System (Bruker Biospin Corp., Billerica, MA). Measured and simulated slice profiles were overlaid for qualitative comparison.
In order to assess the accuracy of dynamic spectroscopy in vivo, sequences with a range of flip angles and repetition times were simulated assuming a uniform slab of perfused tissue. The resulting noise free spectral peaks were integrated to yield signal curves for pyruvate and lactate. Signal curves were fit with a pharmacokinetic model to determine the apparent conversion rate of HP pyruvate to lactate (kPL) The fitted kPL values were compared to the kPL values used for simulation to quantify error imposed by the simulated pulse sequences.
Results
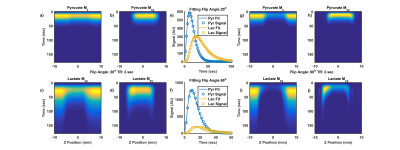
The simulated 1H and hyperpolarized 1-13C-pyruvate slice profile show strong qualitative agreement with the measured slice profile (Figure 1). The slice profiles for the hyperpolarized data shows signal from the slice penumbra dominating at later time points (Figure 1b-g).
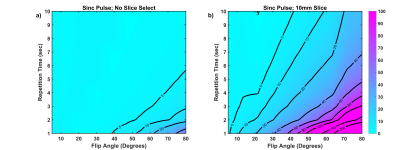
The percent error in measured kPL as a function of flip angle and repetition time is shown in Figure 3 for a non-selective excitation (5kHz sinc pulse, GSS = 0.0 mT/m) and a 10 mm slice (GSS = 4.67 mT/m). Errors in measured kPL from slice-localized measurements are much larger and affect a larger number of parameter combinations as compared to non-selective excitation.
In order to explore the source of errors in measured kPL associated with slice selection, the longitudinal and transverse magnetization for pyruvate and lactate as well as the resulting dynamic signal curves for acquisitions with TR=2s, and 20o or 60o excitations from Figure 3 are shown in Figure 4. Figure 4e and f show a higher detected lactate signal that is not explained by the pharmacokinetic model, leading to overestimation of kPL. There are two sources of this excess lactate signal: the additional signal from the slice penumbra, and an asymmetry in the lactate signal due to chemical shift offsets along the slice direction (Figure 4-j). The offset in the lactate and pyruvate slices results in a portion of the lactate slice originating from a region of tissue where there is no excitation of the pyruvate signal. This slice offset leaves a larger hyperpolarized pyruvate pool to be converted into lactate and increases lactate signal on that side of the slice.
Discussion
These simulation studies suggest that the cumulative effect of serial slice selective excitation and resulting dynamic slice profile can deteriorate kPL accuracy. The slice profile has the greatest impact on kPL accuracy at higher excitation angles and arises from an increase in lactate signal which artificially increases the measured kPL. Artificially elevated lactate signal is primarily due to the signal contribution from the penumbra of the slice at later time points.Conclusion
While this work focused on slice selective spectroscopy, these effects should directly translate into slice selective imaging strategies. Methods have been proposed to account for the slice penumbra effect4,5 but it is still unclear how to best leverage them for metabolic processes. Future work will focus on an analysis of more advanced excitation pulses which could be designed to reduce the slice penumbra and spectral-spatial excitations which could completely eliminate any slice offset but could still have large slice penumbras. Overall these simulation results suggest that dynamic hyperpolarized signal is sensitive to the slice profile and such effects need to be accounted for to ensure reliable metabolic quantification.Acknowledgements
This work was supported in part by the National Cancer Institute of the National Institutes of Health (R01CA2111150), the Cancer Prevention and Research Institute of Texas (RP14002-P5, RP140106, RP170366), and GE Healthcare.
The authors acknowledge the Texas Advanced Computing Center (TACC) at The University of Texas at Austin for providing the Lonestar5 HPC resource that has contributed to the research results reported within this work. URL: http://www.tacc.utexas.edu
References
1 Aggarwal, R., Vigneron, D. B. & Kurhanewicz, J. Hyperpolarized 1-[13C]-Pyruvate Magnetic Resonance Imaging Detects an Early Metabolic Response to Androgen Ablation Therapy in Prostate Cancer. European urology, doi:10.1016/j.eururo.2017.07.022 (2017).
2 Nelson, S. J. et al. Metabolic imaging of patients with prostate cancer using hyperpolarized [1-(1)(3)C]pyruvate. Science translational medicine 5, 198ra108, doi:10.1126/scitranslmed.3006070 (2013).
3 Kay, I. & Henkelman, R. M. Practical implementation and optimization of one-shot T1 imaging. Magnetic resonance in medicine 22, 414-424 (1991).
4 Deppe, M. H., Teh, K., Parra-Robles, J., Lee, K. J. & Wild, J. M. Slice profile effects in 2D slice-selective MRI of hyperpolarized nuclei. Journal of magnetic resonance 202, 180-189, doi:10.1016/j.jmr.2009.11.003 (2010).
5 Gordon, J. W. et al. Mis-estimation and bias of hyperpolarized apparent diffusion coefficient measurements due to slice profile effects. Magnetic resonance in medicine 78, 1087-1092, doi:10.1002/mrm.26482 (2017).
6 Walker, C. M., Chen, Y., Lai, S. Y. & Bankson, J. A. A novel perfused Bloch-McConnell simulator for analyzing the accuracy of dynamic hyperpolarized MRS. Medical physics 43, 854-864, doi:10.1118/1.4939877 (2016).
7 Bankson, J. A. et al. Kinetic Modeling and Constrained Reconstruction of Hyperpolarized [1-13C]-Pyruvate Offers Improved Metabolic Imaging of Tumors. Cancer research 75, 4708-4717, doi:10.1158/0008-5472.CAN-15-0171 (2015).
Figures


