3558
Optimizing signal-to-noise ratio for hyperpolarized carbon-13 magnetic resonance imaging using a hybrid flip angle scheme1Medical Biophysics, Western University, London, ON, Canada, 2Robarts Research Institute, London, ON, Canada, 3Maternal, Fetal & Newborn Health, Children's Health Research Institute, London, ON, Canada
Synopsis
Hyperpolarized 13C imaging can provide useful metabolic information; however, rapid decay of hyperpolarized signal leads to reduced signal-to-noise ratio (SNR) images. We demonstrate an RF excitation scheme that dynamically changes the RF spectral profile and amplitude to achieve flip angles that vary throughout the acquisition independently for each metabolite. This preserves signal during a dynamic imaging experiment maintaining more signal for later time-points than using a constant RF pulse. Increased in vivo SNR at later time points of [1-13C]pyruvate and its metabolites was shown by dynamic imaging experiments in guinea pigs with both constant and variable flip angle schemes.
Introduction
Hyperpolarized magnetic resonance imaging (MRI) of carbon-13 (13C) allows real-time quantitative imaging of key biological molecules like pyruvate and their in vivo metabolic processes. The hyperpolarized state of pyruvate decays in 20-40 seconds in vivo, leading to issues of low spatial resolution and low signal-to-noise ratio (SNR) of images. Variable flip angle (VFA) schemes have been used to boost SNR by applying a different flip angle for each excitation1,2. VFA uses the same flip angle for all metabolites, but this limits optimization to one metabolite.
Hyperpolarized 13C MRI is possible because different metabolites exist at different chemical shifts. In [1-13C]pyruvate MRI the metabolites of pyruvate are usually found in quantities > 5-fold lower than pyruvate at chemical shifts of 190 to 405 Hz relative to pyruvate at 3T. To take advantage of this fact, an approach that used a spectrally selective RF pulse was used to excite the lower abundance metabolites with higher flip angles than the pyruvate pool, but in this case, the amplitude was constant during the experiment3,4.
VFA using spectrally selective pulses could further boost SNR5,6 but is not practical for imaging due to the need for unique RF pulses for each readout. We will address the issue of low SNR and practicalities of implementation for imaging by using a hybrid flip angle (HFA) scheme that varies a spectrally selective RF pulse once per image, rather than once per readout.
Methods
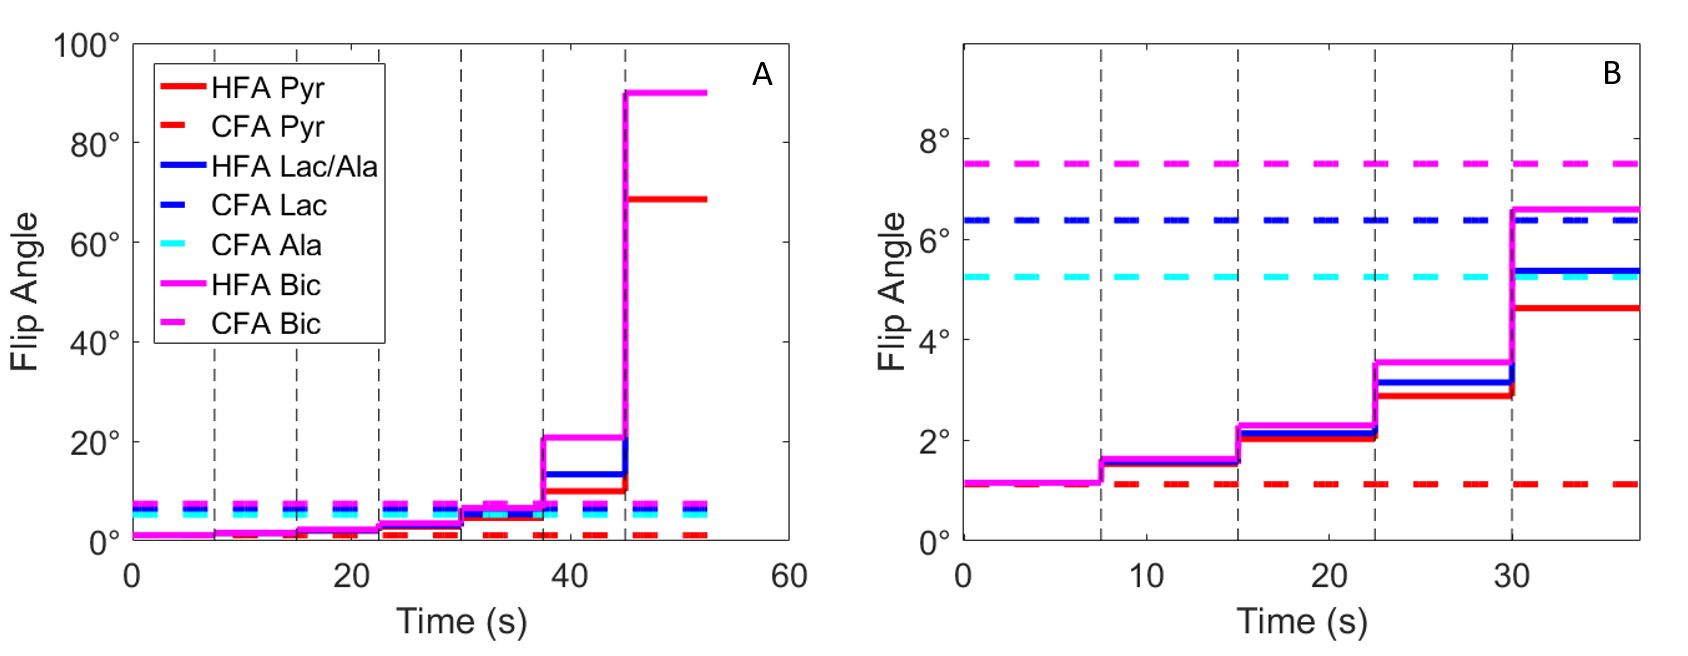
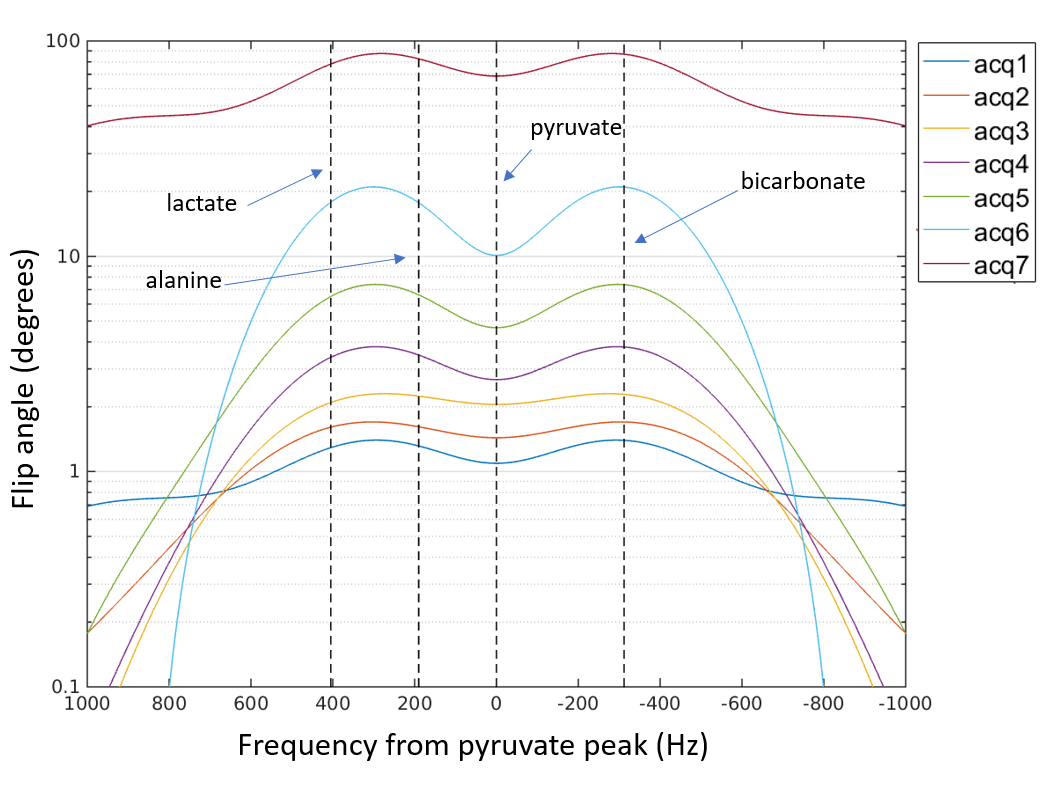
The HFA scheme combines the above approaches to produce a different VFA trajectory for each metabolite by progressively varying both the shape and amplitude of the spectrally selective to optimize the signal of each metabolite during the experiment. The pulse shape and amplitude are updated at the beginning of each time point of a multi-phase acquisition and maintaining those flip angles throughout the acquisition, as displayed in Figure 1. Shown in Figure 2, using spectrally selective RF pulse shapes allows for optimization of the flip angle of each metabolite separately. Bloch simulations were used to determine the optimal flip angles for each metabolite using the HFA scheme. This flip angle strategy was then implemented on a 3T MRI scanner (Discovery MR750, GE Healthcare, Waukesha, WI).
Animal experiments were done on two non-pregnant female adult guinea pigs using a custom built 13C birdcage coil (Morris Instruments, Ottawa, Canada). 3.5 mL of the hyperpolarized 80mM [1-13C]pyruvate was injected into the hind leg over 12 seconds. Image acquisition began 7.5 seconds after start of bolus injection and images were acquired every 7.5 seconds. Each animal was scanned with either the HFA scheme or constant flip angles. Regions of interest (ROIs) were drawn around the kidneys on anatomical images and overlaid on 13C images for each metabolite to measure signal intensity. An ROI was also drawn in a no signal image to obtain a noise value for SNR calculations.
Results
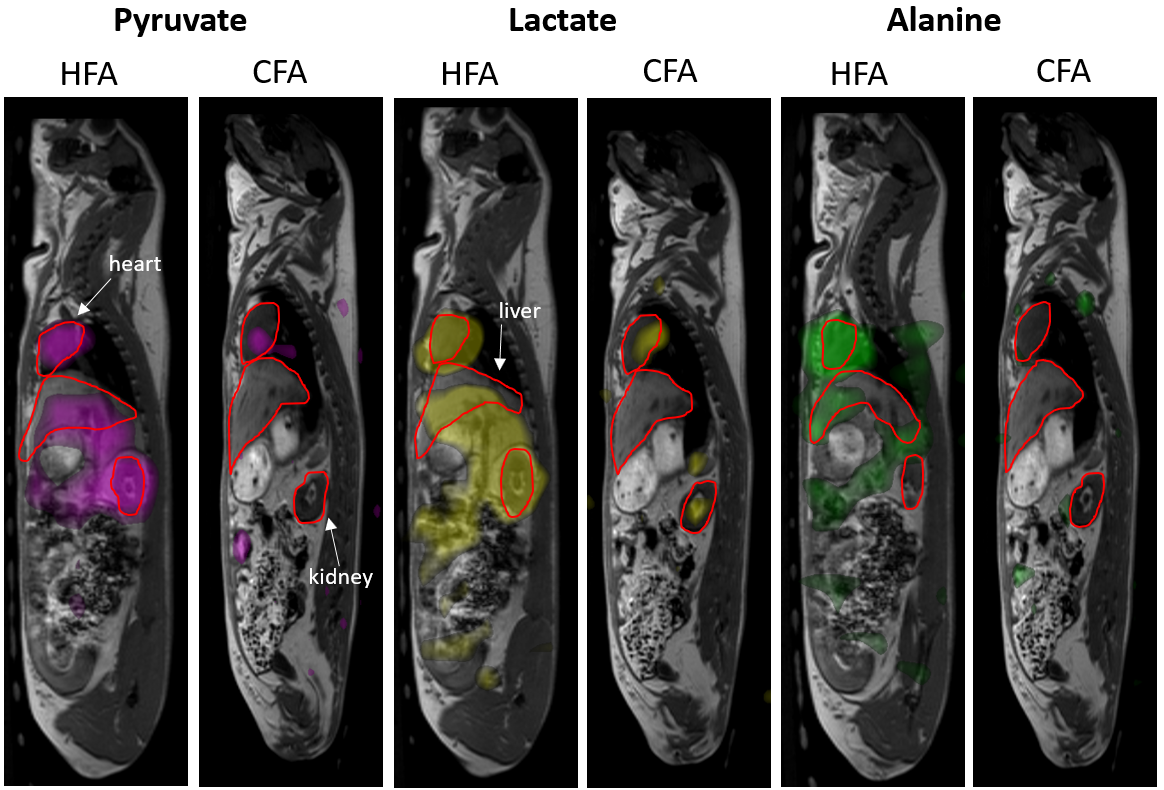
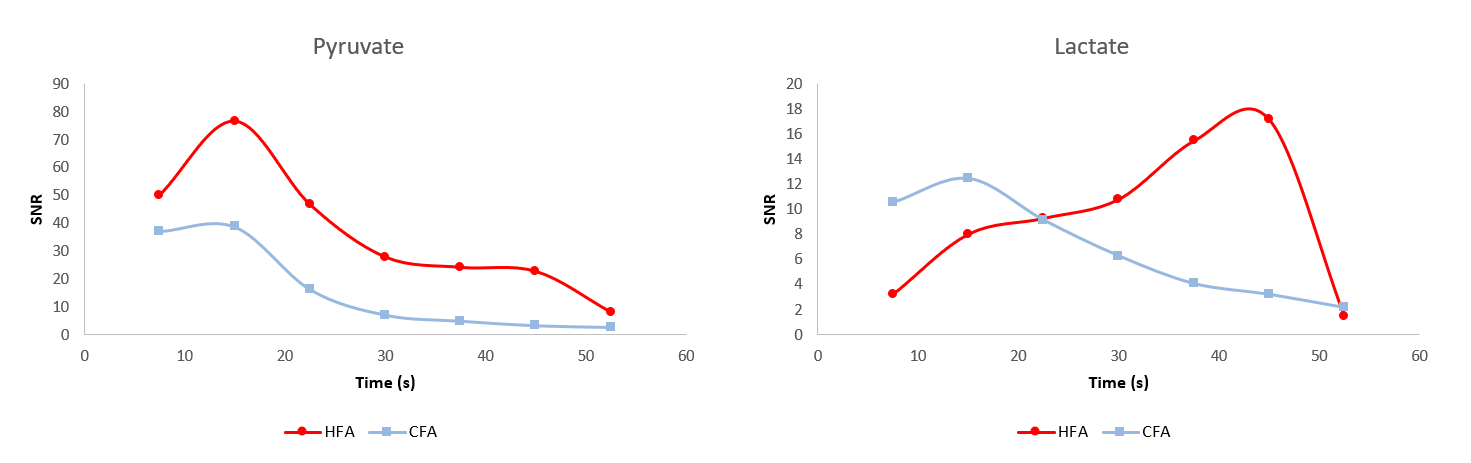
Figures 2 and 3 display the flip angles and scaled spectral RF pulse shapes theoretically determined from Bloch simulations to best boost SNR during the scan. Figure 3 shows an in vivo demonstration of the boost in overall SNR and higher SNR at later time points provided by an HFA acquisition relative to a CFA acquisition. This SNR advantage is quantified in our SNR measurements over each acquisition, shown in Figure 4 using an ROI placed in the left kidney of both animals.Discussion
Our in vivo data suggests that the spectrally selective HFA pulses performed better during acquisition compared to the CFA scheme. Flip angles were calculated such that the hyperpolarized signal for each metabolite would be preserved sufficiently to acquire images with SNR >5 at time points >30s range. Figure 3 demonstrates how higher SNR makes it easier to visualize and quantify results from 13C imaging. This is critical for observing metabolism in organs since the steady-state metabolism occurs in the later stages of dynamic imaging, after the pyruvate bolus has arrived from the heart and begun to metabolize.Conclusion
New techniques in applying flip angles are useful to conserve hyperpolarized signal and improve image quality through higher SNR. This can improve image acquisition for a variety of hyperpolarized imaging applications. Future work includes further optimizing the flip angles for metabolites near the beginning of the acquisition such that the SNR increased for HFA over all acquisitions, such that we observe with pyruvate in Figure 4A. This pulse sequence will be implemented into our ongoing metabolic imaging studies.Acknowledgements
Funded by National Institutes of Health, U01 HD087181-01.References
- Santyr et al. (2008). Magn Reson Med 59:1304–1310.
- Zhao et al. (1996) J Magn Reson Ser B 113:179–183.
- Friesen‐Waldner et al. (2016) J Magn Reson Imag 43:750-755.
- Wiens et al. (2015) Magn Reson Med 74:1682-1689.
- Xing et al. (2013) J Magn Reson 234:75-81.
- Lau et al. (2010) Magn Reson Med 64: 1323–1331.
Figures