3555
Developing a Regional Bolus Tracking and Real-time B1 Calibration Method for Hyperpolarized 13C MRI1University of California at San Francisco, San Francisco, CA, United States, 2HeartVista, Los Altos, CA, United States
Synopsis
Acquisition timing and B1 calibration are two key factors that affect the quality and accuracy of hyperpolarized 13C MRI. This project developed a new approach using regional bolus tracking to trigger Bloch-Siegert B1 mapping and real-time regional RF power compensation, followed by dynamic imaging of hyperpolarized 13C metabolites. The feasibility of applying the proposed framework for in vivo hyperpolarized 13C imaging was demonstrated on healthy rats and tumor-bearing mice on a clinical 3T scanner. This proposed method was designed to improve efficient use of hyperpolarized magnetization as well as the accuracy and robustness of hyperpolarized 13C MRI.
Purpose
Hyperpolarized 13C MRI has been used to non-invasively study real-time metabolic processes in vivo.1 Acquisition timing and B1 calibration are important factors that affect the quality and accuracy of hyperpolarized 13C MRI in the aspects of efficient use of hyperpolarized magnetization, consistent quantification of metabolic activity2 and variable flip angle schemes.3-5 This work presents a method that uses regional bolus tracking to trigger Bloch-Siegert B1 mapping and real-time regional RF power compensation, followed by dynamic imaging of hyperpolarized 13C metabolites in vivo. Real-time center frequency calibration based on the slab frequency spectrum acquired upon the bolus arrival was also added. The proposed method was designed to improve efficient use of hyperpolarized signal and robustness of hyperpolarized 13C imaging, thereby reducing quantification errors of metabolic parameters.Methods
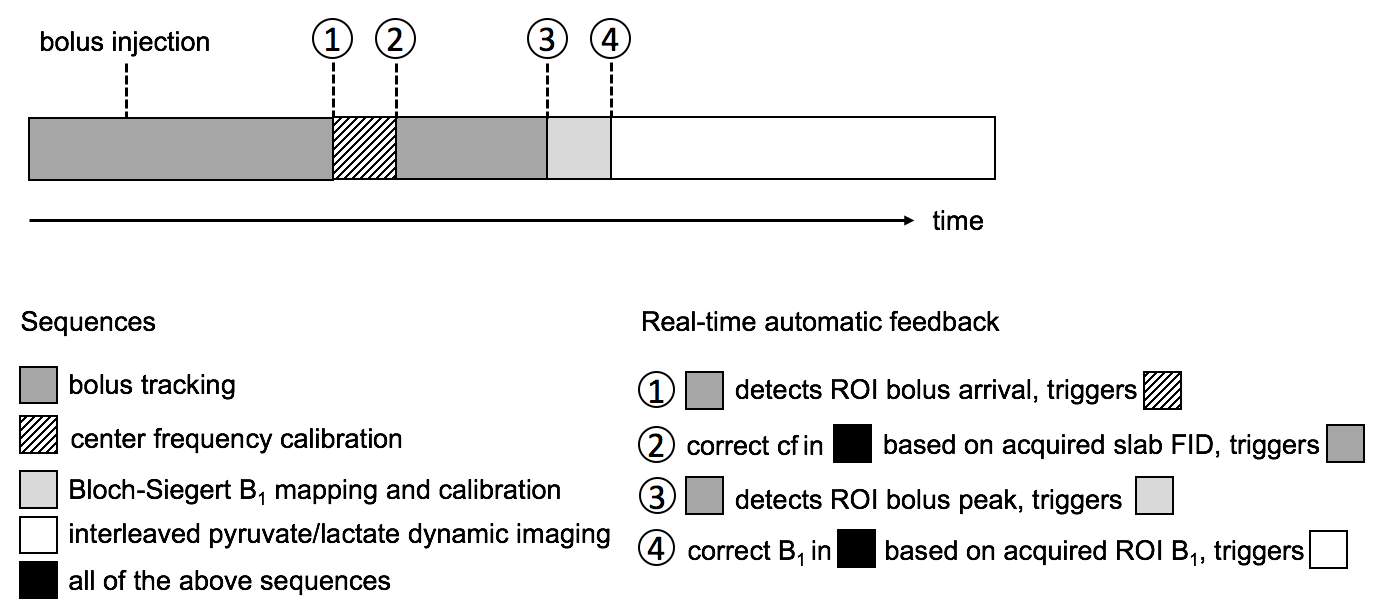
The overview of the proposed bolus tracking and real-time B1 calibration scheme was illustrated in Figure 1. The proposed method was implemented on a RTHawk system (HeartVista, CA), which allows real-time image reconstruction and scan parameter update.
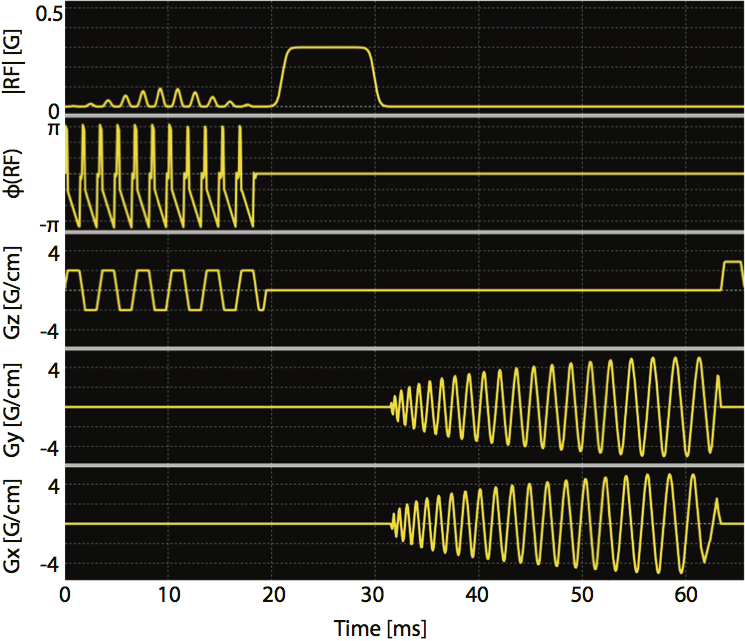
The bolus tracking sequence for this study used a single-band spectral-spatial excitation pulse and a single-shot spiral readout (Figure 2). The algorithm for the bolus peak detection was implemented in a prior work.2 A major improvement in this study was that the bolus signal was selected from an ROI on the tracking image rather than from the entire excitation slab.
The Bloch-Siegert B1 mapping sequence6-8 (Figure 2) shared the similar excitation and readout as bolus tracking, whereas an off-resonance Fermi pulse (TRF=12ms, ωRF =±4.5kHz, KBS=6.76rad/G2 ) was inserted in between. A pair of sequences with two opposite Fermi pulse frequency offsets was used to minimize the influence of B0 off-resonance frequency.8 The acquired B1 maps were masked based on the magnitude of phase maps. The ratio of the desired B1 to the measured ROI B1 was passed to all sequences as a scaling factor to correct transmit power in real time.
All experiments were performed on a clinical GE 3T scanner. The feasibility of applying the proposed method for in vivo hyperpolarized 13C imaging were explored on normal Sprague-Dawley rats and transgenic adenocarcinoma of mouse prostate (TRAMP) mice with 13C/1H birdcage coils. Rat experiments were also performed on a 13C surface transceiver coil. Some experiments were performed with real-time center frequency calibration. DNP experiments used a HyperSense polarizer and 80mM [1-13C]pyruvate was injected. Other experiment parameters are specified in the figures.
Results
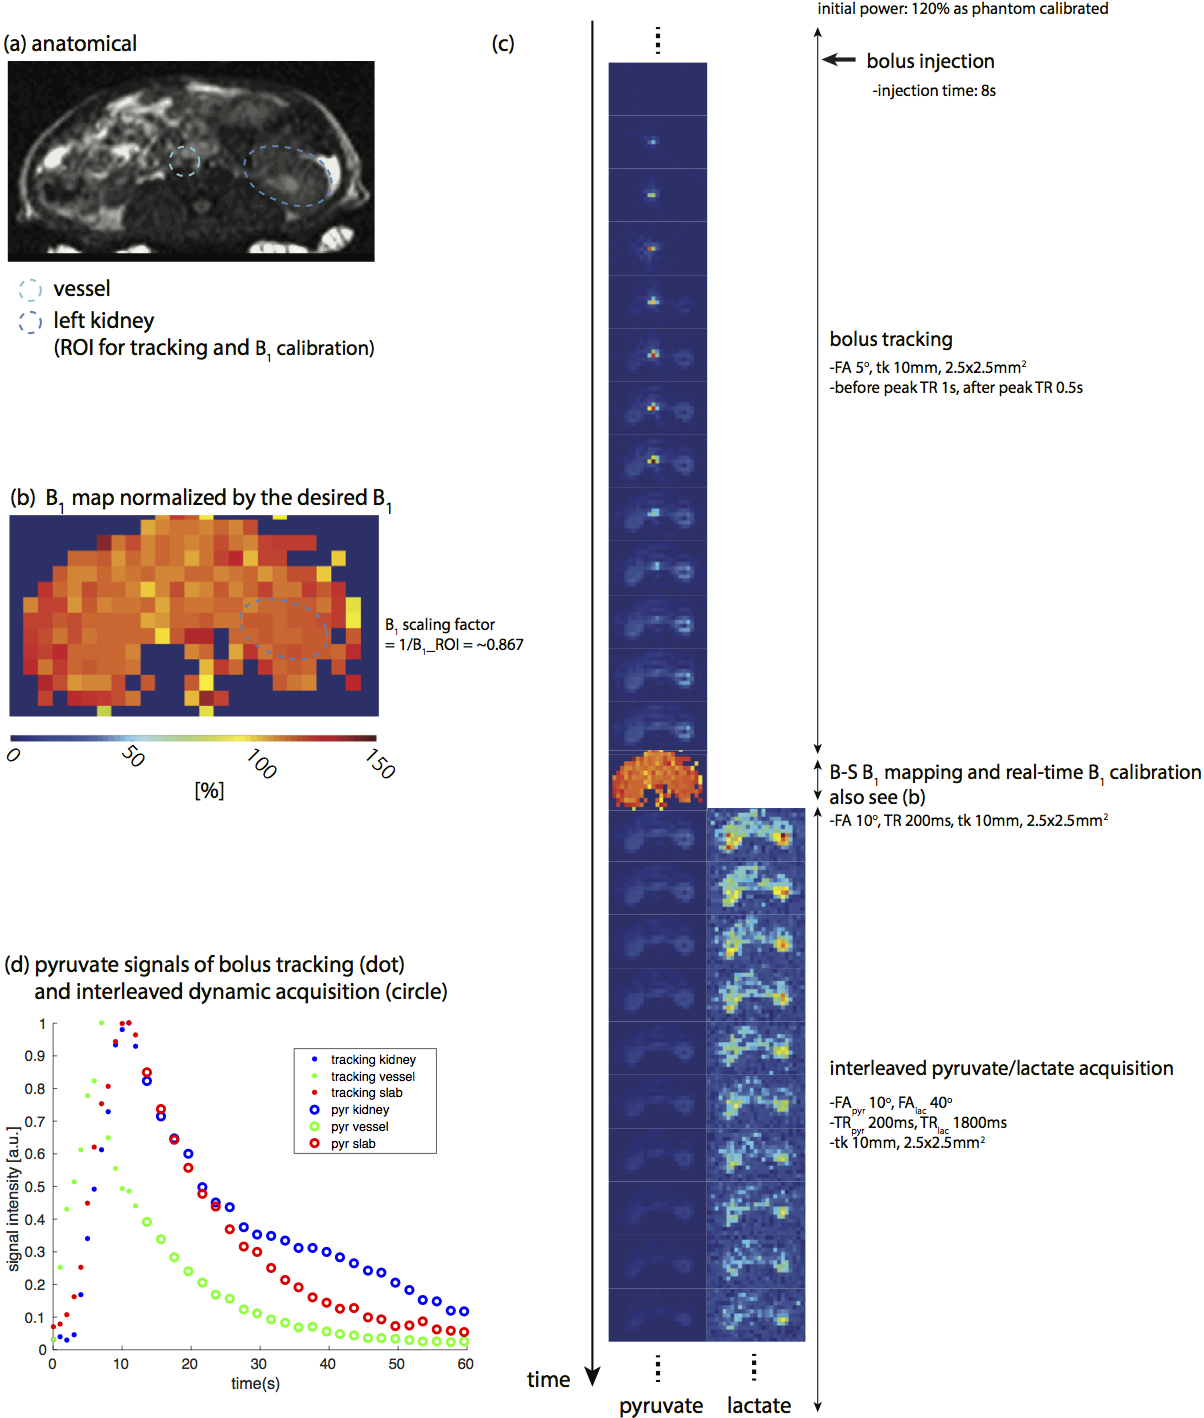
Figure 3 shows the results of imaging rat kidneys with the birdcage coil. The homogenous B1 map was measured as expected for this coil. The B1 scaling factor was ~0.87, matching up with the initial transmit power which was purposely set to 120% of the power calibrated on thermal 13C phantom. Normalized pyruvate signal curves (Figure 3d) were consistent with pyruvate images (Figure 3c), demonstrating that ROI (left kidney) bolus peak was successfully detected, and acquisition timing would be different if tracking ROI was on the major vessels.
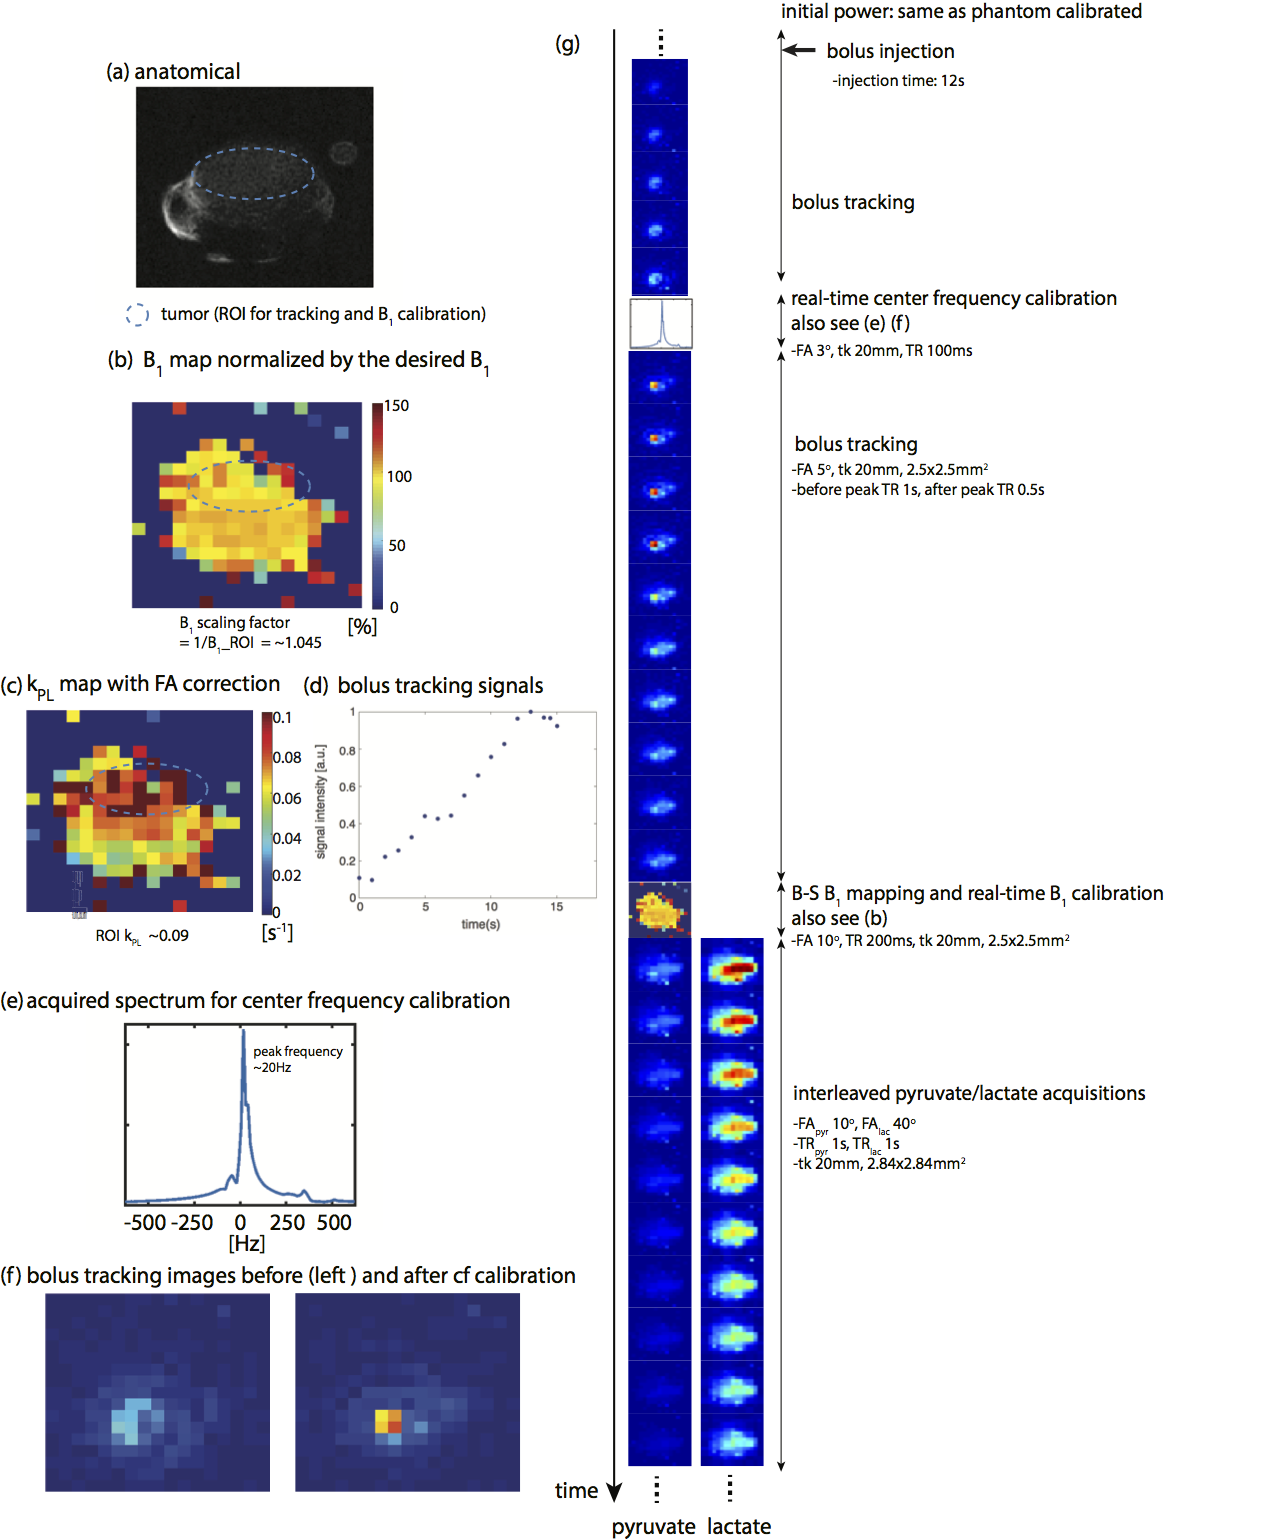
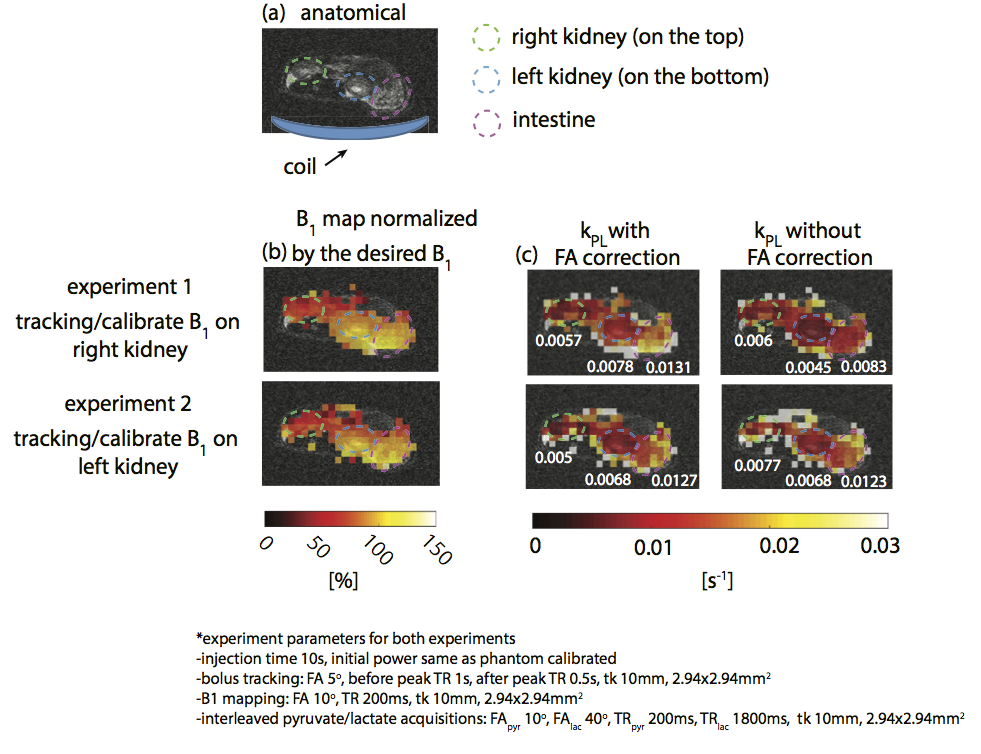
Figure 4 shows the results of imaging TRAMP mouse with the birdcage coil. The successful detection of the ROI bolus peak is demonstrated in Figure 4d. The B1 scaling factor was ~1.05, indicating a 5% difference from the power calibrated on a thermal 13C phantom. Figure 4f shows that real-time center frequency calibration reduced the off-resonance artifacts in real-time reconstructed images. The tumor kPL (Figure 4c) was estimated using pyruvate and lactate signals to be 0.09s−1, agreeing with literature values.9 Figure 5 shows the results of imaging rat kidneys with a surface transceiver coil. Two experiments were performed with the same parameters but with the different tracking/calibrating ROIs, one on the right and the other on the left kidney. The left kidney was closer to the coil. B1 maps (Figure 5b) acquired in two experiments are consistent and the left kidney experienced a 40% higher B1 than the right kidney did, which agreed with the B1 scaling factors, 1.49 and 1.07 for the tracking left and right kidney, respectively. Figure 5c demonstrates that using acquired B1 maps to correct the flip angle results in more consistent kPL maps between two experiments compared to the kPL estimation without flip angle correction. The links of experiment videos are provided in each figure to demonstrate real-time actions during the experiments.
Conclusion
This work demonstrated an approach that integrates automatic acquisition timing using the regional bolus signal with Bloch-Siegert B1 mapping and real-time regional RF power compensation as well as dynamic hyperpolarized 13C imaging. Future work will focus on applying this approach in human studies for improving efficiency, accuracy, and robustness.Acknowledgements
The authors thank Xucheng Zhu, Zihan Zhu, Yiran Chen and Peng Cao for their help on the project. This work was supported by grants R01EB017449, R01EB016741, R01CA183071, and P41EB013598 from the National Institutes of Health.References
1. Golman K, Zandt R, Thaning M. Real-time metabolic imaging. Proc Natl Acad Sci U S A 2006; 103:11270–5.
2. Durst M, Koellisch U, Gringeri C, Janich Ma, Rancan G, Frank A, Wiesinger F, Menzel MI, Haase A, Schulte RF. Bolus tracking for improved metabolic imaging of hyper- polarised compounds. Journal of Magnetic Resonance 2014; 243:40–46.
3. Xing Y, Reed GD, Pauly JM, Kerr AB, Larson PEZ. Optimal variable flip angle schemes for dynamic acquisition of exchanging hyperpolarized substrates. Journal of Magnetic Resonance 2013; 234:75–81.
4. S. I. Machingal, Sampling strategies for hyperpolarized carbon-13 imaging, M.S. thesis dissertation, Univ. California, San Francisco, 2014.
5. Maidens J, Member S, Gordon JW, Arcak M, Larson PEZ. Optimizing flip angles for metabolic rate estimation in hyperpolarized carbon-13 MRI. IEEE TRANSACTIONS ON MEDICAL IMAGING 2016; 35:2403–2412.
6. Lau AZ, Chen AP, Cunningham CH. Integrated Bloch-Siegert B 1 mapping and multislice imaging of hyperpolarized 13c pyruvate and bicarbonate in the heart. Magnetic Resonance in Medicine 2012; 67:62–71.
7. Schulte RF, Sacolick L, Deppe MH, Janich Ma, Schwaiger M, Wild JM, Wiesinger F. Transmit gain calibration for nonproton MR using the Bloch-Siegert shift. NMR in Biomedicine 2011; 24:1068–1072.
8. Sacolick LI, Wiesinger F, Hancu I, Vogel MW. B1 mapping by Bloch-Siegert shift. Magnetic Resonance in Medicine 2010; 63:1315–1322.
9. Chen HY, Larson PE, Bok RA, von Morze C, Sriram R, DelosSantos R, DelosSantos J, Gordon JW, Bahrami N, Ferrone M, Kurhanewicz J, Vigneron DB. Assessing prostate cancer aggressiveness with hyperpolarized dual-agent 3d dynamic imaging of metabolism and perfusion. Cancer Research 2017; 77:3207–3216.
Figures