3554
Spiral-In/Out Multi Spin-Echo Acquisitions for Increased SNR in Dynamic Hyperpolarized 13C MRI1University of California at San Francisco, San Francisco, CA, United States
Synopsis
The long T2 relaxation time of hyperpolarized 13C-labeled metabolites at 3T allows efficient use of hyperpolarized signal by multi spin-echo readouts. This work presents a novel 13C sequence that uses spiral in/out acquisitions at multiple spin echoes, each formed by a single adiabatic pulse to improve signal-to-noise ratio(SNR) in dynamic hyperpolarized 13C MRI. The proposed sequence was tested in vivo on a normal rat on a clinical 3T scanner. Results show that the proposed method has improved SNR for 15 dynamic acquisitions over 30s.
Purpose
Hyperpolarized 13C MRI has been used to non-invasively measure dynamic changes of metabolites in vivo1. The rapid and irreversible decay of hyperpolarized magnetization requires specialized pulse sequence designs. The long T2 relaxation time of 13C-labeled metabolite at clinical field strengths (e.g. lactate 0.5s~2s at 3T2-4) allows for efficient use of hyperpolarized signal by sampling data at repetitively refocused spin echoes4-5. This work presents a novel 13C sequence that uses spiral in/out multiple spin-echo readouts to improve signal-to-noise ratio (SNR) in dynamic hyperpolarized 13C MRI.Methods
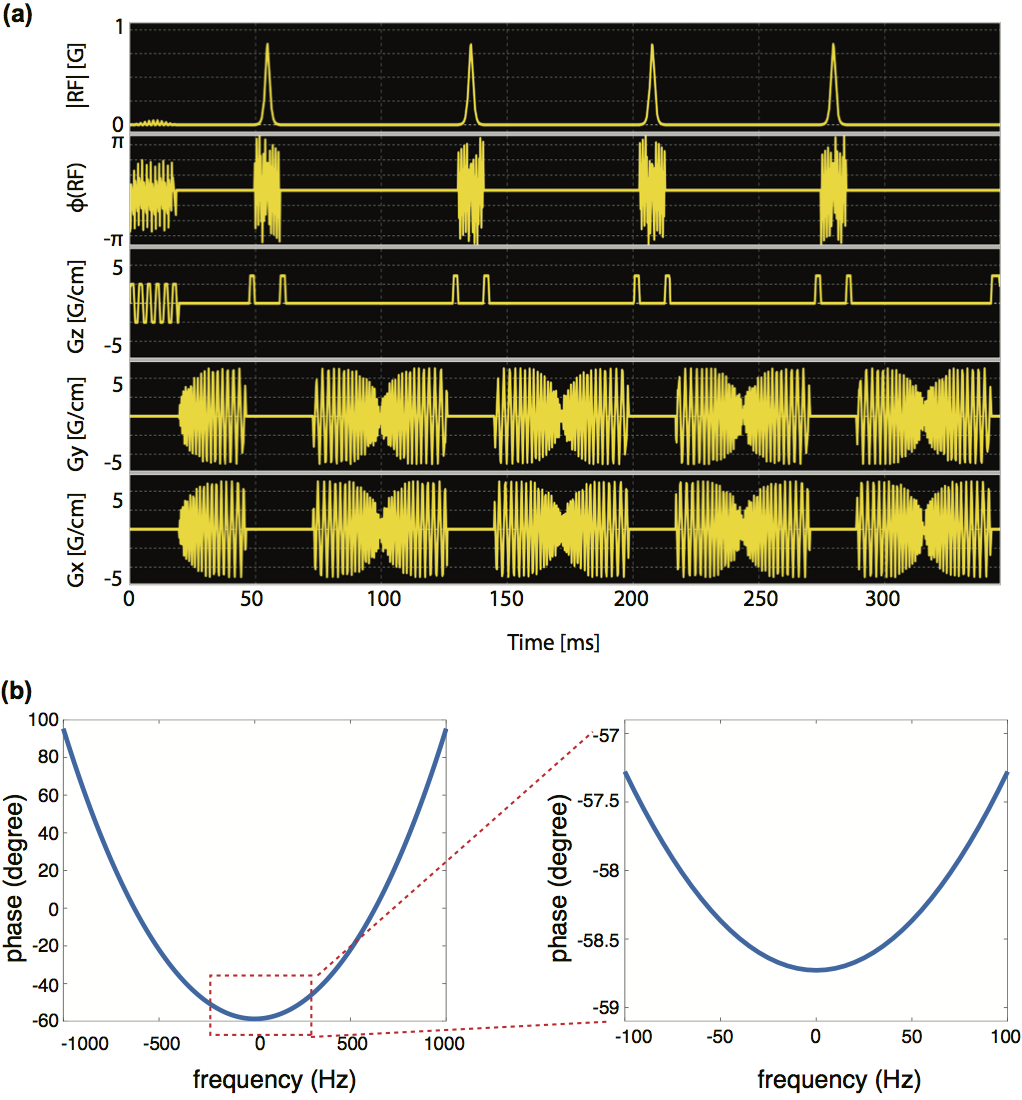
The proposed sequence (Figure 1a) consists of a single-band spectral-spatial (SPSP) pulse, a spiral readout and spiral in/out readouts at each spin echo formed by a single adiabatic pulse.
The SPSP RF pulse6 was designed to excite [1-13C]pyruvate and [1-13C] alternatively at 3T, with a passband full-width half-maximum of 120Hz and a stop band of 600Hz. In some prior spin-echo 13C sequences, adiabatic pulse has been used as refocusing pulse4,7-8 for its robustness to B1 and B0 inhomogeneity. Adiabatic pulses were always played out in pairs to refocus the quadratic phase9. In this work, we notice that the quadratic phase is almost constant (max angle difference ~1.5o) over a short range ($$$\pm$$$100Hz) of frequencies (Figure 1b), and thus spin echo could be achieved even with a single adiabatic pulse if a SPSP excitation is used. Enabling spin echo acquisition with a single adiabatic pulse is expected to increase the SNR efficiency. The design of adiabatic pulses was the same as the prior work7, with a refocused bandwidth of ~2.8 kHz and minimal unwanted excitation (<0.5%) over a range of ~1kHz. At each spin echo, spiral-in and out readouts were used to improve the TR efficiency. The spiral-in gradient waveform was obtained by time reversing and negating the spiral-out waveform10. Four spin echoes with nominal TE of 80ms, 152ms, 244ms and 316ms were used in this study.
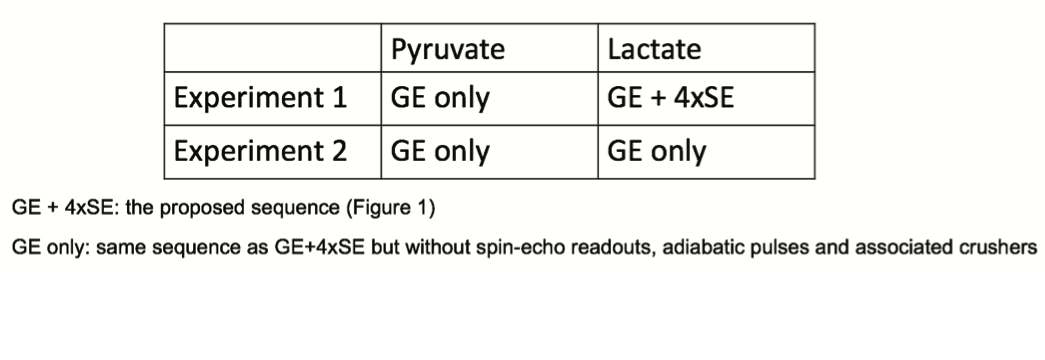
The proposed sequence for dynamic hyperpolarized 13C imaging was tested in vivo using a normal Sprague-Dawley rat with 13C/1H birdcage coils on a clinical GE 3T scanner. DNP experiments used a HyperSense polarizer and 80mM [1-13C] pyruvate was injected. Two experiments were performed on the axial plane of rat kidneys using the acquisition scheme shown in Figure 2. The first experiment acquired lactate signals using the proposed sequence (Figure 1a) and the second experiment only used a gradient-echo spiral readout without any adiabatic pulses or spin echo readouts. For both experiments, pyruvate signals were acquired using a single gradient-echo spiral readout. Other experiment parameters included injection time 10s, FApyr 10o, FAlac 40o, TRpyr 2s, TRlac 2s, slice thickness 2cm, FOV 8x8cm2, in-plane resolution 2.5x2.5mm2, and 30 time frames. Bolus tracking and real-time B1 calibration using pyruvate signals of left kidney were added to trigger pyruvate/lactate dynamic acquisition upon the bolus peak and obtain accurate B1 in real time. Details of bolus tracking and real-time B1 calibration are described in another abstract submitted to this conference.
Results
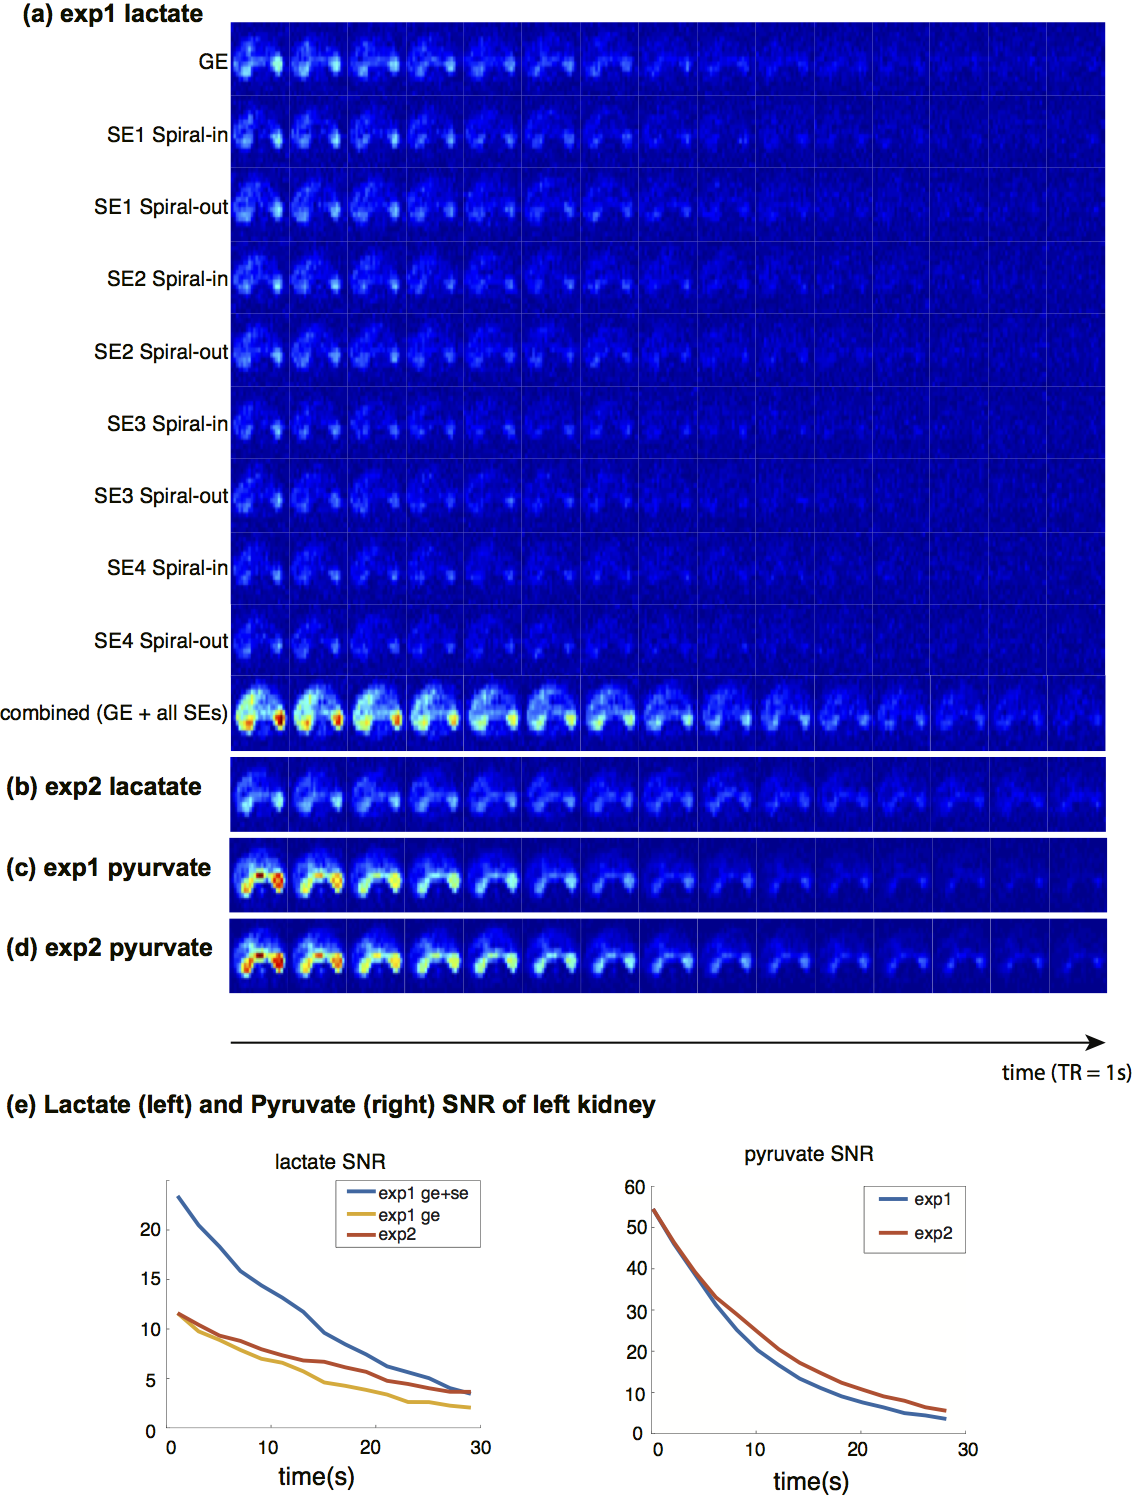
Figure 3 shows the results of two [1-13C]pyruvate studies on rat kidneys using the acquisition scheme shown in Figure 2. The displayed images are acquired magnitude images normalized by its noise standard deviation. Images of experiment 2 were also rescaled to compensate for any polarization differences by equalizing the peak SNR of left kidney to that in experiment 1. As shown in Figure 3a, reasonable amount of SNR (~50% as gradient echo) were left even at the fourth spin echo (nominal TE 316ms). Combined lactate images (Figure 3a-b, Figure 3e) were found to achieve higher SNR compared to GE-only images, with an improvement as much as 2x at a single time frame. The GE+4xSE combination had greater SNR than GE for 30s (15 acquisitions with a 2s temporal resolution).
A faster apparent decay rate was found in the pyruvate and lactate GE signals (Figure 3e) in experiment 1. This could be possibly attributed to polarization saturation by adiabatic pulses at the coil boundary where the adiabatic condition is not met. Even with this potentially partial saturation of magnetization at the coil boundaries, the proposed SE method was still advantageous for imaging downstream metabolites (e.g. lactate) of pyruvate because it provides greater SNR.
Conclusion
This work demonstrates an approach that incorporates multi spin-echo acquisitions with spiral in/out trajectories into dynamic hyperpolarized 13C MRI. The proposed method was found to achieve higher SNR over 15 dynamic acquisitions with a 2s temporal resolution. Future work will focus on optimized flip angle schemes, improved adiabatic refocusing pulses and expanding the number of spin echoes for further SNR improvement.Acknowledgements
This work was supported by grants R01EB017449, R01EB016741, R01CA183071, and P41EB013598 from the National Institutes of Health.References
1. Golman K, Zandt R, Thaning M. Real-time metabolic imaging. Proc Natl Acad Sci U S A 2006; 103:11270–5.
2. Yena Y, Roux P, Mayerm D, et al. T2 relaxation times of 13C metabolites in a rat hepatocellular carcinoma model measured in vivo using 13C-MRS of hyperpolarized [1-13C]pyruvate. NMR Biomed. 2010; 23: 414–423.
3. Reed GD, von Morze C, Verkman A, et al. Imaging Renal Urea Handling in Rats at Millimeter Resolution using Hyperpolarized Magnetic Resonance Relaxometry. Tomography. 2016; 2(2):125-135.
4. Milshteyn E, von Morze C, Reed GD, et al. Development of high resolution 3D hyperpolarized carbon-13 MR molecular imaging techniques. Magn Reson Imaging. 2017; 38:152-162.
5. Wang J, Wright A, Hu D, et al. Single Shot Three-Dimensional Pulse Sequence for Hyperpolarized 13C MRI. Magn Reson Med. 2017; 77:740–752 .
6. Gordon JW, Vigneron D, Larson PE. Development of a symmetric echo planar imaging framework for clinical translation of rapid dynamic hyperpolarized 13 C imaging. Magn Reson Med. 2017; 77(2):826-832.
7. Cunningham CH, Chen AP, Albers MJ, et al. Double spin-echo sequence for rapid spectroscopic imaging of hyperpolarized 13C. J Magn Reson. 2007; 187(2):357-62.
8. Larson PE, Bok R, Kerr AB, et al. Investigation of tumor hyperpolarized [1-13C]-pyruvate dynamics using time-resolved multiband RF excitation echo-planar MRSI. Magn Reson Med. 2010; 63(3):582-91.
9. Conolly S, Nishimura D, Macovski A, A selective adiabatic spin-echo pulse. J Magn Reson. 1989; 83: 324–334.
10. Glover G and Law C. Spiral-In/Out BOLD fMRI for Increased SNR and Reduced Susceptibility Artifacts. Magn Reson Med. 2001; 46:515–522.
11. Nelson SJ, Kurhanewicz J, Vigneron DB, et al. Metabolic imaging of patients with prostate cancer using hyperpolarized [1-¹³C]pyruvate. Sci Transl Med. 2013; 5(198):198ra108
Figures