3553
A Late-Stage Deuteration Method for T1 Prolongation and Enhanced In Vivo Signal to Noise Ratio of Hyperpolarized 13C Substrates1Radiology and Biomedical Imaging, University of California San Francisco, San Francisco, CA, United States
Synopsis
One of the fundamental limitations of hyperpolarized 13C technology is the effective lifetime of the signal, which decays in keeping with the spin-lattice relaxation constant T1. We have developed a robust late stage deuteration methodology which is broadly applicable to amino and alpha hydroxyl acids, including commonly used probes such as alanine and lactate. This methodology enables significant T1 prolongation, yielding an effective doubling of in vivo signal to noise ratio at relevant imaging time-points. We tested [1-13C, 2-2H]alanine prepared via this method both in vitro and in vivo. This broadly applicable methodology may facilitate implementation and translation of hyperpolarized 13C MRI probes.
Introduction
One
of the critical limitations of hyperpolarized 13C technology is the
effective lifetime of the hyperpolarized signal, limited by the spin lattice
relaxation time T1. Replacement of protons with deuterium in close
proximity to the 13C nucleus of interest causes an increase in T1.1
Herein, we refine a late stage isotopic labeling method2,3 which
allows deuterium labeling of 13C substrates with attached O or N
atoms. This enables significant T1 prolongation on the labeled
substrates, leading to a greater than doubling of the effective signal to noise
ratio when applied to in vivo imaging
experiments.
Methods
One step deuterium labeling reaction: Experiments were performed on 7 commercial 13C-labeled substrates in D2O, in the presence of RuC (40 wt %), under H2, overnight, at 80 °C (Figure 1).3 We checked enantiopurity of the deuterated products by chiral HPLC and measured isotopic enrichments by 1H and 13C NMR.
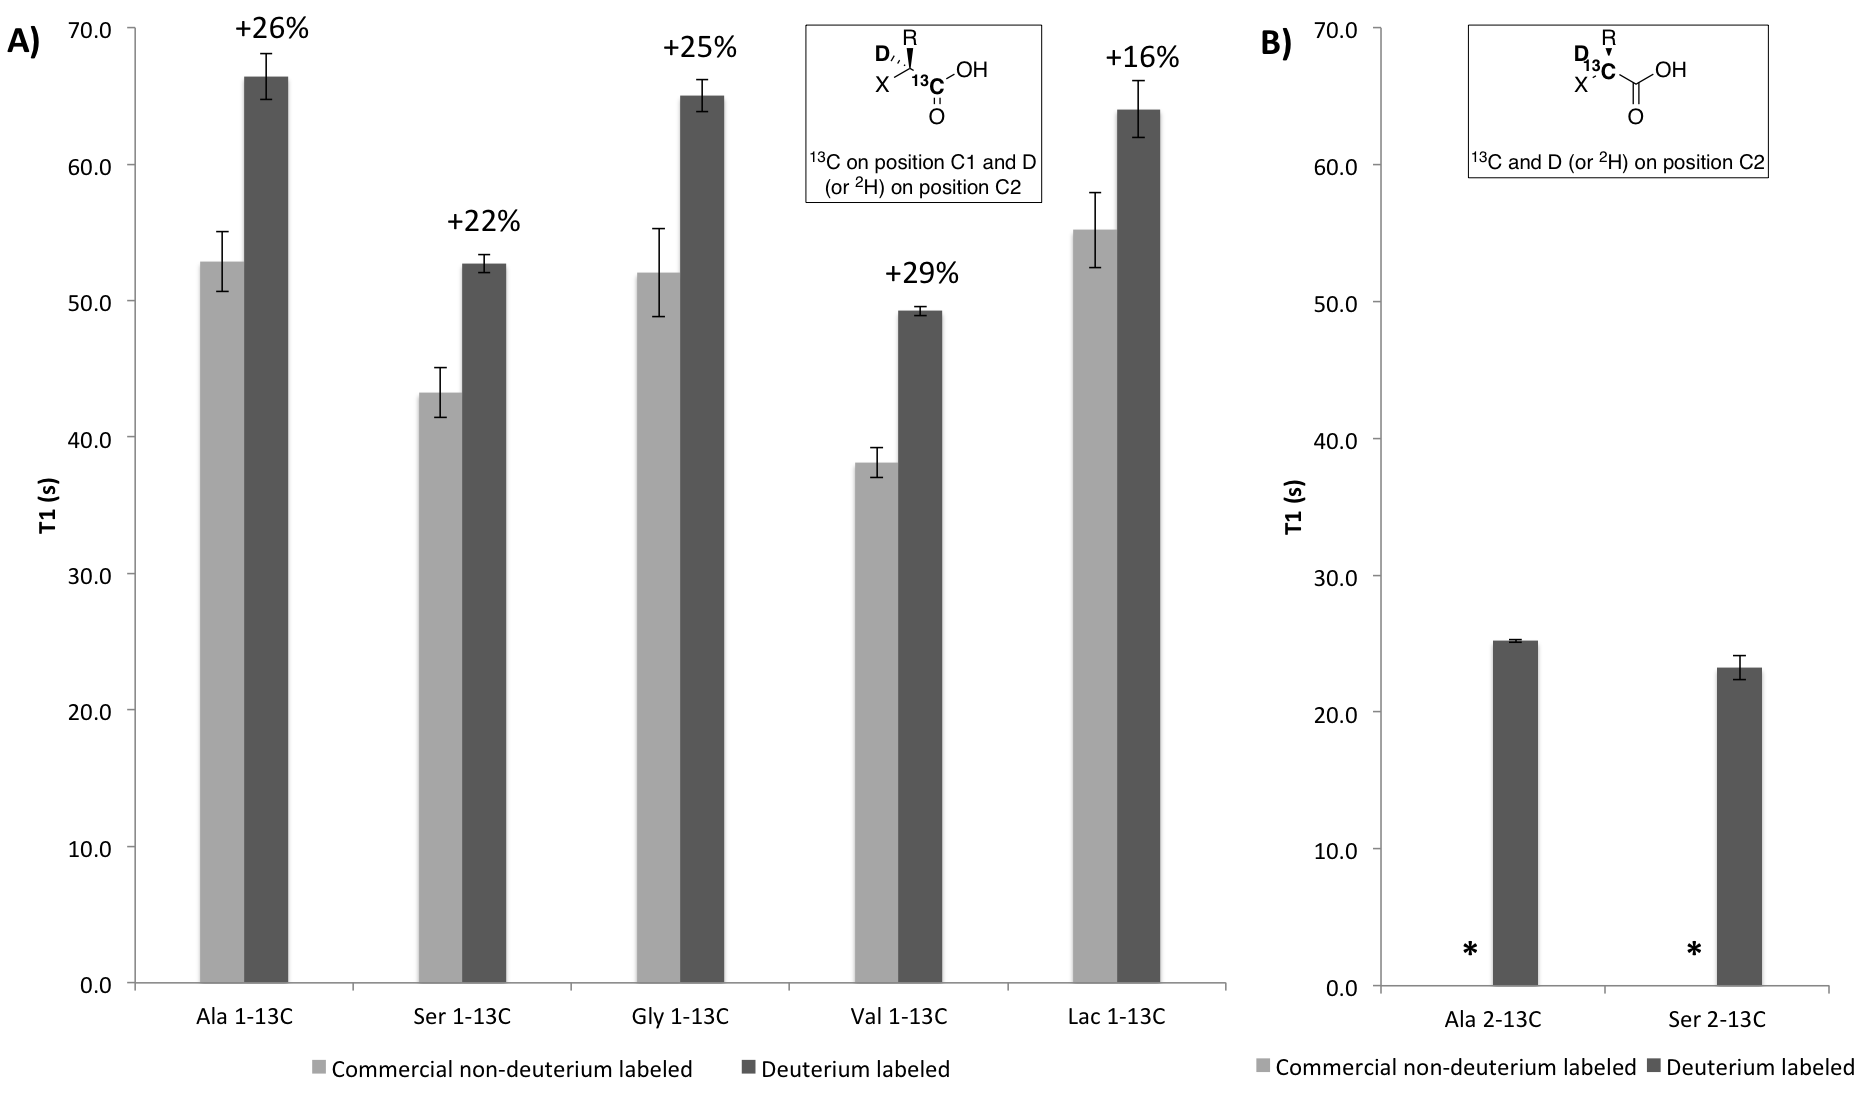
T1 measurements in solution: Solutions of 3 to 5 M amino-acids with 1.2 equivalents NaOH and 20 mM free radical (OX063) were prepared4,5 for hyperpolarization using DNP (Hypersense, Oxford Instruments). T1 measurements were performed on a 3T preclinical MR scanner (Bruker), with a dual-tuned 1H/broadband coil, using 30 hard 5° pulses and a TR of 3000 ms (Figure 2).
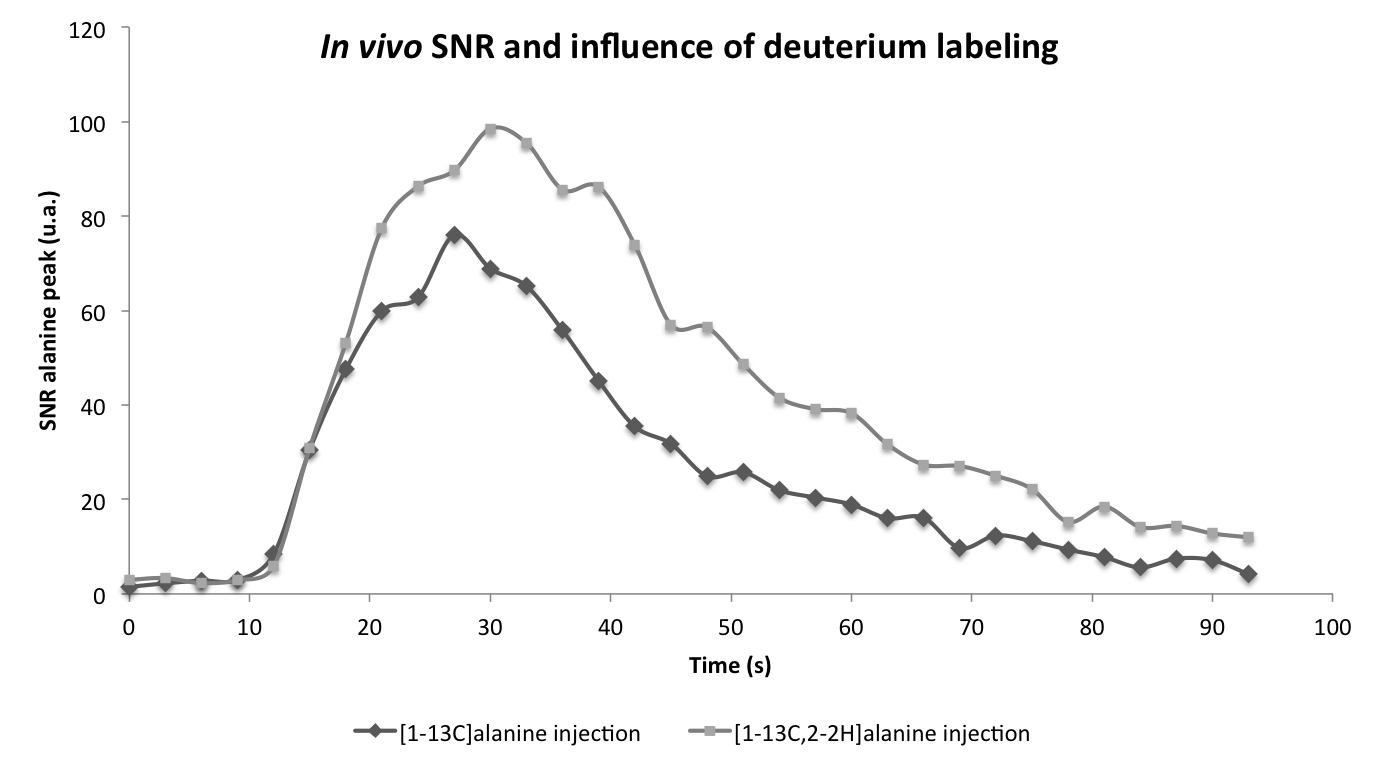
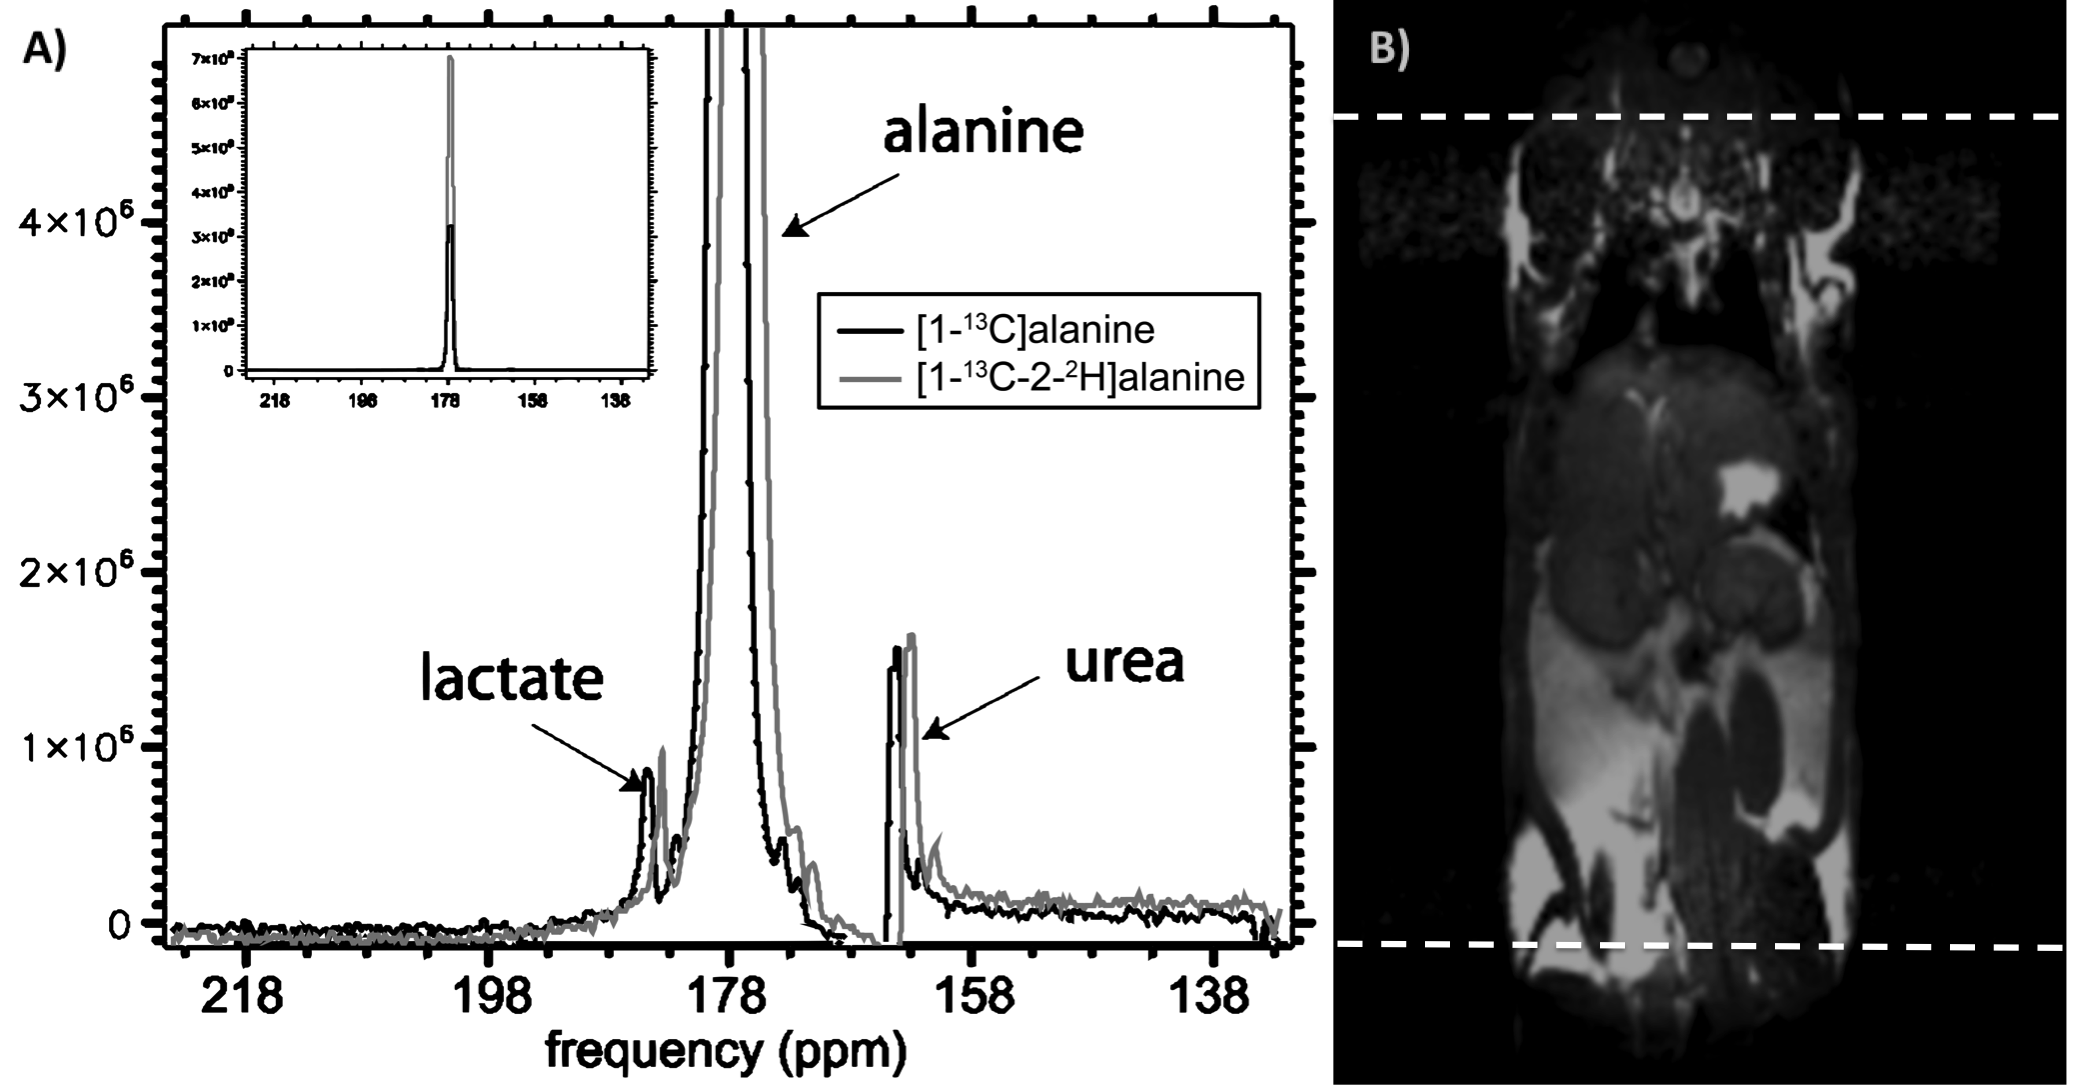
Animal experiments: MR measurements were performed on a preclinical 3T scanner (Bruker) for the mouse study (Figure 3) and on a clinical 3T GE Sigma PET/MR scanner (GE Healthcare) for the rat study (Figure 5). Solutions of 80 mM hyperpolarized [1-13C]alanine or [1-13C,2-2H]alanine were injected intravenously immediately followed by dynamic acquisition of 13C MRS spectra.
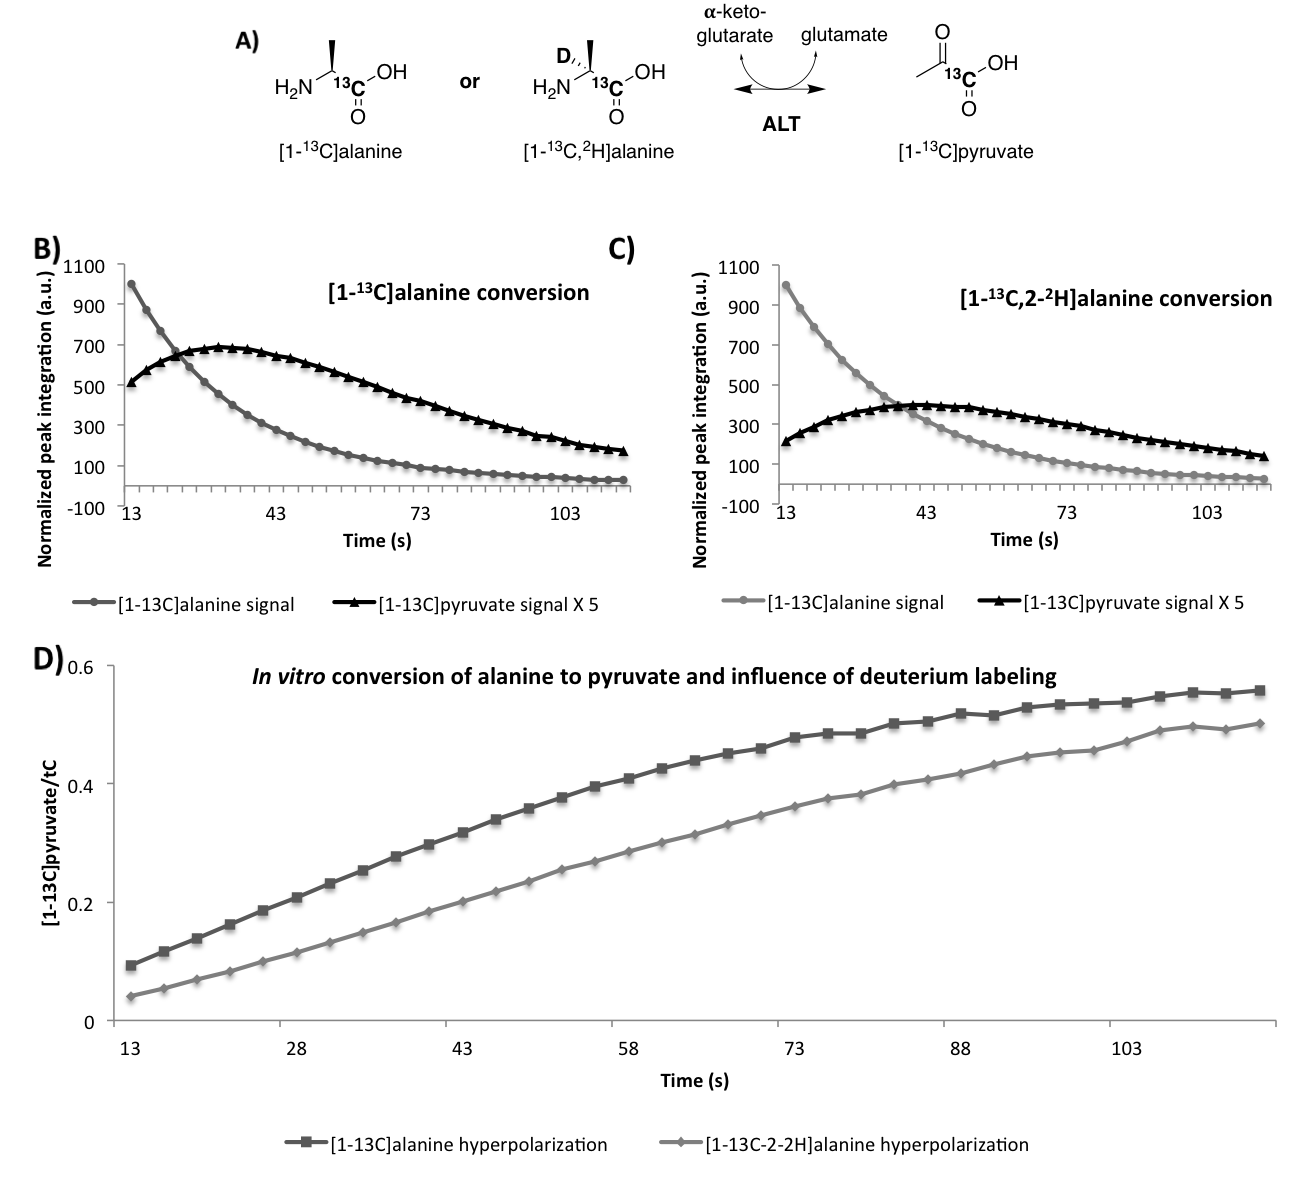
Enzyme experiment: 500μL of the HP solution containing [1-13C] or [1-13C-2-2H]alanine were transferred in an NMR tube containing 50U ALT and observed on a 500MHz NMR spectrometer (Bruker) (Figure 4).6
Results
We found that the one step deuteration methodology was applicable to a variety of amino and alpha-hydroxy acids with chemical yields greater than 50% and isotopic enrichments greater than 89% at the C2 position (Figure 1). Deuterium substitution at the C2 position yielded modest improvements of the T1 with 13C at the C1 position, and much larger increases with 13C at the C2 position (Figure 2). As expected based on the in vitro results (Figure 4), we found a significant increase in the in vivo T1 of [1-13C, 2-2H]alanine from 32 to 42 s at 3T (Figure 3). Importantly, this increase in T1 led to a greater than doubling of signal to noise ratio at later time points for [1-13C-2-2H]alanine (11.9) when compared to [1-13C]alanine (4.2).
We found that conversion of alanine to pyruvate by ALT was delayed (Figure 4) with the maximum pyruvate signal reached at a later time point (40s) following HP [1-13C, 2-2H]alanine mixing compared to HP [1-13C]alanine (31s). Nonlocalized spectra in a rat model detected a [1-13C]lactate peak following intravenous tail injection of HP [1-13C]alanine and [1-13C,2-2H]alanine (Figure 5), which was reduced in the latter case, consistent with the apparent reduction of conversion to pyruvate in the in vitro purified enzyme experiment (Figure 4).
Discussion
We achieved selective deuterium labeling of 7 potential MRI 13C-probes. For all the 5 substrates with 13C-labeling on the C1-position, significant increase of their T1 was observed at 3T with deuterium labeling. Remarkably, in the case of [2-13C]alanine and [2-13C]serine, deuterium labeling led to a greater than four fold increase in T1 and enabled their polarization, dissolution and detection at 3T. We evaluated one of our substrates, [1-13C,2-2H]alanine, in an in vitro enzyme assay with ALT and in an in vivo experiment in a rat model. We found a slight reduction in the rate of production of pyruvate in vitro and a similar slight reduction in the production of lactate in the rat model. The significance of these findings is uncertain, but may relate to a kinetic isotope effect, as has been previously reported for transaminase family enzymes.6Conclusion
We have developed an efficient, inexpensive, and broadly applicable method for deuterium labelling of hyperpolarized 13C substrates. Incorporation of deuterium in these substrates led to a significant T1 prolongation, ranging from 16-29% at a position adjacent to the 13C nucleus. Moreover, when applied to directly attached 13C nuclei, this led to a greater than 4 fold increase in T1 and enabled polarization of the resulting substrates. Most importantly, when applied to in vivo imaging, [1-13C,2-2H]alanine demonstrated a greater than doubling of effective signal to noise ratio.Acknowledgements
The authors wish to thank all members of the Flavell, Wilson and Kurhanewicz Labs.
Grant: Prostate Cancer Research Program / Early Investigator Research Award – Postdoctoral PC161000.
References
1. D. M. Wilson et al. Chem Soc Rev., 2014, 43, 1627
2. H. Sajiki et al. Synlett, 2012, 23, 959
3. H. Sajiki et al. Adv. Synth. Catal., 2008, 350, 2215
4. D. B. Vigneron et al. Magnetic Resonance Imaging, 2011, 29, 1035
5. J. M. Park et al. Magnetic Resonance in Medicine, 2017, 7, 1741
6. H. L. Segal et al. Journal of Biological Chemistry, 1962, 6, 1914
Figures