3551
Highly Accelerated 3D Chemical-Shift Magnetic Resonance Imaging Using 4D Compressed Sensing1Advanced Imaging Research Center, UT Southwestern Medical Center, Dallas, TX, United States
Synopsis
Compressed Sensing method using 4D operators and functions
to treat the entire 4D data as unity can perform high reduction rate of
acceleration and preserve excellent data fidelity. This work demonstrated its
effectiveness on 3D chemical-shift-imaging with reduction rate R=16 or 6.25% sampling
ratio and up to R=32 or 3.125% sampling ratio. The method has been
implemented onto MRI scanner for real-time sparse 3D CSI acquisition. The excellent
data fidelity are demonstrated with 3D CSI images of phantom and in-vivo
hyperpolarized [1-13C]pyruvate and its production metabolites.
INTRODUCTION:
Chemical shift imaging (CSI) is considered one of
cornerstones of clinical imaging and pre-clinic metabolic research. However, CSI
requires one RF excitation for each phase encoding so a typical N=16 3D-CSI
requires 4096 repetition times (TRs) and excitations to complete. This large number
of excitations is impractical when imaging non-re-generable hyperpolarized nuclei.
In this work, we extended our previous work in compressed sensing of 2D CSI1
to 3D CSI with all operators in 4D format. This approach resulted in excellent data fidelity for high reduction sparsely
acquired 3D CSI.
METHODS:
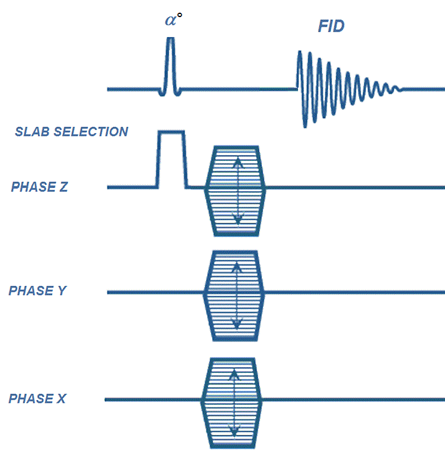
A representing 3D chemical-shift-imaging RF pulse sequence is shown in Figure 1. Within the selected slab, phase encoding are applied in all three directions following by the acquisition of a free-induced-decay (FID) signal. A 3D sparse pattern (Reduction factor=16) is shown in Figure 2a. Conventional norm function and non-linear conjugated gradient optimization for the compressed sensing was. The 4D data and all operators are maintained in 4D format and the optimization was performed once for each 4D data set:
$$argmin {‖F_u m-k‖_2+λ_1 ‖ψm‖_1+λ_2 ‖TV(m)‖_1}$$
where k is sparsely acquired k-space data, m desired image, Fu Fourier transform then under-sampling operator, wavelet operator, total variation and regulation weight. The 4D wavelet transform of the data is symbolically represented in Figure 2b. To validate the method, a phantom containing 4 cylindrical chambers filled with 4 different 13C labeled chemicals was used. The 4 chambers have diameter from 10mm to 15mm for easy identification of chemicals in each chamber: [1-13C]lactate, [1-13C]alanine, [1-13C]formate and 13C-bicarbonate. The 3D CSI of the phantom is performed on a clinic 3T MRI scanner (GE, Waukesha, WI) in full 100% (R=1). The data were randomly removed to yield different under-sampling sparse data sets corresponding to R=2, 3, 5, 8, 10, 12, 16, 20, 25, and 32. The quality of the images reconstructed with CS were quantified by normalized root of mean square error (nRMSE) and the structural similarity index (SSIM)2,3:
$$nRMSE=√((∑_{i=1}^n|x_i-y_i |^2 )/(n*(max(y_i )-min(y_i )))) $$
$$SSIM(x,y) =((2μ_x μ_y+C_1)(2σ_xy+C_2))/((μ_x^2+μ_y^2+C_1)(σ_x^2+σ_y^2+C_2))$$
where x&y are CS reconstructed and fully sampled image respectively, μx & μy, σx & σy, σxy are mean, standard deviation of x&y, and covariance of x&y, respectively. C1 and C2 are small constants to avoid dividing by zero.
A RF sequence is implemented into the clinic scanner with ability to perform sparse acquisition with reduced phase encoding in real-time. To verify the effectiveness of the method, 4 different 3D CSI acquisitions were performed with sampling rate of 100%, 12.5%, 6.25% and 4% corresponding to R=1, 8, 16 and 25 respectively. All scans are performed with TR=2s, FOV=64mm, spectral BW=2.5k, spectral length=256 points and N=16 were used in all 3 direction phase encoding.
RESULTS:
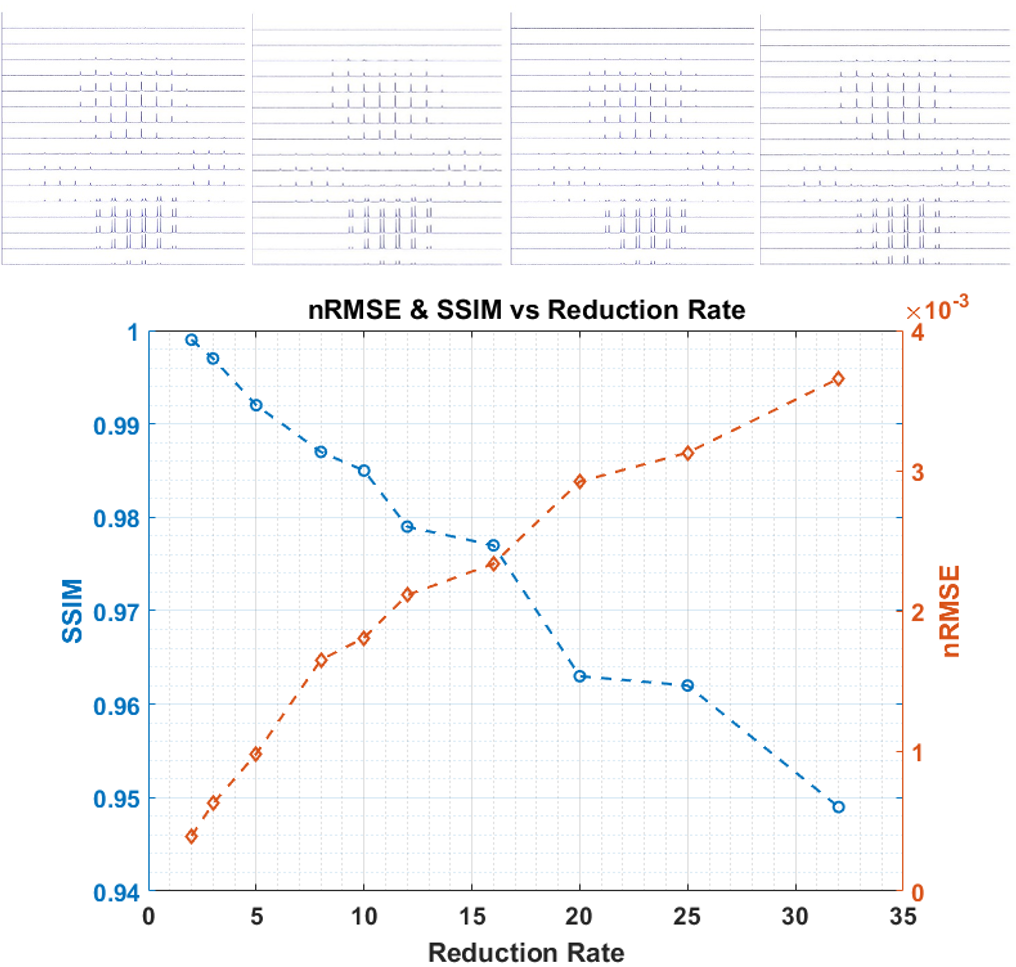
The center slice from the phantom of the CS reconstructed set of 4 representative reduction rates (R=1, 8, 16 and 32) from the artificially stripped data and the nRMSE and SSIM of all reduction rates are shown in Figure 3. Up to R=10, the reconstructions are very similar to the 100% acquired reference. At R=20, the noise begins to appear but remain acceptable even at R=32 where decent value of SSIM=0.949 and nRMSE=3.66x10⁻³ are maintained. The CS reconstructed images of the sparsely acquired R=25 data set is shown in Figure 4 along with the 100% acquired images. Despite minor artifacts, the resulting reconstructed images remain acceptable. The 4096 reconstructed spectra from the sparse data acquired at 12.5% sampling rate (R=8) were nearly identical to those from fully acquired data. At our targeted sampling rate of 6.25% (R=16), the results were quite satisfactory. Figure 5 shows the animated Maximum-Intensity-Projection (MIP) CS reconstructed 3D CSI of [1-13C]pyruvate as well as 3D images of its metabolic products [1-13C]alanine, [1-13C]lactate and 13C-bicarbonate from the rat kidney section from 12.5% and 6.25% sampled data.DISCUSSION:
The results showed that the 4D-CS method and the improved algorithm are very effective on 3D-CSI. It produced excellent image quality at our targeted reduction rate of R=16 with 6.25% sampling rate. This is plausible because in a hyperpolarized 13C media metabolic imaging field, the majority of 2D-CSIs have been performed using 16x16 phase encodings while the new 4D CS method can generates a good quality 3D-CSI spectrum with same number of RF excitations and an equivalent scan time.CONCLUSION:
This work demonstrates that with data and operators in 4D format and perform single data set optimization, highly accelerated 3D CSI acquisition can be reconstructed with excellent quality. This provides a new route for 3D metabolic imaging. For the first time, the 3D images of metabolites are obtained. It's possible to perform metabolic dynamic analysis if multiple sets of 3D CSI were acquired over time.Acknowledgements
This study was supported in part by NIH grants 2P41EB015908-29 and HL-34557References
1. Wang, J.-X., Merritt, M. E., Sherry, A. D. and Malloy, C. R., "Accelerated chemical shift imaging of hyperpolarized 13C metabolites". Magn. Reson. Med., (2016) 76: 1033–10382. Wang Z, Bovik AC, Sheikh HR, Simoncelli EP, "Image Quality Assessment: From Error Visibility to Structural Similarity", IEEE Transactions on Image Processing, (2004) Vol.13, No.4 1-14
3. Mann LW, Higgins DM, Peters CN, Cassidy S, Hodson KK, Coombs A, Taylor R, Hollingsworth KG, "Accelerating MR Imaging Liver Steatosis Measurement Using Combined Compressed Sensing and Parallel Imaging: A Quantitative Evaluation," Radiology. 2016 Jan;278(1):247-56
Figures