3538
Evaluation of Sparse Sampling for Improved Image Quality of 19F Fluorinated Gas Lung Ventilation MRI1POLARIS, Academic Radiology, University of Sheffield, Sheffield, United Kingdom, 2GE Healthcare Inc., Aurora, OH, United States
Synopsis
In an effort to improve image SNR per unit time and effective resolution in 19F-fluorinated gas ventilation imaging the application of compressed sensing was investigated. Simulations of sparse sampling were performed using a 3D 3He ventilation imaging dataset as a gold standard. Sparse and fully sampled image fidelity was quantified by the mean-square error and coefficient of variation of signal intensity. Simulations of low resolution and sparsely sampled images with equivalent acceleration factor were also compared. Based on the simulations prospective lung images using sparse sampling with C3F8 gas were then acquired in a healthy volunteer with acceleration factor of 4.
Background
Fluorinated gases have been demonstrated to be useful for ventilation MR imaging and have the added benefit of lower operational overheads when compared to HP gases1. However, the MR signal is orders of magnitude lower and the rapid transverse relaxation of 19F gases limits resolution and SNR2. Compressed sensing (CS) has been applied to hyperpolarized (HP) gas lung imaging3 to allow multiple acquisitions per breath-hold4,5, maintain SNR and/or reduce the radio-frequency induced polarization decay, whilst preserving image fidelity and spatial resolution6. However, it is not clear if similar benefits may be obtained with fluorinated gas imaging.Purpose
To investigate if the application of CS can improve image quality of lung ventilation images using C3F8 gas.Methods
Optimization of the sampling patterns was performed by retrospective analysis based on a fully sampled representative 3He ventilation image (3D SSFP acquisition with the desired 19F ventilation image resolution 4x4x10 mm3). Varying levels of Gaussian noise were added to the 3He image k-space to vary the mean SNR obtained from pixels within a threshold mask of the original image (SNR>6). Different acquisitions with varying noise were compared: fully sampled, undersampled of varying acceleration factor (AF) and equivalent AF low-resolution. Figure 1 shows the kyz phase encoding sampling patterns evaluated in simulation. Sampling follows a probability distribution function, with fully sampled area of radius (r) and a sampling density scaling according to a power (p) with distance outside that radius. For the same imaging time undersampled images may be averaged by a factor of AF more, so a $$$\sqrt{AF}$$$ factor lower noise is added to undersampled patterns than fully sampled.
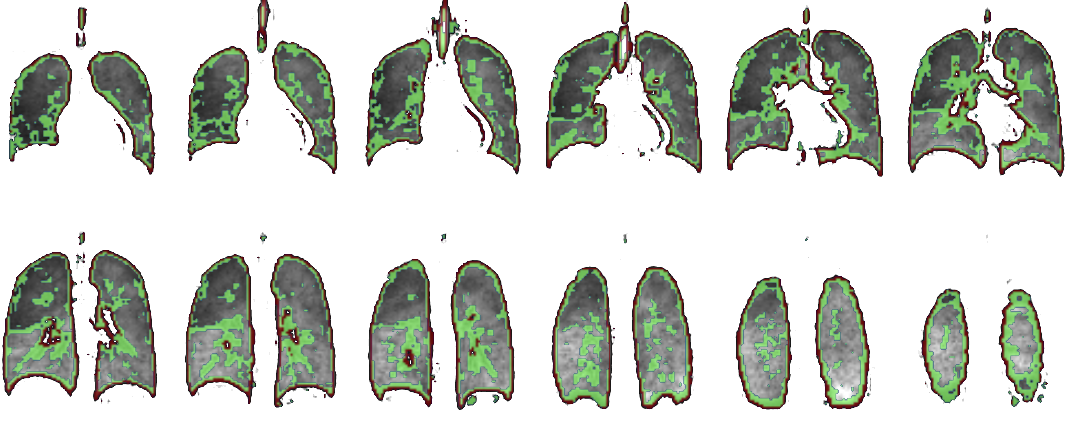
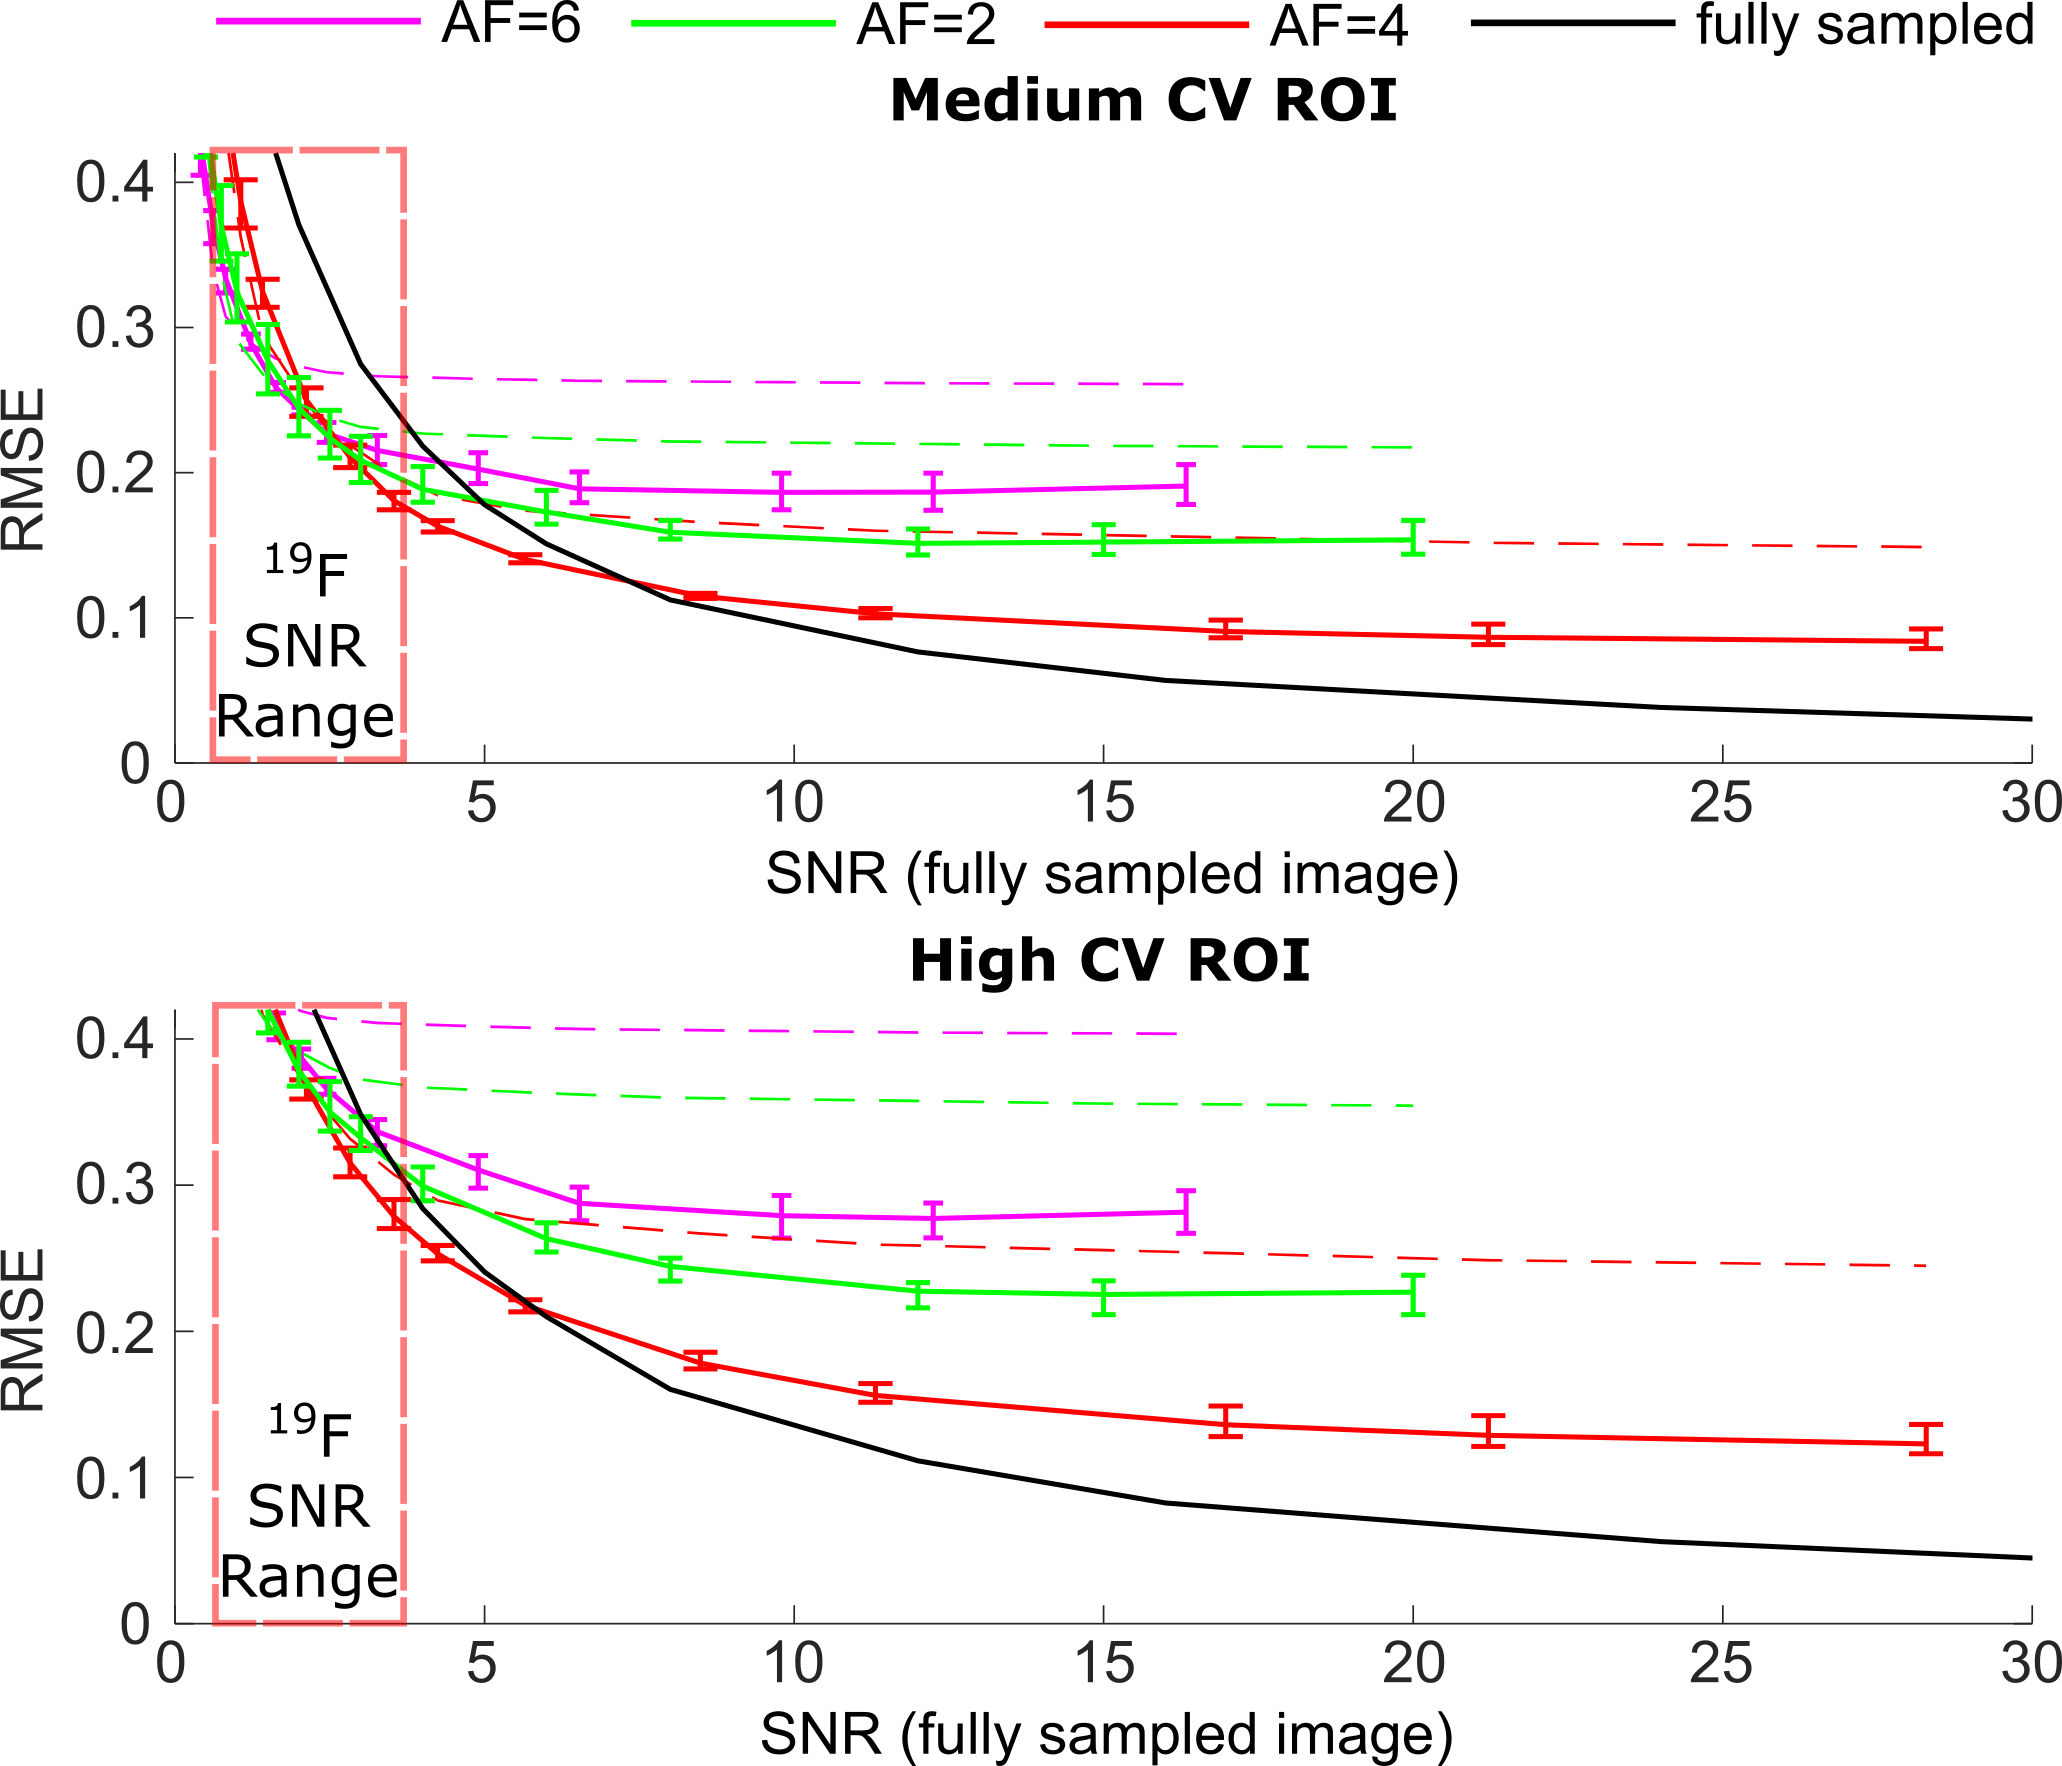
The non-linear CS reconstruction method used has been outlined previously3. The root mean square error (RMSE) was used for reconstruction performance comparison7. The coefficient of variation (CV) has been shown to change in the presence of respiratory pathology and been used as a marker of ventilation heterogeneity8. Maps were derived from the images where CV was between 0.15<0.35 (described as medium CV) and >0.35 (described as High CV). RMSE was compared for regions of interest (ROIs) where CV was high in order to investigate production of structural detail in the images.
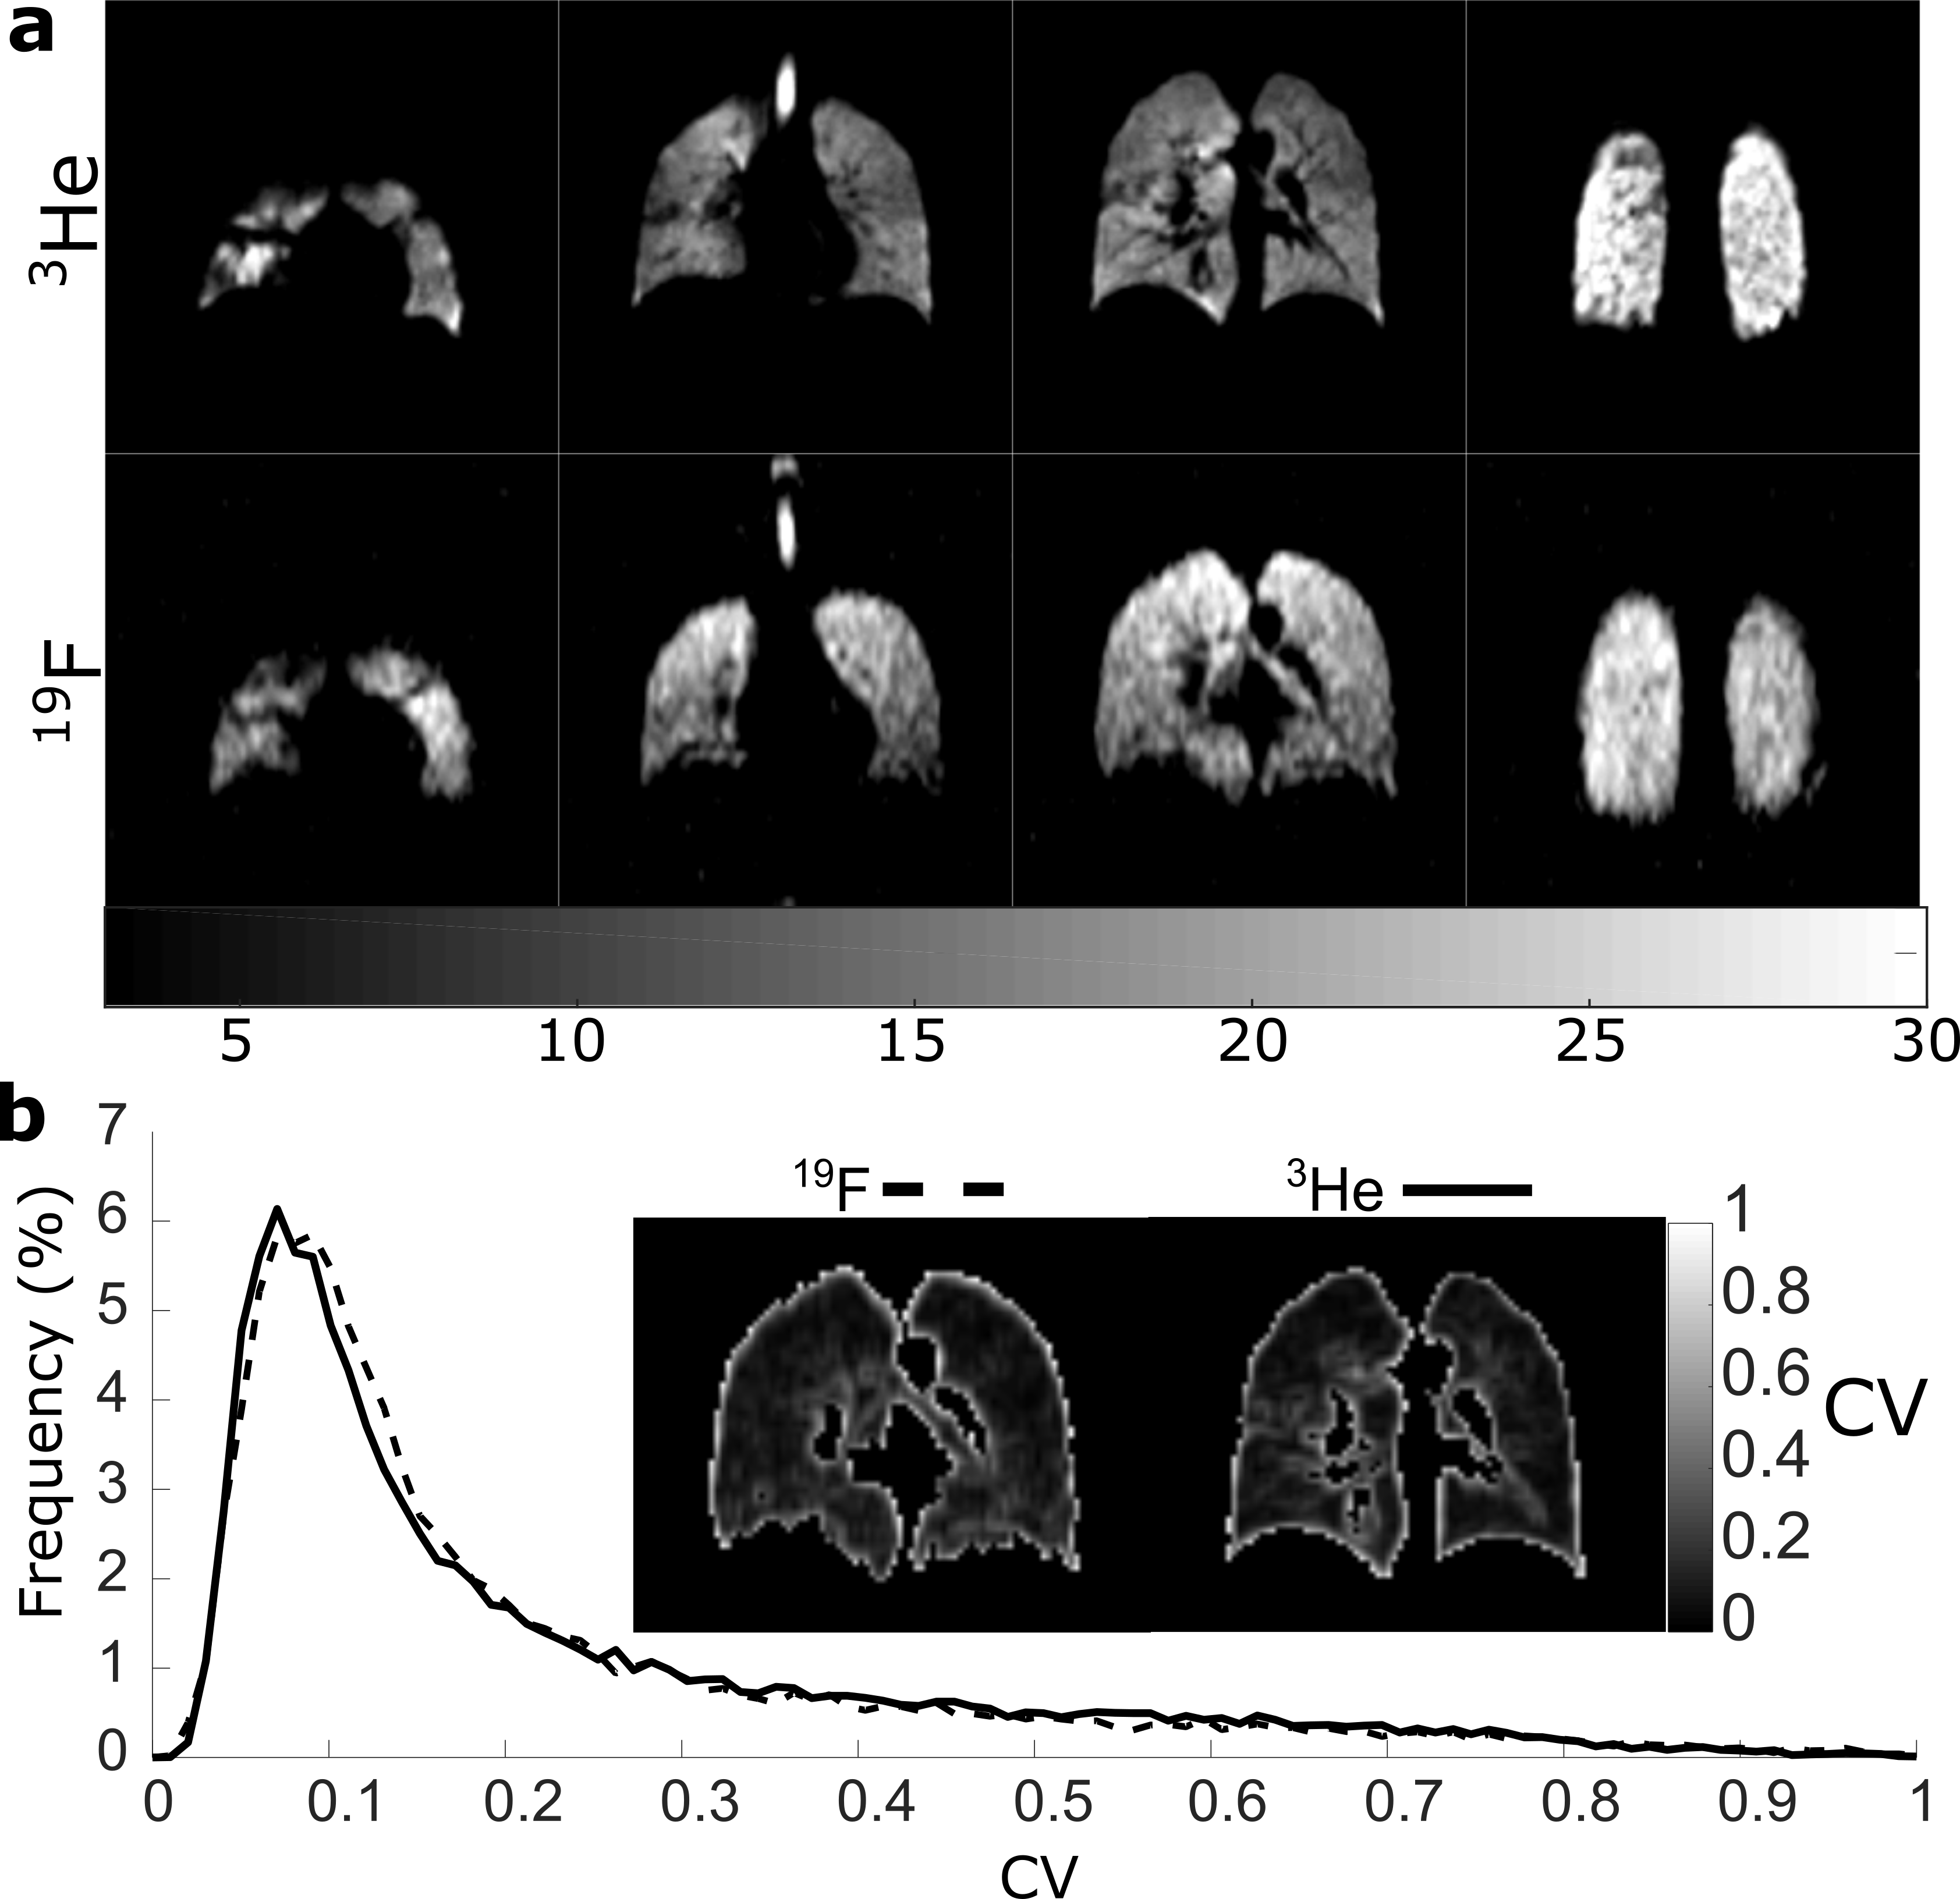
Finally, prospective in-vivo 19F ventilation imaging with compressed sensing was performed using a custom-built vest coil[9] at 1.5T. The SNR obtained in previous 19F imaging experiments was (~1210), while the relation $$$SNR~\sqrt{N_{avg}}∆x∆y∆z$$$11 indicates an SNR~0.5 would be expected for the resolution of 4x4x10 mm3. To obtain high enough SNR the frequency encoding resolution was 8mm and multi-breath averaging was employed (for fully sampled SNR~3). 19F Imaging parameters are detailed in caption of Figure 5. 3He images were obtained from the same volunteer.
Results
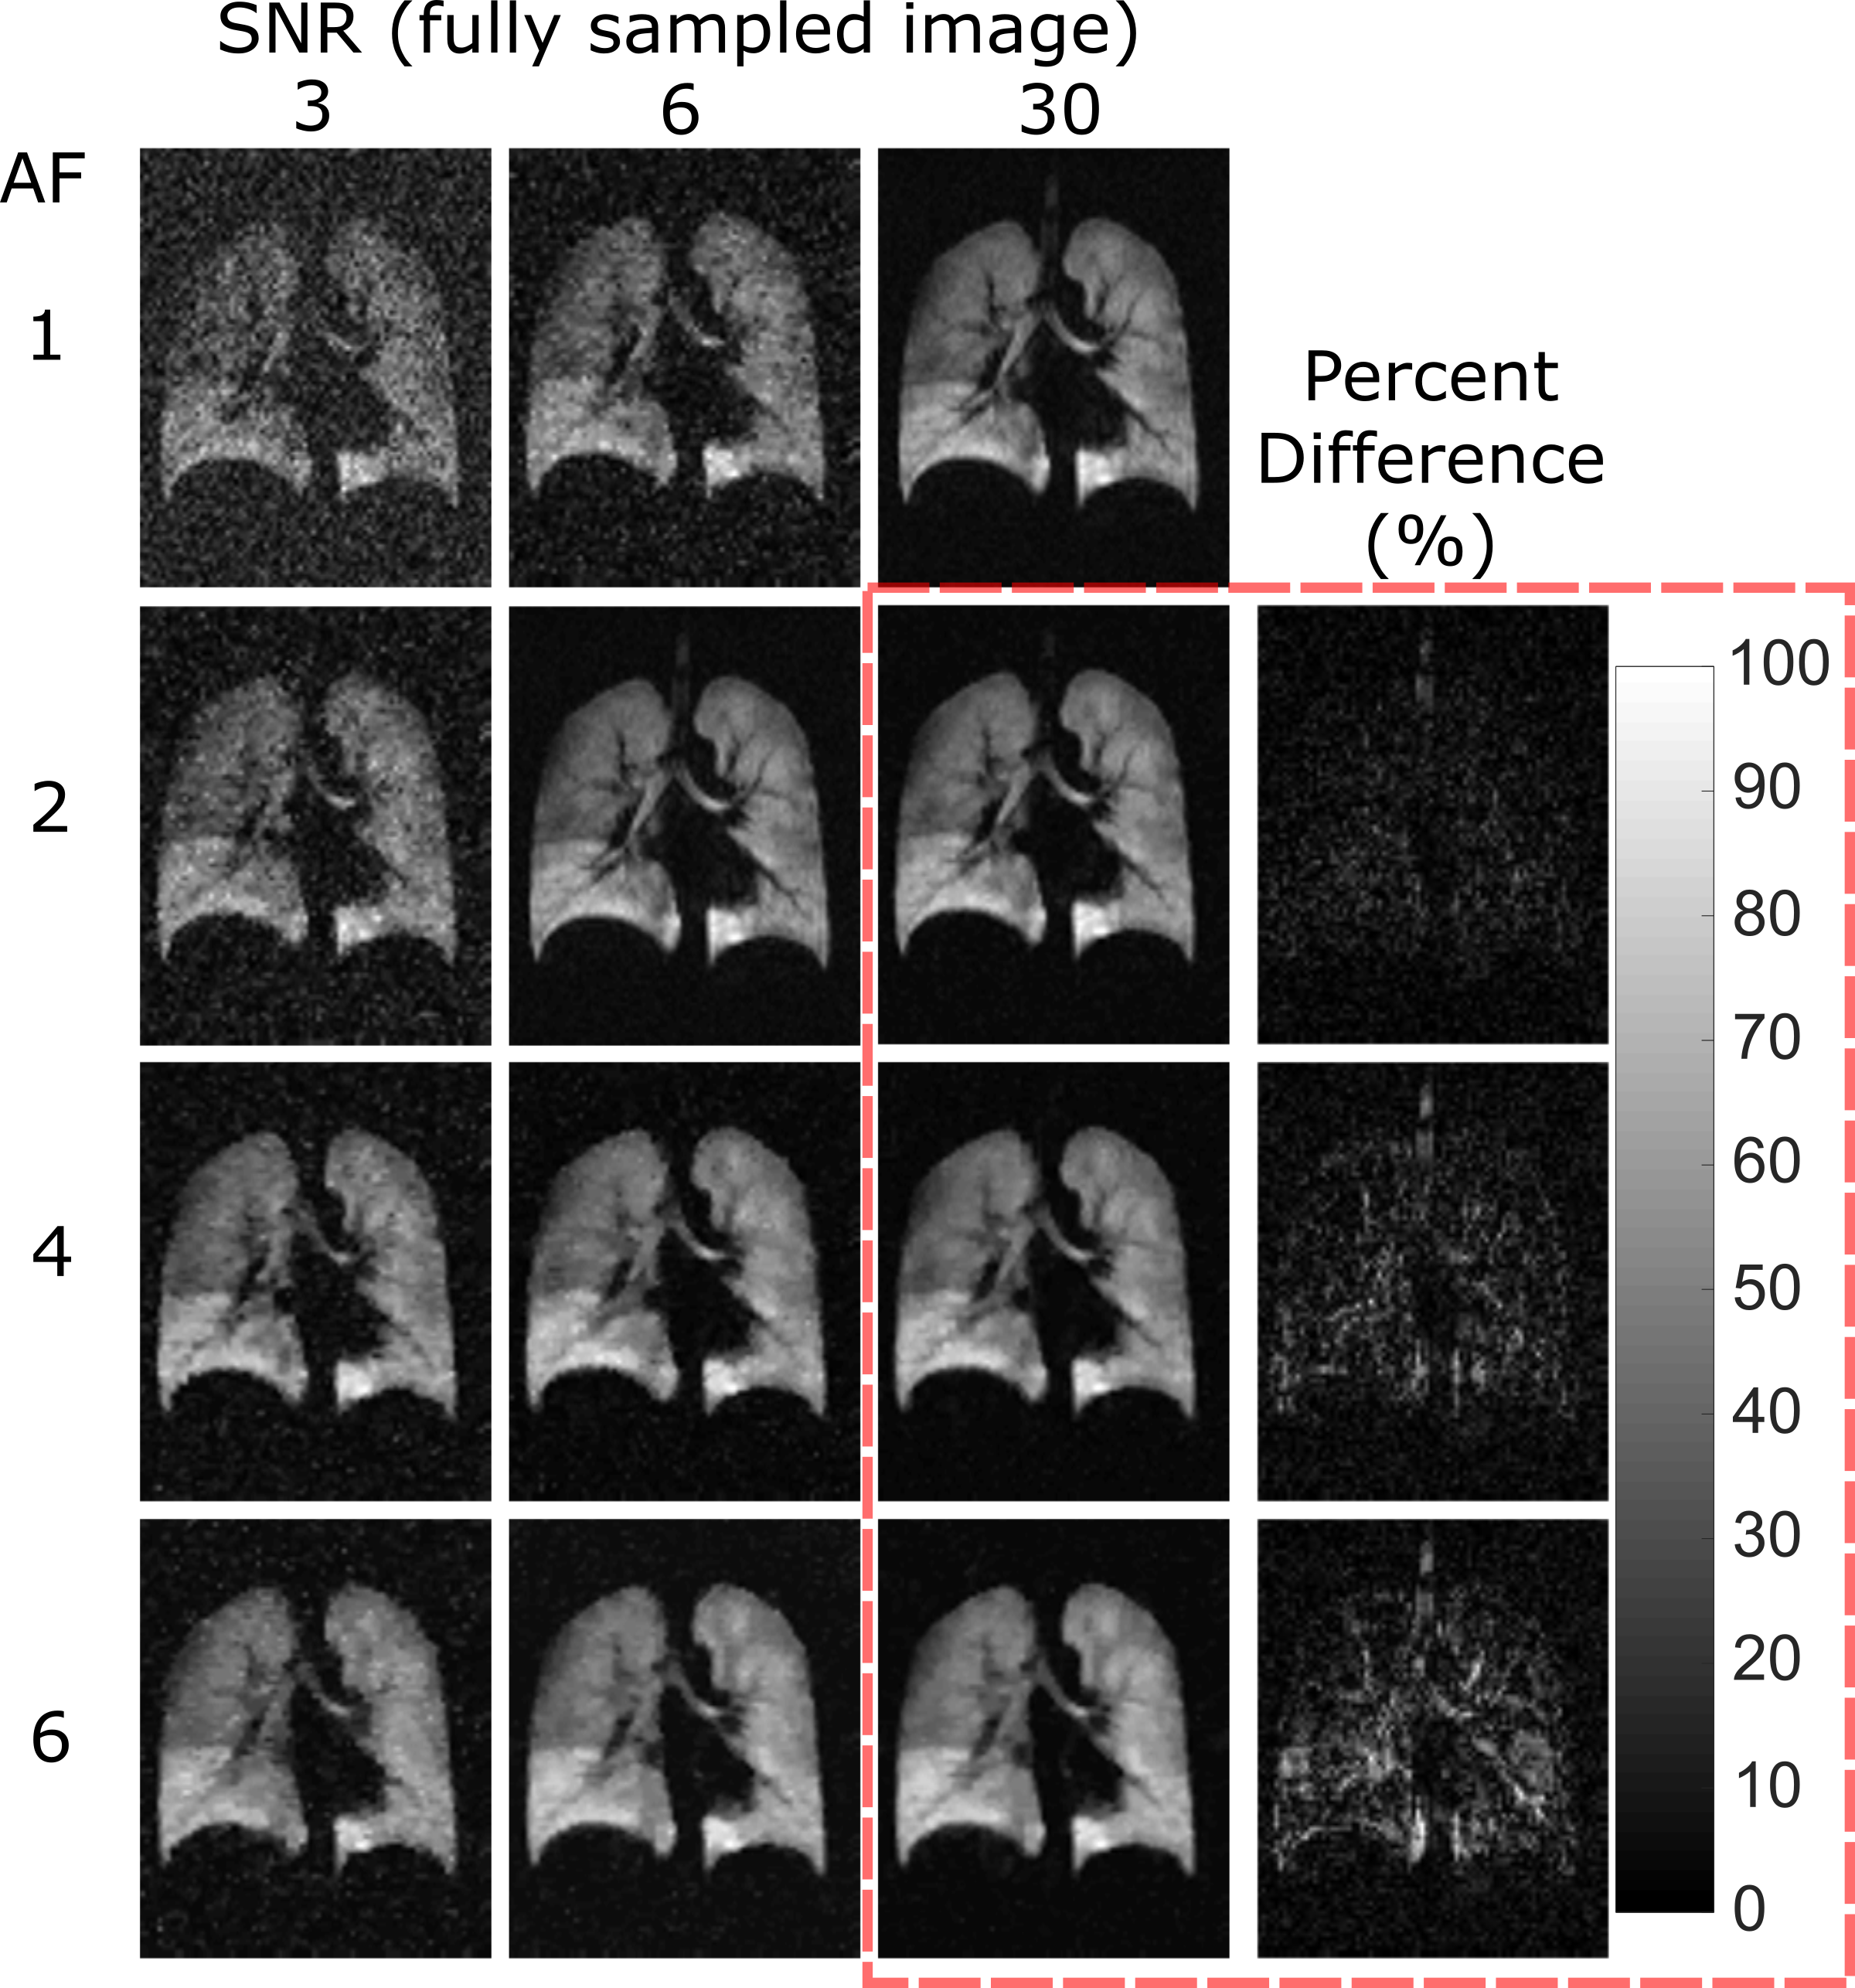
High (red) and medium (green) signal variability regions are overlaid on the reference images in Figure 2. The mean RMSE for the different AF sampling pattern images within these signal variation regions are shown in Figure 3. The range of RMSE for the different sampling patterns are depicted by the error bars. There is a small variation in performance with the different sampling patterns. The approximate range of SNR with 19F ventilation imaging at 1.5T is indicated. Different reconstructed images are displayed in Figure 4, visually demonstrating the blurring as SNR decreases and AF increases. The percent error of the high SNR image examples reveal regions of high error with varying AF. A visual comparison of the 3He image and 19F undersampled image is shown in Figure 5. The 19F images are of nearly equivalent SNR. The CV histograms generated from the in-vivo images are shown in Figure 5b and have similar distributions.Discussion and Conclusion
It appears to be preferable to fully acquire data when SNR is high. RMSE of undersampled images was reduced when compared to conventional low-resolution imaging, but RMSE of less sparsely sampled data (similar to use of an elliptical kyz shutter) was similar to data acquired with greater sampling sparsity. Based on RMSE the range of image SNR obtainable with 19F imaging places clear restrictions on spatial resolution. Although the reconstructed voxel size is the same, the sampled resolution of 3He and 19F is not, so CV metrics may not be directly comparable. In 19F imaging there are artefacts present at the inferior portion of the lung due to a combination of SSFP banding and varying inflation level during multi-breath averaging. Diseased lungs are also expected to manifest greater ventilation heterogeneity, making the expected difference in CV due to different 19F and 3He sampling resolutions more perceptible. Nonetheless, applying the principles of sparse sampling 19F images were obtained with high resulting SNR (>20), sharp edge definition and comparable CV distribution to those obtained with 3He in the same volunteer.Acknowledgements
Doctoral program funding for Adam Maunder was partially provided by support from GE Healthcare Inc. and scholarships from the Natural Sciences and Engineering Research Council of Canada (NSERC) and University of Sheffield. This work was funded by the National Institute for health research (NIHR), Medical Research Council (MRC) and University of Sheffield Hyperpolarised Imaging Group - POLARIS. The views expressed in this abstract are those of the author and not necessarily those of NHS, NIHR, MRC or the Department of Health.References
1. M. Gutberlet, T. F. Kaireit, A. Voskrebenzev, F. Lasch, J. Freise, T. Welte, et al., "Free-breathing Dynamic 19F Gas MR Imaging for Mapping of Regional Lung Ventilation in Patients with COPD," Radiology, p. 170591, Oct 03 2017.
2. M. Couch, B. Blasiak, B. Tomanek, A. Ouriadov, M. Fox, K. Dowhos, et al., "Hyperpolarized and Inert Gas MRI: The Future," Molecular Imaging and Biology, vol. 17, pp. 149-162, 2015/04/01 2015.
3. M. Lustig, D. Donoho, and J. M. Pauly, "Sparse MRI: The application of compressed sensing for rapid MR imaging," Magnetic Resonance in Medicine, vol. 58, pp. 1182-1195, 2007.
4. J. M. Wild, S. Ajraoui, M. H. Deppe, S. R. Parnell, H. Marshall, J. Parra-Robles, et al., "Synchronous acquisition of hyperpolarised 3He and 1H MR images of the lungs – maximising mutual anatomical and functional information," NMR in Biomedicine, vol. 24, pp. 130-134, 2011.
5. H.-F. Chan, N. J. Stewart, G. Norquay, G. J. Collier, and J. M. Wild, "3D diffusion-weighted 129Xe MRI for whole lung morphometry," Magnetic Resonance in Medicine, pp. n/a-n/a.
6. K. Qing, T. A. Altes, N. J. Tustison, X. Feng, X. Chen, J. F. Mata, et al., "Rapid acquisition of helium-3 and proton three-dimensional image sets of the human lung in a single breath-hold using compressed sensing," Magnetic Resonance in Medicine, vol. 74, pp. 1110-1115, 2015.
7. S. Ajraoui, J. Parra-Robles, and J. M. Wild, "Incorporation of prior knowledge in compressed sensing for faster acquisition of hyperpolarized gas images," Magnetic Resonance in Medicine, vol. 69, pp. 360-369, 2013.
8. Y. S. Tzeng, K. Lutchen, and M. Albert, "The difference in ventilation heterogeneity between asthmatic and healthy subjects quantified using hyperpolarized 3He MRI," J Appl Physiol (1985), vol. 106, pp. 813-22, Mar 2009.
9. A. Maunder, M. Rao, F. Robb, and J. Wild, "RF coil design for multi-nuclear lung MRI of 19F fluorinated gases and 1H using MEMS," Proc. Intl. Soc. Mag. Reson. Med., vol. 24, p. 3504, 2016.
10. A. Maunder, N. J. Stewart, M. Rao, F. J. L. Robb, and J. M. Wild, "Steady-state Free Precession for Improved Signal to Noise in Lung Ventilation Imaging with 19F Perfluoropropane at 1.5 T," Proc. Intl. Soc. Mag. Reson. Med., vol. 25, p. 3318, 2017.
11. S. B. Reeder and E. R. McVeigh, "The Effect of High Performance Gradients on Fast Gradient Echo Imaging," Magnetic resonance in medicine : official journal of the Society of Magnetic Resonance in Medicine / Society of Magnetic Resonance in Medicine, vol. 32, pp. 612-621, 1994.
Figures