3527
Minimum-variance weighted image reconstruction and the application to MRI1Department of Radiology, University of Cambridge, Cambridge, United Kingdom, 2Neurospin, CEA Saclay, Paris, France
Synopsis
Non-stationary MRI noise occurs in sparse and non-uniform k-space. Weighted least squares regression has been used to handle data with non-stationary noise. A minimum-variance weighting function may reduce the variance (image noise) of the image, and it may also relax the regularization needed for MRI reconstruction. To obtain the optimal weighting in non-uniform MRI reconstruction, this study uses the Monte Carlo method to determine the minimum-variance weighting function in Shepp-Logan phantom and breast MRI. The parameter $$$\alpha=-0.5$$$ provides a weighting function with the minimum-variance in the reconstructed images.
Introduction
The statistical regression model is an image reconstruction method for non-Cartesian MRI. The common regression method minimizes the cost function composed of the least squares error of the data fidelity term and regularization, which can be formulated by the following equation:
$$ argmin_x\left\Vert {\bf A}x - y \right\Vert_2^2 + \lambda R(x) $$
where $$$x$$$ is the target image, $$${\bf A}$$$ is the fast non-uniform fast Fourier transform (NUFFT) or non-equispaced fast Fourier transform (NFFT), $$$y$$$ is the acquired k-space data, $$$R(x)$$$ is the image regularization and $$$\lambda$$$ is the strength of the regularization. This is the cost function for a majority of image reconstruction problems, which can be solved by the conjugate gradient method (when $$$R(x)$$$ is omitted) or other optimization methods.
The above least squares regression model is based on the assumption of stationary noise, which is usually valid in non-Cartesian k-space. However, the non-uniform geometry of non-Cartesian k-space can introduce non-stationary noise into the equispaced grid, and images reconstructed from non-Cartesian MRI are often influenced by non-stationary noise with heterogeneous variance distribution.
Robust statistical regression can include a weighting function to stabilize the reconstruction and to reduce the noise variance. A heuristic weighting function $$$D^2=w^{2\alpha}$$$ is added into the cost function:
$$ x=argmin_x\left\Vert D^2{\bf A}x - D^2y \right\Vert_2^2 + \lambda R(x) $$
Here, $$$w$$$ is the sampling density compensation function of Pipe et al.1 Two different optimization problems are tested in this work: (1) the $$$\ell$$$2 minimization of the data fidelity, which is quadratic and can be solved by the conjugate gradient method (CG). In this case, $$$R(x)$$$ is omitted; (2) the split-Bregman method for the isotropic $$$\ell$$$1 total-variation regularized image reconstruction (L1TV-OLS). The isotropic total-variation $$$TV(x)$$$ is the distance of multi-dimensional first order finite difference ($$$\nabla_x, \nabla_y$$$ in the 2D case) of the image $$$x$$$:
$$TV(x)=\sqrt{(\nabla_x x)^2+(\nabla_y x)^2}$$
Method
The current study employs the Monte Carlo simulation method to find the optimum weighting function. Sixteen Monte Carlo realizations were carried out using the high-performance Python NUFFT package,2 which implemented the min-max NUFFT algorithm of Fessler and Sutton3 on heterogeneous platforms.
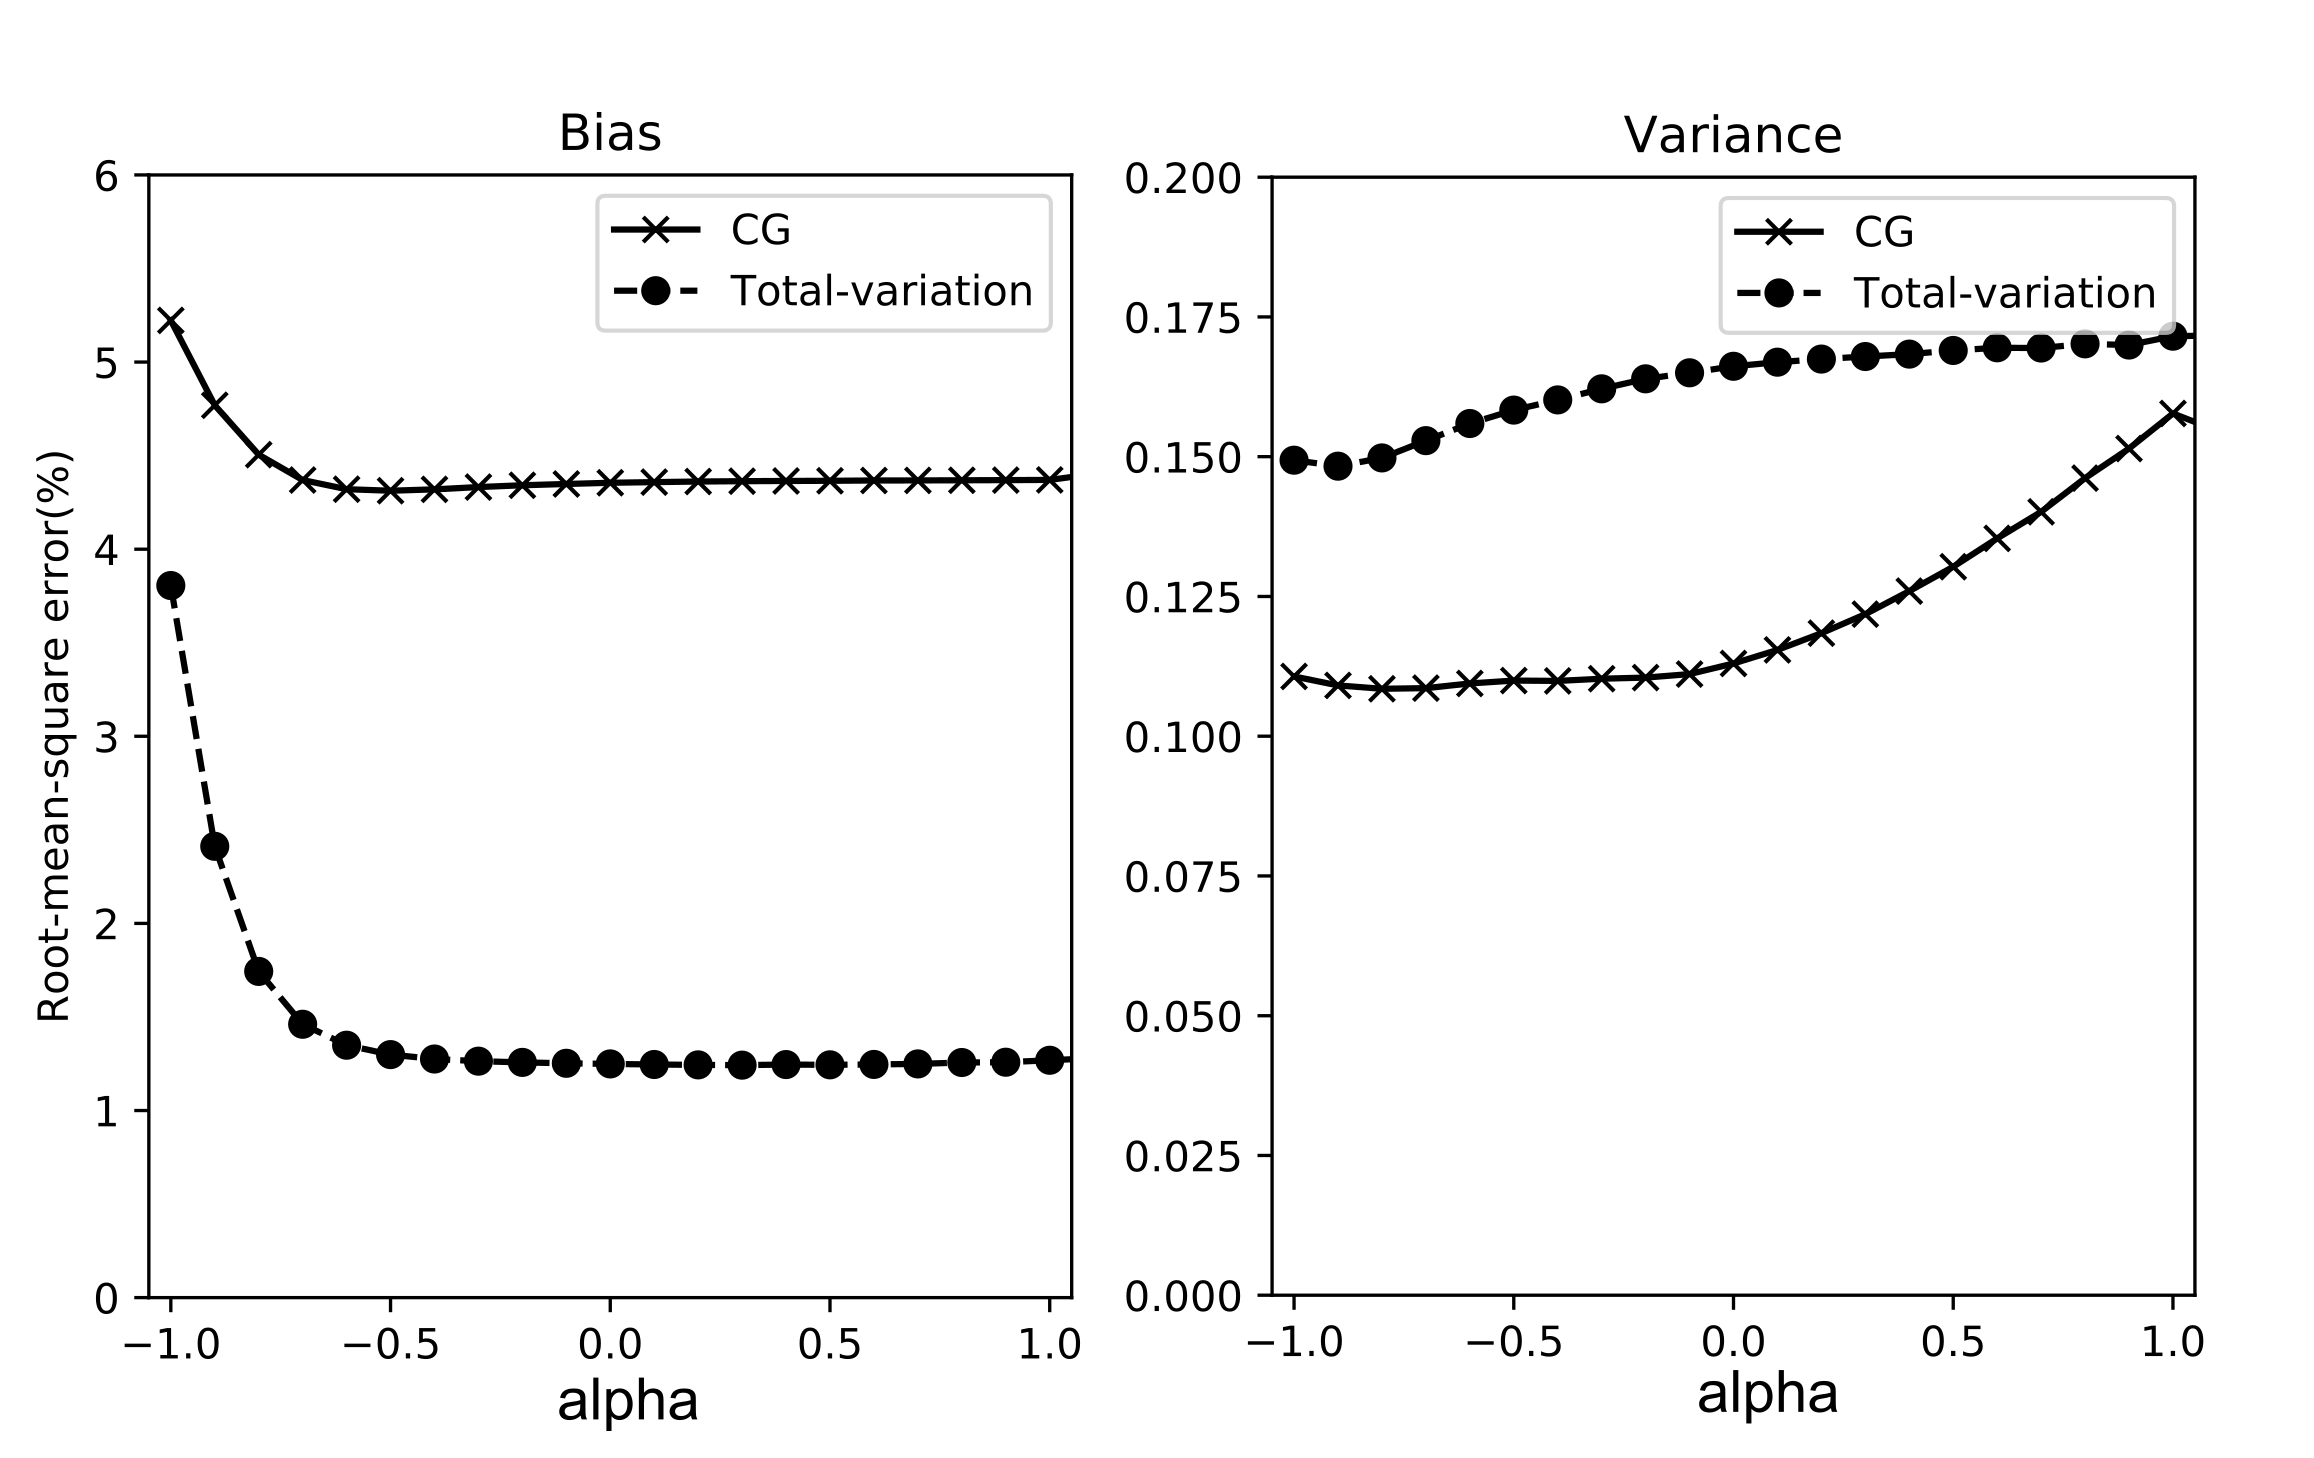
Non-uniform k-space data were generated from a modified Shepp-Logan phantom and a breast MRI image taken from the RIDER database.4 Then the noise was randomly generated and added to the simulated data. Each reconstruction method took about 2 seconds and all the simulation times were completed within one hour. The $$$\alpha$$$ values changed from -1.0 to 1.0. While negative $$$\alpha$$$ values give more weighting to the oversampled k-space regions, positive $$$\alpha$$$ values taper the signals in the oversampled regions and strengthen the signals in the under-sampled regions. The root-mean-square-error (RMSE) and variance of different values were calculated from 16 realizations.
Results
Figure 1 illustrates the trade-off between bias and variance. It seems $$$\alpha=-0.5$$$ provides the minimum-variance weighting and lowest bias. Uniform weighting function ($$$\alpha=0$$$) provides a suboptimal image variance which is inferior to the value of $$$\alpha={-0.5}$$$.
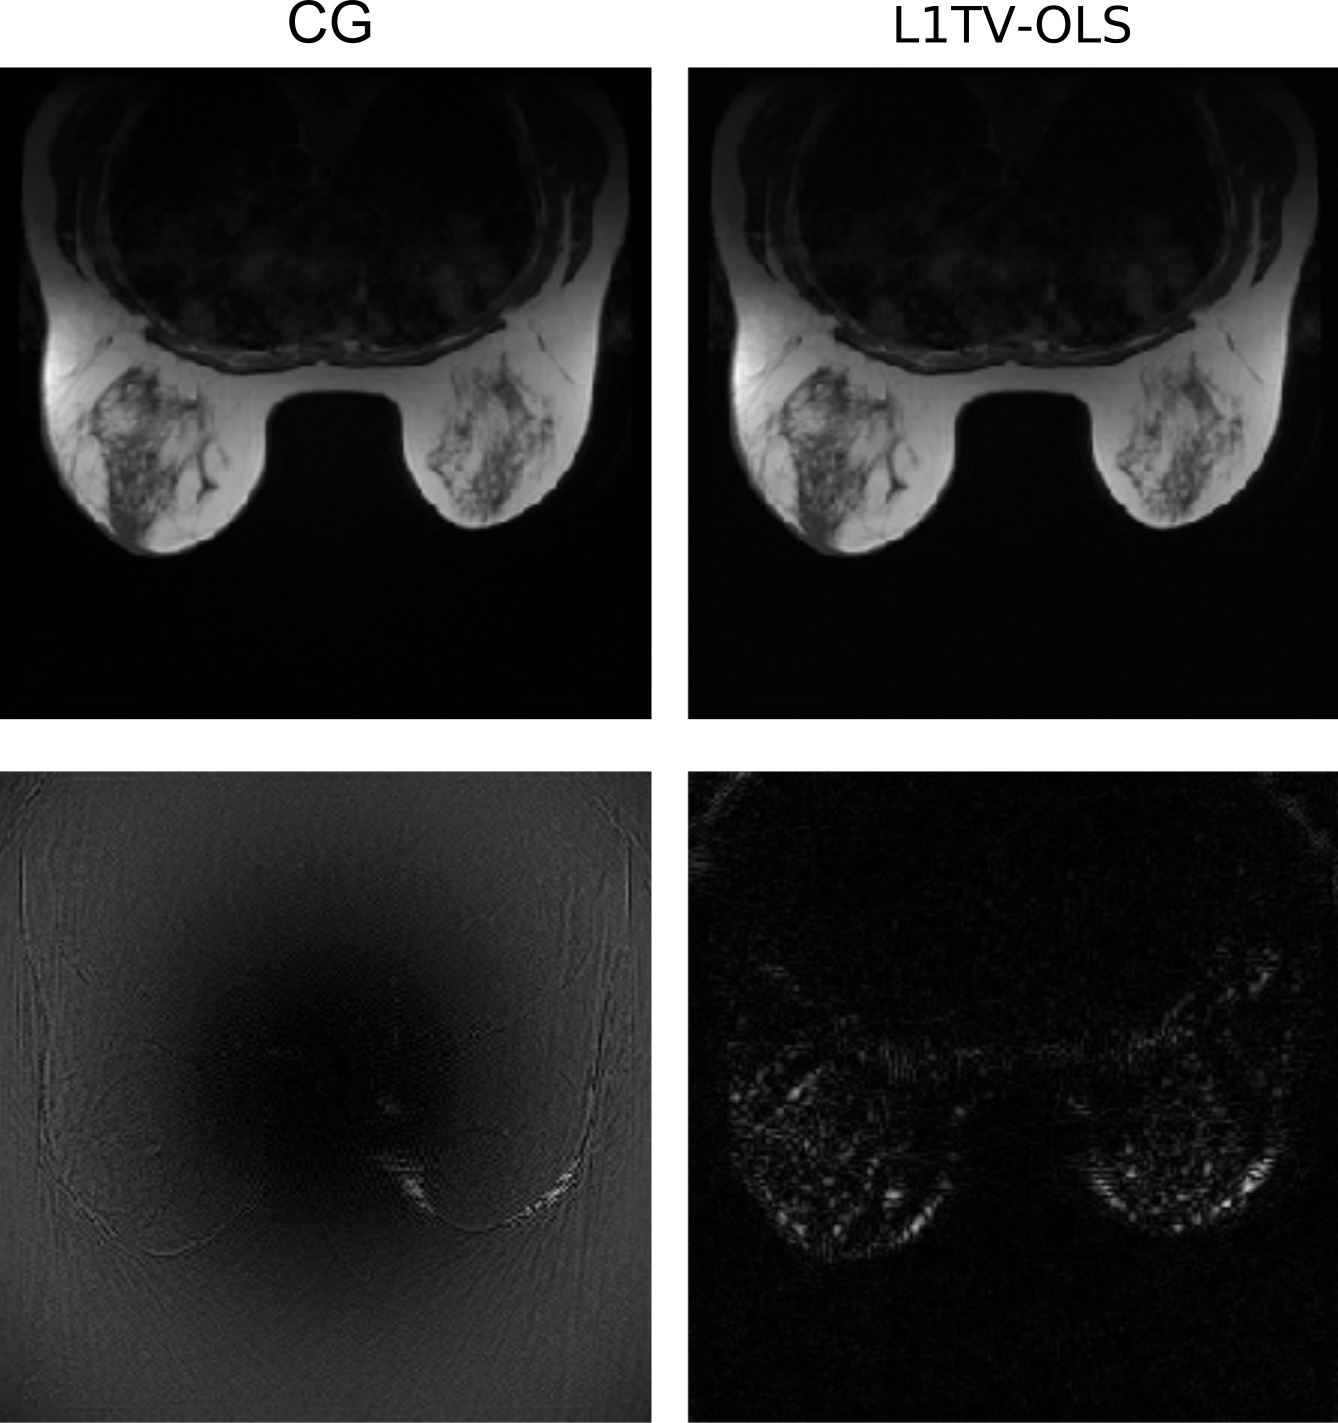
Figure 2 shows the images of conjugate gradient methods (CG) compared with L1TV-OLS. Overall, both CG and L1TV-OLS can reconstruct the images without visually perceptible RMSE. The subtle differences between CG and L1TV-OLS are manifested in the distribution of mild errors. The errors of CG spread all over the image, whereas errors of L1TV-OLS aggregate in the periphery of the breasts.
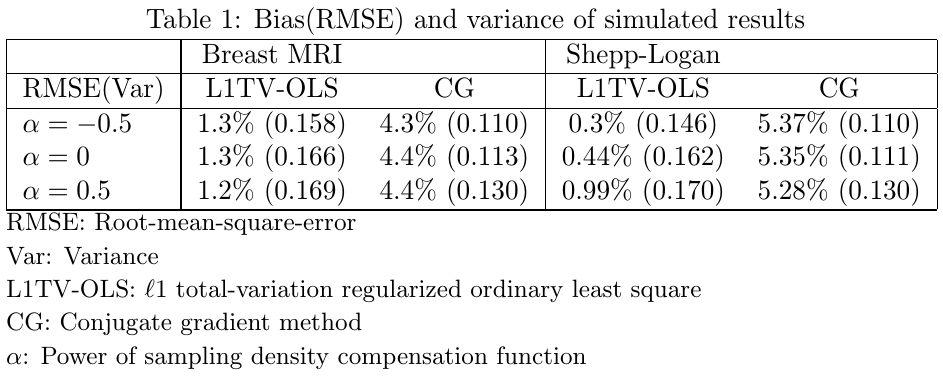
Table 1 lists the bias and variance obtained from the Monte Carlo simulation. The value $$$\alpha={-0.5}$$$ seems to reduce the bias and variance of the two algorithms. For L1TV-OLS, 31% bias and 13% variance have been reduced in the Shepp-Logan phantom, and up to 5% variance is reduced in the breast MRI. A lower reduction level (0%-5%) was attained in CG.
Discussions and conclusion
A minimum-variance weighting function reduces the noise of the reconstructed image, and would probably relax the strength of the regularization terms. The optimum $$$\alpha=-0.5$$$ and the minimum-variance weighting function of $$$D^2=1/w$$$ seems to be consistent with the common weighted statistical regression methods, in which the weighting function is inversely proportional to the variance of the noise.5 In this respect, $$$D^2=1/w$$$ puts an emphasis on the oversampled region with lower noise variance. Perhaps the minimum-variance weighting function may be included in the image reconstruction of the SPARKLING curves (Segmented Projection Algorithm for Random K-space sampLING),6 or other high-dimensional non-Cartesian sampling methods.Acknowledgements
Parts of the computing resources were supported by the NVIDIA GPU Grant Program and Amazon AWS Educate credit. J.-M. Lin acknowledges the independent fellowship from the Ministry of Science and Technology, Taiwan.References
[1] James G Pipe and Padmanabhan Menon. Sampling density compensation in MRI: Rationale and an iterative numerical solution. Magnetic Resonance in Medicine, 41(1):179–186, 1999.
[2] Jyh-Miin Lin. Python non-uniform fast Fourier transform (PyNUFFT): multi-dimensional non-Cartesian image reconstruction package for heterogeneous platforms and applications to MRI. 2017.https://arxiv.org/abs/1710.03197v1.
[3] Jeffrey A Fessler and Bradley P Sutton. Nonuniform fast Fourier transforms using min-max interpolation. IEEE Transactions on Signal Processing, 51(2):560–574, 2003.
[4] Charles R Meyer, Thomas L Chenevert, Craig J Galbán, Timothy D Johnson, Daniel A Hamstra, Alnawaz Rehemtulla, and BrianRoss. Data from RIDER Breast MRI. The Cancer Imaging Archive,http://doi.org/10.7937/K9/TCIA.2015.H1SXNUXL, Accessed: 2017-10-27.
[5] National Institute of Standards and Technology. Section 4.1.4.3. Weighted Least Squares Regression, NIST/SEMATECH e-Handbook of StatisticalMethods. http://www.itl.nist.gov/div898/handbook/index.htm, Accessed:2017-10-31.D.
[6] Carole Lazarus, Pierre Weiss, Nicolas Chauffert, Franck Mauconduit, Michel Bottlaender, Alexandre Vignaud, and Philippe Ciuciu. SPARKLING: Novel non-Cartesian sampling schemes for accelerated 2D anatomical imaging at 7T using compressed sensing. Proceedings of the 25th International Society of Magnetic Resonance in Medicine, 2017.
Figures