3517
Partial Fourier Acquisitions in Myocardial First Pass Perfusion Revisited1Institute for Biomedical Engineering, University and ETH Zurich, Zurich, Switzerland, 2Department of Cardiology, University Hospital Zurich, Zurich, Switzerland
Synopsis
The inflow of a paramagnetic contrast agent (CA) in cardiac dynamic contrast-enhanced (DCE) MRI effects the local phase of magnetization. In this work the impact of phase variations on Partial Fourier (PF) reconstruction is simulated for k-space zero filling, homodyne (HR) and projections onto convex sets (POCS) reconstruction and consequently assessed in in-vivo first-pass perfusion. CA induced phase variations in DCE MRI are seen to compromise HR and POCS reconstruction of PF data to an extent where they do not convey any benefit over simple zero-filling reconstruction.
Introduction
Partial Echo (PE) and Partial Fourier (PF) acquisitions schemes1 are part of standard clinical protocols for the assessment of myocardial first-pass perfusion (FPP) as they shorten echo time (TE) and shot duration of the readout, respectively2. For both, PE and PF reconstruction, Hermitian symmetry of k-space is assumed or approximated3-5. In dynamic contrast-enhanced (DCE) MRI, significant phase variations are induced by the inflow of a paramagnetic contrast agent (CA)6, violating the Hermitian symmetry and impairing reconstruction. The objective of the present work is to assess phase variations in cardiac DCE MRI and their impact on PE/PF homodyne reconstruction (HR) and the method of projections onto convex sets (POCS) based on simulated and in-vivo first-pass myocardial perfusion data.
Theory
Since Hermitian symmetry in k-space i.e. $$$\tt \it S\tt \left(\it k\right)=\left[\it S\tt \left(\it k\right)\right]^{*}$$$ is not guaranteed, a low-resolution phase image estimate is extracted from a symmetrically acquired k-space portion centered around DC to correct for phase variations.
The low-resolution object phase $$$\phi_{est}$$$ is subsequently used according to:
$$\it F\left\{s\left(x\right)e^{-i\phi_{est}\left(x\right)}\right\}\left(\it k\right) =\left[\it F\left\{s\left(x\right)e^{-i\phi_{est}\left(x\right)}\right\}\left(\it -k\right)\right]^{*}{}\left(1\right)$$
Real-valued images can be recovered using homodyne reconstruction (HR) according to:
$$ I(x)=\int_{-k_\text{max}}^{k_0}\text{d}k\,\tilde{S}(k)e^{\text{i}kx}+\int_{-k_0}^{k_0}\text{d}k\,\tilde{S}(k)e^{\text{i}kx}+\int_{k_0}^{k_\text{max}}\text{d}k\,\tilde{S}(k)e^{\text{i}kx}=\int_{-k_0}^{k_0}\text{d}k\,\tilde{S}(k)e^{\text{i}kx}+2\text{Re}\left[\int_{k_0}^{k_\text{max}}\text{d}k\,\tilde{S}(k)e^{\text{i}kx}\right]{}\left(2\right)$$
Alternatively, POCS4 has been proposed, calculating projections onto the set $$$\Omega_1$$$ of the images, which agree with the estimated phase $$$\phi_{est}$$$, and projections onto set $$$\Omega_2$$$ of data, which matches the acquired k-space data. In the extended, parallel POCS7 a weighting $$$\mu$$$ of these projections is used:
$$\Omega_1=\left\{I(x):\angle{}I(x)=\phi_\text{est}(x)\right\}$$
$$\Omega_2=\left\{I(x):\mathcal{F}\left\{I(x)\right\}(k)=S(k);k\in[k_0;k_\text{max}]\right\}{}\left(3\right)$$
$$x_{n+1}=1-\mu\cdot{}P_{\Omega_1}(x_n)+\mu\cdot{}P_{\Omega_2}(x_n)$$
In DCE MRI, the phase shift induced by influx of CA can be estimated according to
$$\Delta\varphi=\gamma\frac{\Delta{}\overrightarrow{B}\cdot{}\overrightarrow{H_0}}{\left\|\overrightarrow{H_0}\right\|}T_E=4\pi\omega_0X_MF\cdot{}C\cdot{}T_E{}\left(4\right)$$
where $$$\Delta{}\overrightarrow{B}$$$ denotes change in the magnetic induction relative to the static external field $$$\overrightarrow{H_0}$$$ expressed as product of
frequency $$$\omega_0$$$, the molar susceptibility $$$X_M$$$, geometry factor F and the
concentration C of the CA6,8, yielding a linear relationship between $$$\Delta\varphi$$$
and CA
concentration.
Methods
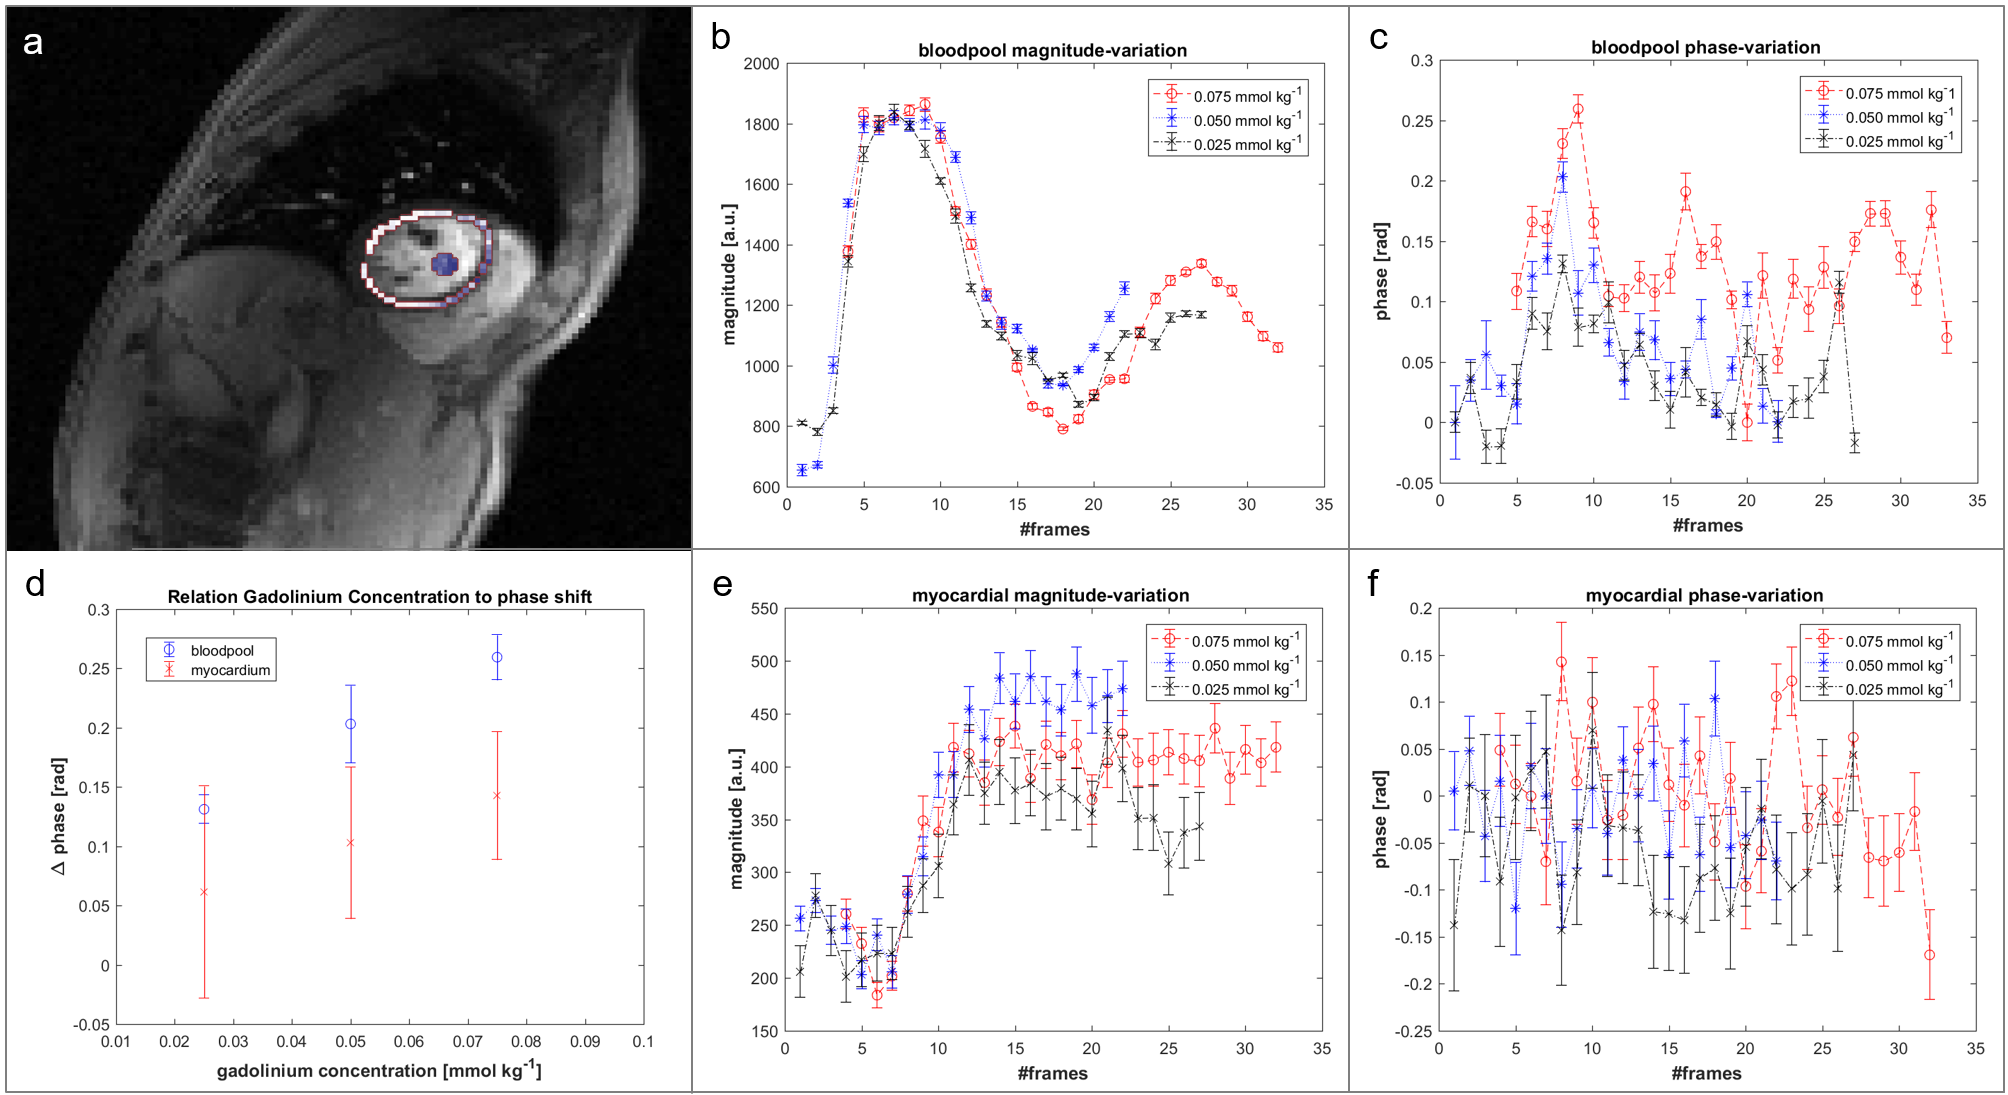
The induced phase variation during CA application was assessed by in-vivo FPP measurements in two healthy volunteers on a Philips Ingenia 3.0T scanner (Philips Healthcare, Best, The Netherlands) using a 32-channel cardiac coil array. Three measurements were obtained in each subject separated by 15min with decreasing concentrations of 0.075mmol/kg, 0.05mmol/kg and 0.025mmol/kg of Gadobutrol (Gadovist, Bayer Schering Pharma, Germany). A saturation-recovery spoiled gradient-echo sequence with ECG triggering was used to acquire a fully sampled mid-ventricular slice at mid diastole in a single breath hold. Imaging parameters were as follows: TE/TR =1.67ms/2.8ms, FOV: 300x290x10mm3, flip angle: 15° and in-plane resolution: 2.5x2.5x10mm3.
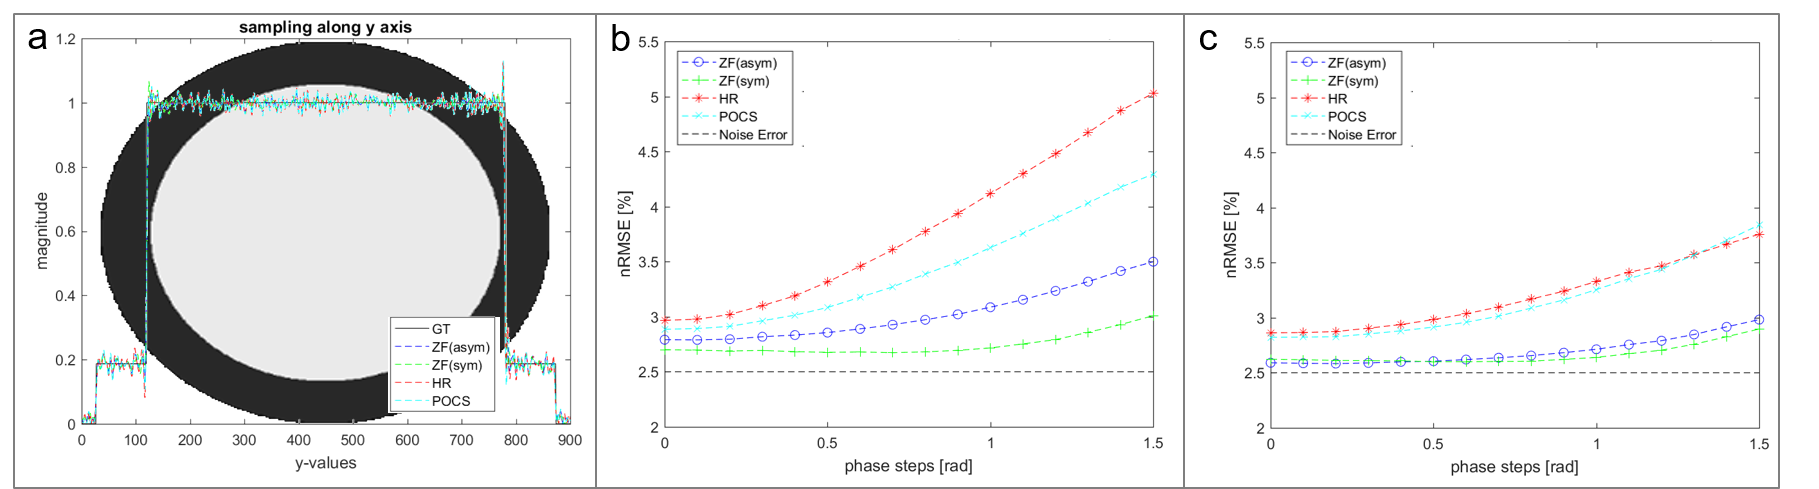
A computer model of the left-ventricular short axis was implemented (Figure 2a.) with different phase offsets (0-1.5rad) between blood-pool and myocardium. The complex-valued model was scaled according to in-vivo measured magnitude and phase values at time point of peak blood-pool and myocardium signal.
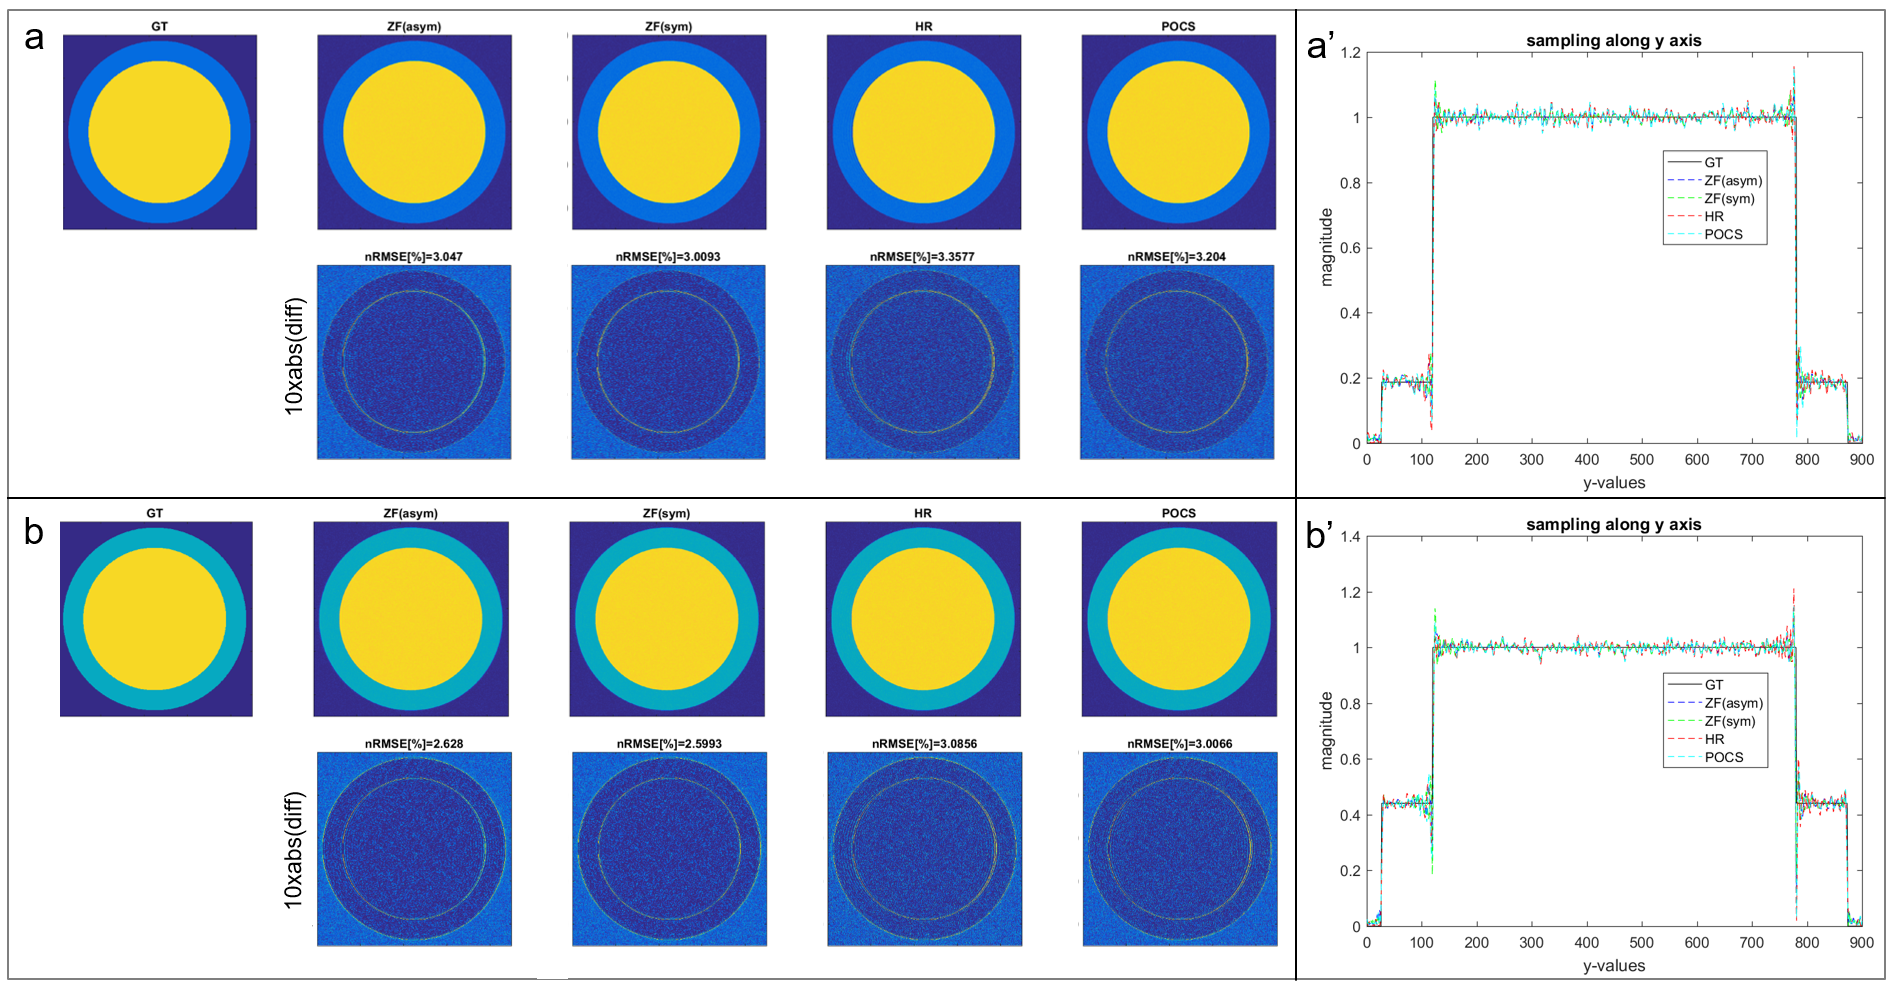
PF sampling was retrospectly applied to model and in-vivo data for different PF factors (0.625 and 0.75) and the reconstruction compared to the fully sampled reference for HR, POCS, symmetrical (ZF(sym)) and asymmetrical (ZF(asym)) zero-filling reconstructions. The normalized root mean square errors (nRMSE) is reported.
Results
An approximately linear dependency between the CA concentration and the net phase shift in the blood pool was measured in-vivo (Figure 1).
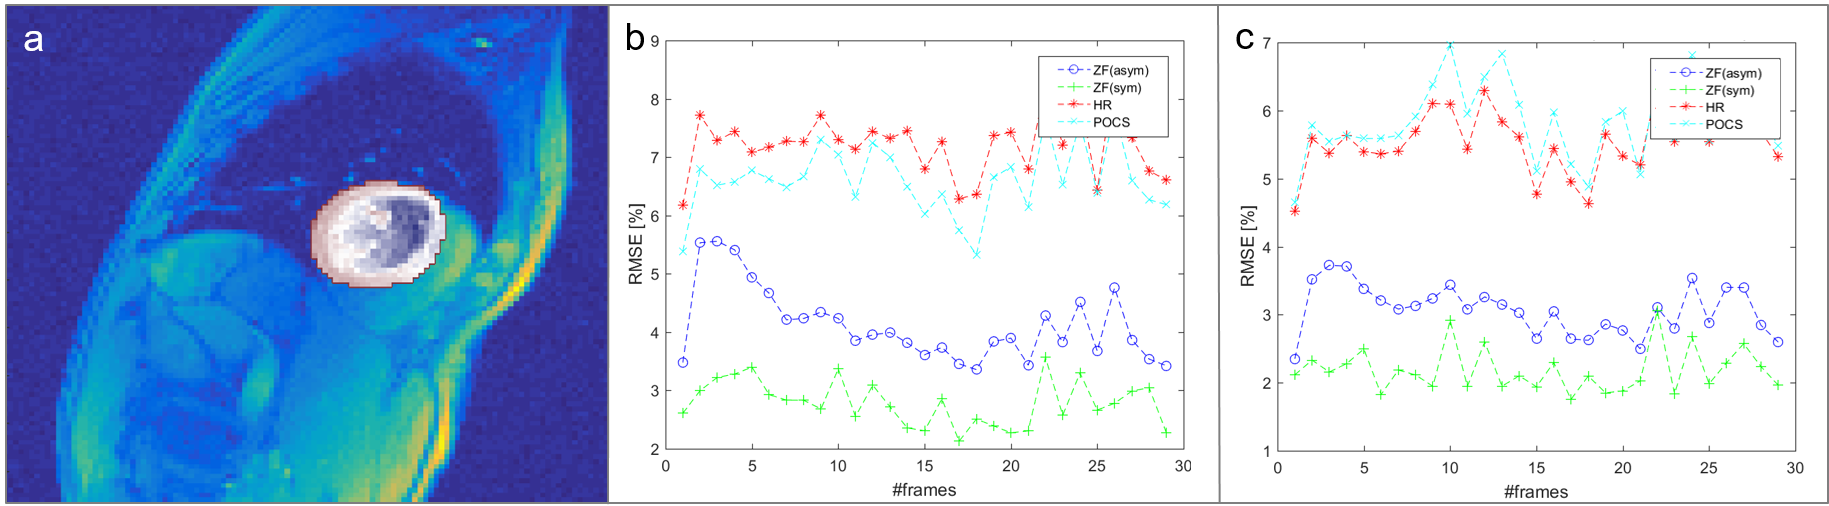
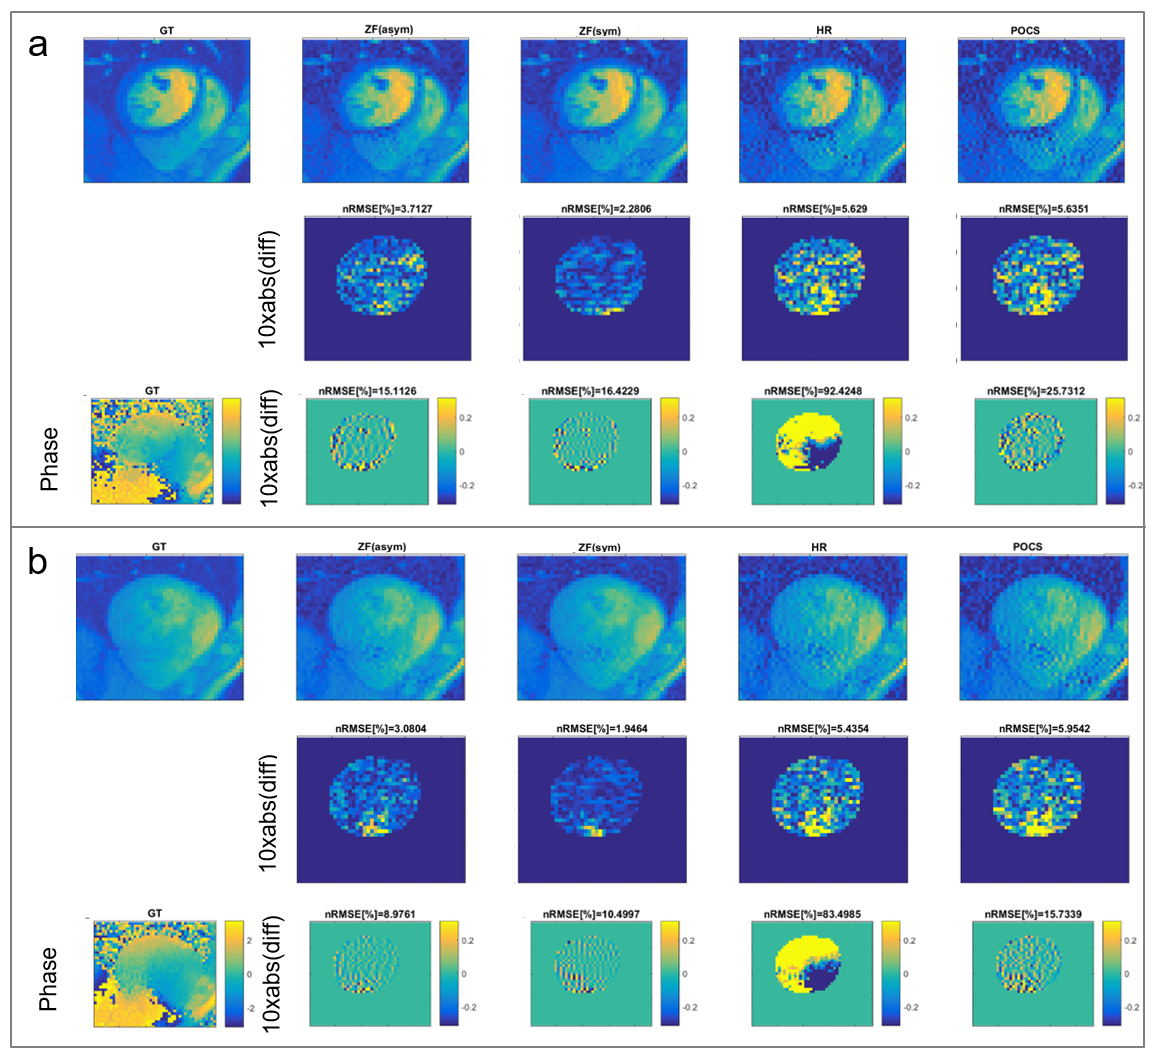
Using the in-vivo phase data as input in the computer model, the performance of ZF(asym), ZF(sym), HR and POCS reconstruction is compared (Figure 2). With increasing phase offsets, HR and POCS lead to an increase in nRMSE. Errors of simulated PF (0.75) reconstructions at peak blood-pool (phase step of 0.81rad) and myocardial enhancement (phase step of 0.67rad) relative to ground truth are shown in Figure 3. Errors of PF reconstructions of in-vivo FPP data relative to the fully sampled reference are summarized in Figure 4. In Figure 5 the corresponding spatial error maps at peak blood-pool and peak myocardial enhancement are shown.
Discussion and Conclusion
CA induced phase variations in DCE MRI are seen to compromise HR and POCS reconstruction of PF data to an extent where they do not convey any benefit over simple zero-filling reconstruction. Since CA induced phase variations scale with CA concentration, PF reconstruction using HR and POCS are particularly problematic at intermediate (0.05 mmol/kg) and high CA dose (0.075 mmol/kg). Accordingly, it is concluded that PF acquisition in DCE Perfusion MRI does not offer a benefit over symmetric k-space sampling with the same number of phase encodes.Acknowledgements
No acknowledgement found.References
[1] M. A. Bernstein, K. F. King, and X. J. Zhou, Handbook of MRI pulse sequences. Elsevier, 2004.
[2] G. McGibney, M. R. Smith, S. T. Nichols, and a Crawley, “Quantitative evaluation of several partial Fourier reconstruction algorithms used in MRI.,” Magn. Reson. Med., vol. 30, no. 1, pp. 51–59, 1993.
[3] D. C. Noll, D. G. Nishimura, and A. Macovski, “Homodyne Detection in Magnetic Resonance Imaging,” IEEE Trans. Med. Imaging, vol. 10, no. 2, pp. 154–163, 1991.
[4] J. Cuppen and A. van Est, “Reducing MR imaging time by one-sided reconstruction,” Magn. Reson. Imaging, vol. 5, no. 6, pp. 526–527, Nov. 1987.
[5] T. Kuestner, C. Wurslin, S. Gatidis, P. Martirosian, K. Nikolaou, N. Schwenzer, F. Schick, B. Yang, and H. Schmidt, “MR image reconstruction using a combination of Compressed Sensing and partial Fourier acquisition: ESPReSSo,” IEEE Trans. Med. Imaging, vol. 62, no. c, pp. 1–1, 2016.
[6] T. E. Conturo, P. B. Barker, V. P. Mathews, L. H. Monsein. R. N. Bryan, MR imaging of cerebral perfusion by phase-angle reconstruction of bolus paramagnetic-induced frequency shifts. Magn. Reson. Med.27, 375-390 (1992).
[7] M. Bydder, D. Robson, “Partial Fourier Partially Parallel Imaging.,” Magn. Reson. Med., vol. 53, pp. 1393–1401, 2005.
[8] E. Akbudak, T. E. Conturo, Theory of phase enhancement contrast agent mechanisms: microscopic effects, “Proc. SMR. 2nd Annual Meeting. San Francisco. 1994.” p. 938.
[9] M. Guerquin-Kern, L. Lejeune, K. P. Pruessmann, M. Unser, Realistic Analytical Phantoms for Parallel Magnetic Resonance Imaging " IEEE Trans. Med. Imaging, vol. 31, no. 3, 2012.
Figures