3515
Radial acquisition and PFT reconstruction allow for retrospective selection of spatial resolution in fMRI studies1Biomedical Engineering, Amirkabir University of Technology (Tehran Polytechnic), Tehran, Iran (Islamic Republic of), 2School of Cognitive Sciences, Institute for Research in Fundamental Sciences (IPM), Tehran, Iran (Islamic Republic of)
Synopsis
Aiming for fine resolution is always a challenging compromise between various parameters. We have investigated a method for retrospective adjustment of resolution in reconstruction step. Our study of fMRI data indicates that an adjustable pixel size is obtainable in a selected central region during the PFT (Polar Fourier Transform) reconstruction of a radially acquired K-space. Preserving the functional sensitivity, this improvement of resolution results in finer activation detection and higher functional CNR.
Introduction
Finding a way to improve the imaging resolution, especially for detecting fine functional structures, where the conventional functional imaging protocols suffer from a coarse resolution, is important. We show that this issue can be resolved for a selected region in the image, using radial sampling of the K-space along with the polar Fourier transform (PFT)1. PFT reconstruction produces the image in the polar coordinates where the pixel size depends on its radial distance from the center of the image. Nevertheless, the visualization of image is only conceivable in Cartesian (X-Y) coordinates and in this grid, we have a fixed pixel size everywhere. In framework transform, we have a wide range of selection for the resolution of the fixed Cartesian grid that helps us to precisely map the small central polar pixels. In this study, we have investigated the robustness of sensitivity in targeted fMRI2 considering the selected resolution.Methods
A functional MRI data has been acquired using the balanced-SSFP sequence with a radial K-space trajectory on 3T Siemens PRISMA scanner from one healthy subject during a visual stimulus (8 Hz blinking checkerboard). Three oblique slices, centered on the occipital lobe (containing Calcarine sulcus) have been imaged and the volume TR is set to 4 seconds. The K-space is sampled with 180 radial spokes and 224 samples per spoke and the raw data is reconstructed using PFT method resulting in a polar image. The framework transform was performed using weighted (corresponding to inverse distance) interpolation of all the data points in polar domain that fall in a neighborhood with a radius of one pixel. Base resolution of the Cartesian grid is chosen similar to the reconstructed images of the scanner, which equals to isotropic in-plane pixel size of 2.7 millimeters and this gridding is performed for four higher resolutions varying with isotropic in-plane pixel sizes of 2.2, 1.7, 1.2 and 0.7 millimeters. Final images were analyzed for activation detection using FSL. Pre-processing steps were performed on each reconstructed fMRI data with the same parameters. These steps include brain extraction, deleting first three volumes of images, high pass filtering, and slice timing correction. The functional contrast to noise ratio (CNR) was also calculated for the 10 percent most active voxels, as the signal change for active blocks, divided to the standard deviation of the rest blocks.Results
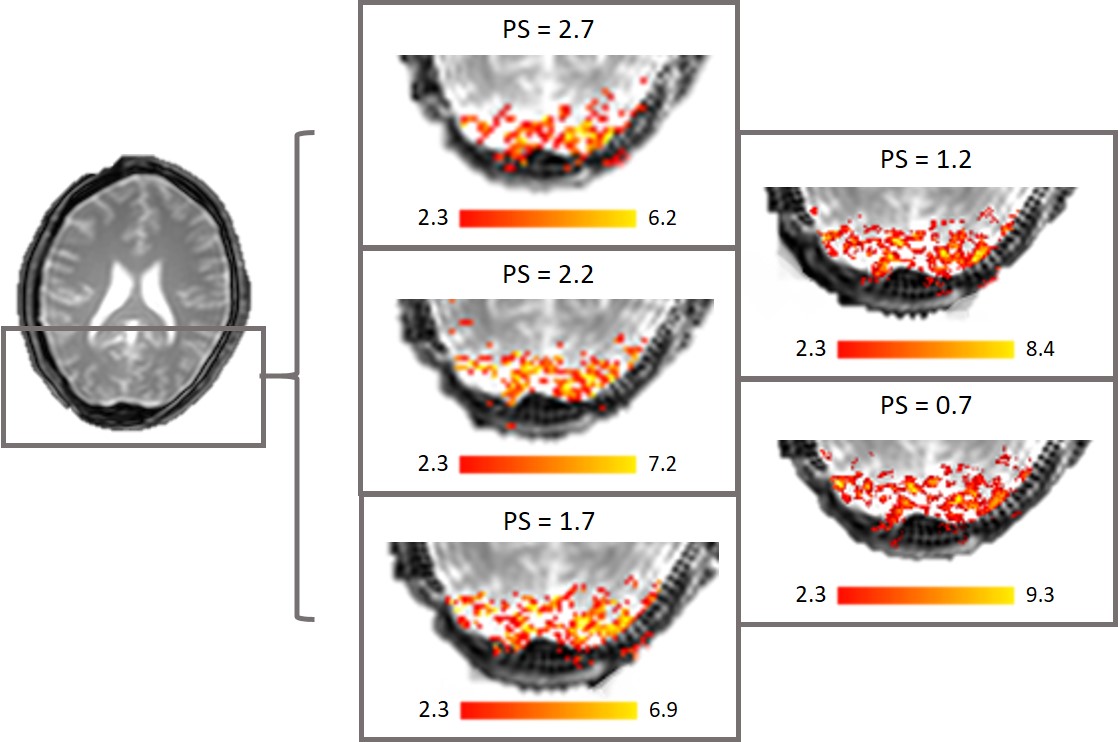
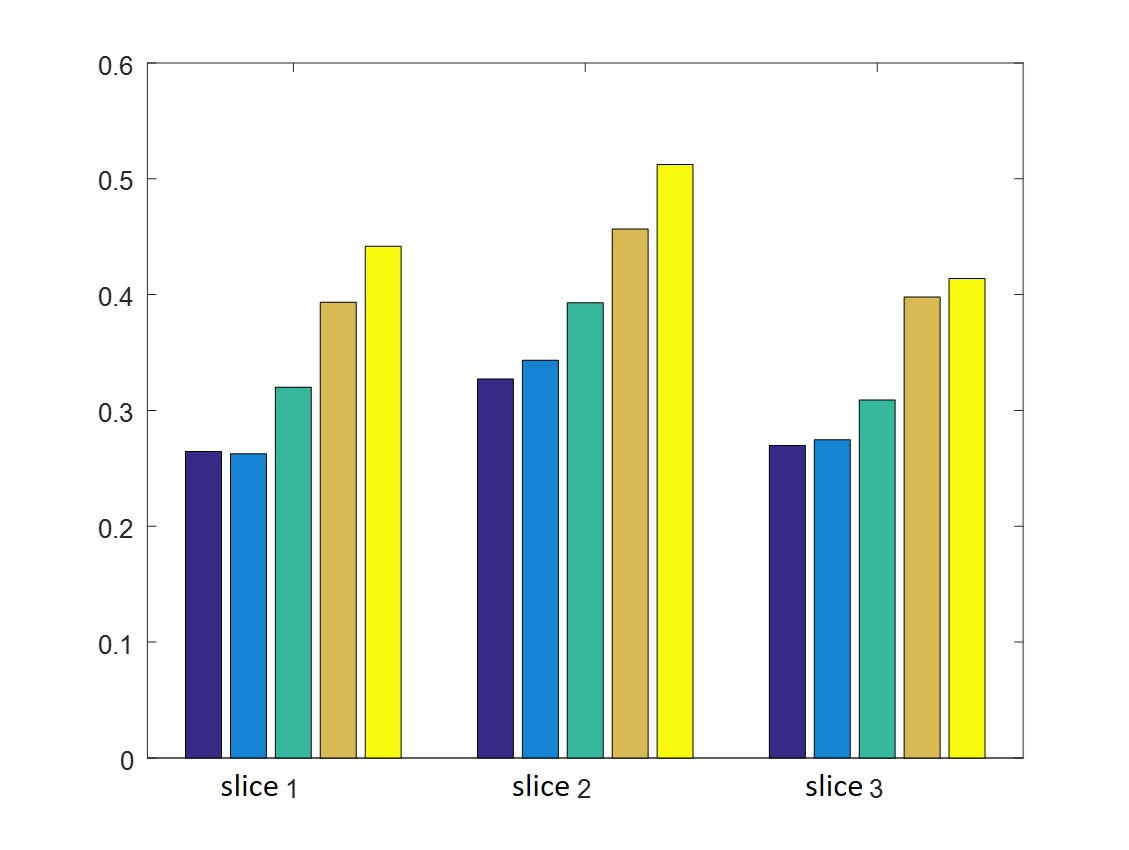
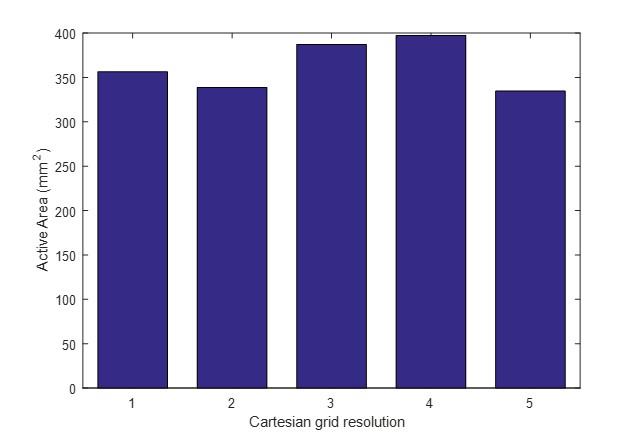
Figure 1 shows thresholded activation maps for one slice of each reconstructed image with a different resolution of the Cartesian grid. The corresponding Z-scores are also depicted below each image. Figure 2 indicates the average CNR values for the most active voxels. The CNR value of different slices is separately compared to their corresponding slices in differently reconstructed images. In figure 3 the total active area (for those voxels that have a Z-score higher than 3) for slices shown in figure 1 is calculated. This area can be a measure of functional sensitivity.Discussion
As it is indicated in figure 1, subsequent resolution adjustment of a selected central area is achievable in the Cartesian grid and it results in smaller voxel sizes. These voxels are detected with high resolution functional activity. Small voxel size corresponds to higher functional contrast that it is ascertainable from the value of Z-scores shown in figure 1 and also, the average CNR values in figure 2. A pattern of increasing CNR can be seen for every corresponding slice of differently reconstructed images, as the pixel size decreases. This pattern is valuable when the functional sensitivity does not have a significant change. Favorably the activation map of our images are approximately similar to each other and as it is shown in figure 3, decreasing the voxel size causes no significant decreasing pattern in the total active area. This shows that our reconstruction method does not adversely affect the functional sensitivity in region of interest and the active voxels can be delicately detected, provided that they are located adjacent to the center of the image.Conclusion
We have shown that common resolution of fMRI applications which is between 2 to 3 millimeter, can be improved and even reach the sub-millimeter level, retrospectively in image reconstruction, provided that radial K-space reading and PFT reconstruction are used. Maintaining the functional sensitivity, this method will result in higher functional CNR and high-resolution activity detection in selected regions of interest which are located in small radii from the center of the image. this method can be promising in better compromise of imaging parameters in fMRI scans, since the resolution can be adjusted to the desired value, after imaging.Acknowledgements
This work has been funded by COGC, Iran, No. 3198 and data was acquired at National Brain mapping laboratory (NBML), Tehran, Iran.References
1. Golshani, S., & Nasiraei‐Moghaddam, A. (2017). Efficient radial tagging CMR exam: A coherent k‐space reading and image reconstruction approach. Magnetic resonance in medicine, 77(4), 1459-1472.
2. Banafshe Shafiei Zargar, Farzaneh Keyvanfard, Abbas Nasiraei Moghaddam, “Targeted fMRI using radial acquisition and polar reconstruction”, ISMRM 25th Scientific Meeting, 2017, Honolulu, USA.
Figures