3503
Fully Convolutional Networks for Automated Segmentation of Abdominal Adipose Tissue Depots in Water-Fat MRI1Department of Radiology, Uppsala University, Uppsala, Sweden, 2BioVenture Hub, Antaros Medical, Mölndal, Sweden
Synopsis
The segmentation and quantification of human adipose tissue depots offers new insights into the development of metabolic and cardiovascular disease but is often hindered by the need for time-consuming and subjective manual input. We propose an automatic method that uses a convolutional neural network for the segmentation of both visceral adipose tissue (VAT) and subcutaneous adipose tissue (SAT). The network was applied to two-dimensional slices of 90 water-fat MRI scans of the abdomen. In a 10-fold cross-validation it reached average dice scores of 0.979 (VAT) and 0.987 (SAT), with average absolute quantification errors of 0.8% (VAT) and 0.5% (SAT).
Purpose
To develop and evaluate an automated method for the semantic segmentation of visceral adipose tissue (VAT) and subcutaneous adipose tissue (SAT) in water-fat MRI of the abdomen.Introduction
The quantification of body fat depots1 with MRI techniques has the potential to allow for accurate volumetric measurements without exposure to ionizing radiation. Chemical-shift encoded water-fat MRI can offer both co-registered water and fat signal images as well as voxel-wise fat fraction values2 for this purpose. A variety of automated and semi-automated methods for VAT and SAT segmentation have been developed with techniques such as ray-tracing3, competitive region growing with identification of narrow passages4, multi-atlas segmentations5 and k-means clustering combined with fitting of three-dimensional surfaces6. The success of deep learning strategies in medical image analysis7 suggests the application of neural networks as a novel alternative for this task.Methods
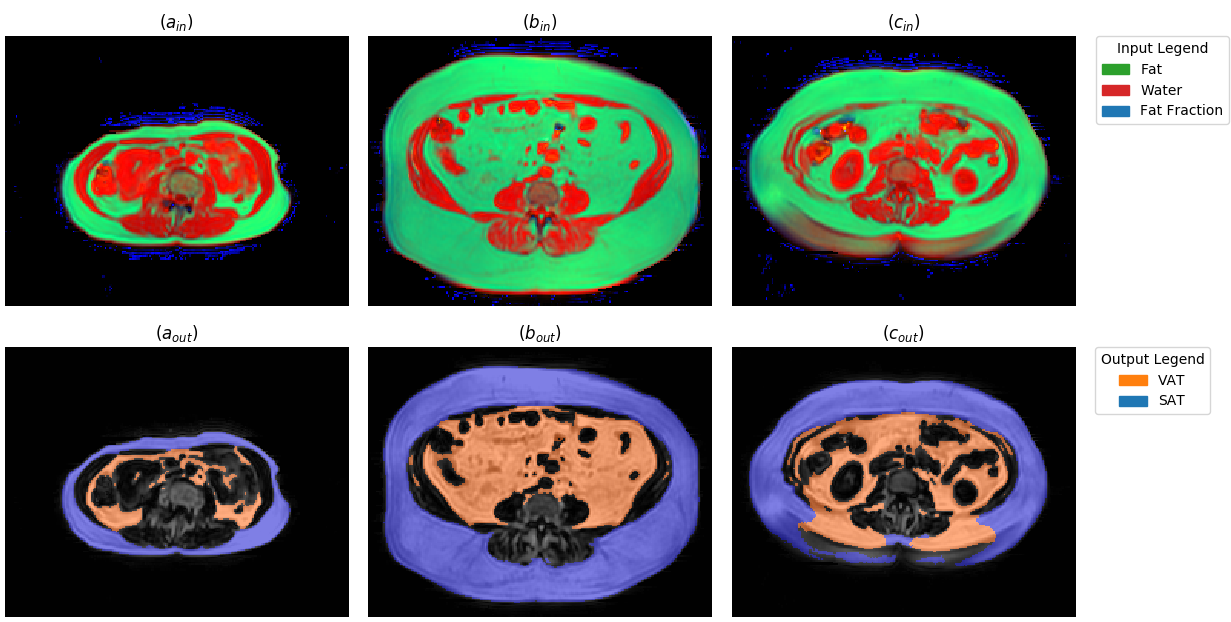
For the creation of ground truth data, water-fat MRI scans of the abdominal region were taken in a cohort of adult male and female subjects, diagnosed with type 2 diabetes, aged 18-80 years, with a body mass index of <= 40kg/m². The images were acquired with the system Achieva dStream, Philips Healthcare, Best, The Netherlands with anterior and posterior coils using the mDixon Quant sequence with TR 5.6ms, TE1 0.95ms, deltaTE 0.7ms, flip 5deg. Among these patients, 45 were selected who participated in two visits, yielding 90 scan volumes with a typical image resolution of [256, 256, 20] voxels of size [2.07, 2.07, 8] mm. These scans were manually segmented, resulting in a total of 1800 transverse slices with label information for VAT and SAT. These slices were then split on the patient level for a 10-fold cross-validation. On these splits a fully convolutional network8 based on the U-Net architecture9 was trained in Caffe10. No tiling strategy was necessary and the depth of the architecture was extended from four to five downsampling steps . Additionally, zero padding of the feature maps was enabled so that the input image and output segmentation have the same two-dimensional extents. Several pre-processing steps were applied to the input data. The arms of the patients were removed from all scans. The contrast of the signal images of the water-fat MRI was then adjusted by clipping the brightest one percent of their histograms and normalizing the remaining intensities. Rather than just using a single two-dimensional grayscale image as input to the network, the water and fat signal images as well as the fat fraction image for a given transverse slice were combined to form the three channels of a color image (Fig 1, top row). Finally, the training data was augmented by three separate random volumetric deformations using the software elastix11.Results
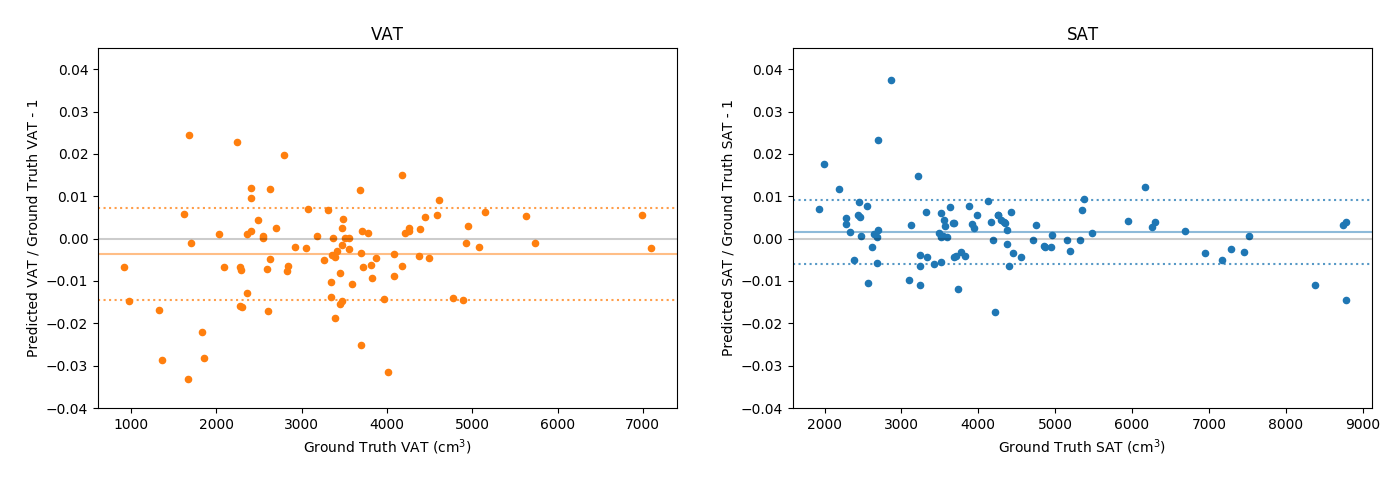
After ten epochs of training the method reached average dice scores of 0.979 (VAT) and 0.987 (SAT). The slices with the lowest, median and highest amount of misclassified voxels can been seen in (Fig 1). The quantification errors (Fig 2) range from absolute percentages of 0.00-3.32% (VAT) and 0.02-3.74% (SAT) of the respective volume. The main effect of the multi-channel input consists in an increase of the VAT dice by more than 0.02 as compared to the best alternative of using the fat signal image only. Training the network for 50000 iterations on an Nvidia GeForce GTX 1080Ti takes slightly less than two hours of calculation time. On the used data, the zero padding of the feature maps was found to cause no penalty in quality while almost halving both the runtime and memory requirements as compared to padding the input images directly.Discussion
Despite the low amount of training data, the network learned to create segmentations that in many cases no longer require any manual corrections. The most commonly observed errors consist of outer VAT being labeled as SAT as well as oversegmentation of bone structures of the spine and hip as VAT, which was not fully resolved by the multi-channel configuration. Once the process of training the network is finished, it can be applied to a new volume within a few seconds when using a graphics card. Future work will consist in testing the network on data obtained from additional studies with different scanning protocols and image contrasts as well as patients with different morphology. The usage of a larger quantity and variety of data in training can be expected to further improve both the robustness of the method and the quality of the results.Acknowledgements
No acknowledgement found.References
1. Hu H H, Chen J, Shen W. Segmentation and quantification of adipose tissue by magnetic resonance imaging. Magnetic Resonance Materials in Physics, Biology and Medicine, 2016;29(2); 259-276.
2. Hu H H, Kan H E. Quantitative proton MR techniques for measuring fat. 2013. NMR in biomedicine, 26(12), 1609-1629.
3. Kullberg J, Hedström A, Brandberg J, et al. Automated analysis of liver fat, muscle and adipose tissue distribution from CT suitable for large-scale studies. 2017. Scientific Reports, 7.
4. Ranefall P, Bidar A W, Hockings P D. Automatic segmentation of intra‐abdominal and subcutaneous adipose tissue in 3D whole mouse MRI. 2009. Journal of Magnetic Resonance Imaging, 30(3), 554-560.
5. Addeman B T, Kutty S, Perkins T G, et al. Validation of volumetric and single‐slice MRI adipose analysis using a novel fully automated segmentation method. 2015. Journal of Magnetic Resonance Imaging, 41(1), 233-241.
6. Shen J, Baum T, Cordes C, et al. Automatic segmentation of abdominal organs and adipose tissue compartments in water-fat MRI: Application to weight-loss in obesity. 2016. European journal of radiology, 85(9), 1613-1621.
7. Shen D, Wu G, Suk H. Deep Learning in Medical Image Analysis. 2017. Annual Review of Biomedical Engineering, 19, 221-248.
8. Long J, Shelhamer E, Darrell T. Fully convolutional networks for semantic segmentation. In Proceedings of the IEEE Conference on Computer Vision and Pattern Recognition. 2015. (pp. 3431-3440).
9. Ronneberger O, Fischer P, Brox T. U-Net: Convolutional Networks for Biomedical Image Segmentation, Medical Image Computing and Computer-Assisted Intervention (MICCAI). 2015. Springer, LNCS, Vol.9351: 234--241.
10. Jia Y, Shelhamer E, Donahue J, et al. Caffe: Convolutional Architecture for Fast Feature Embedding. 2014. arXiv:1408.5093.
11. Klein S, Staring M, Murphy K, Viergever M. A et al. elastix: a toolbox for intensity based medical image registration, IEEE Transactions on Medical Imaging. 2010. vol. 29, no. 1, pp. 196 – 205.
Figures