3499
MR Intensity Normalization: Influence on Supervised Machine Learning Algorithms using Textural and Convolutional Features1Departments of Radiology and Clinical Neuroscience, Hotchkiss Brain Institute, University of Calgary, Calgary, AB, Canada, 2Calgary Image Processing and Analysis Centre, Foothills Medical Centre, Calgary, AB, Canada, 3School of Electrical and Computer Engineering, University of Campinas, Campinas, Brazil
Synopsis
Supervised machine learning techniques have been used in medical imaging and aim to reduce subjectivity and improve quantitative results. When handling heterogeneous MR datasets, most algorithms require pre-processing, such as intensity normalization. Here, the influence of MR normalization techniques on supervised classification is evaluated using handcrafted textural and convolutional features. These features combined can differentiate control subjects from atherosclerosis patients using only imaging scans. Non-significant statistical difference in classification was found across intensity normalization methods, demonstrating little influence of this pre-processing step on the supervised classification outcome.
Introduction
Machine learning (ML) is an area of active exploration in medical imaging, aiding specialists in the diagnosis of clinical conditions.1-3 Modern research trials are producing increasingly large, more heterogeneous datasets, with images acquired from scanners with varying acquisition parameters, protocols, magnetic field strengths and vendors. Robust ML methods that are not influenced by these underlying factors must be developed.4,5
Pre-processing techniques, such as intensity normalization, are often included in the ML methods to help standardize images before feature extraction and classification.6,7 However, the impact of intensity normalization on textural and convolutional features needs to be evaluated. We propose to investigate the influence of intensity normalization methods, specifically on supervised classification algorithms.
Methods
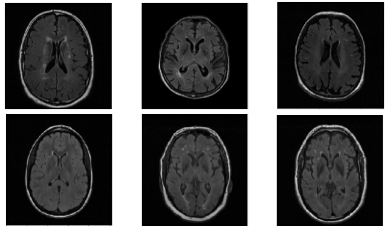
The experimental multicenter dataset consisted of T2-weighted FLAIR brain images from 61 atherosclerosis patients acquired as part of Canadian Atherosclerosis Imaging Network (CAIN)8 and 270 healthy control subjects as part of the ongoing Calgary Normative Study9 (CNS, Figure 3). In the CAIN study, two sites used the same 3-T scanner (Discovery 750, GE Healthcare) with 3mm slice thickness, TR = 9,700 ms, TE =140 ms and TI = 2,200 ms. Images from a third site were acquired using another scanner (Achieva, Philips Medical Systems) with similar acquisition parameters. The CNS was acquired using a 3-T scanner (Discovery 750) as the one of the CAIN sites. Some older normative participants also presented with white matter hyperintensities (WMH), increasing the difficulty of the classification task (Figure 1).
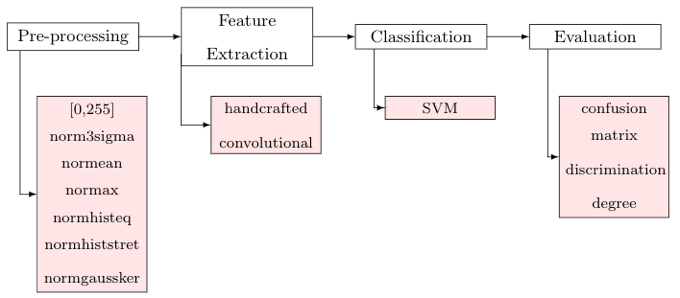
The proposed supervised classification method distinguishes normal subjects from carotid artery atherosclerosis patients using only brain FLAIR MR images. FLAIR images from patients with atherosclerosis have been shown to have WMH relating to carotid plaque.10 Our supervised classification method has four main steps: 1) pre-processing (image normalization), 2) feature extraction (combining handcrafted textural and convolutional features), 3) support vector machine (SVM)11 classification (with parameters automatically selected by grid-search12), and 4) evaluation (confusion matrix and degree of features discrimination13) (Figure 2).
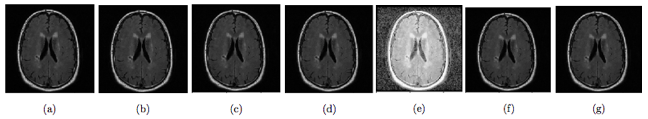
Seven different normalization methods were selected to evaluate their impact on the classification results.14,15 The methods were: 1) Rescaling between the range [0,255]; 2) Rescaling the image into range (μ ± 3σ) where μ is the mean and σ is the standard deviation (norm3sigma); 3) Fixing the mean value to 100 (normean); 4) Fixing the max value to 255 (normax); 5) Equalizing the histogram (normhisteq); 6) Stretching the histogram (or contrast stretching) (normhiststret); and 7) Subtracting the mean value and dividing it by the standard deviation (normgaussker) (Figure 3).
Handcrafted features comprise different texture analysis approaches, such as histogram, gray level and morphological gradients (10 features), local binary pattern (10), and frequency domain methods, such as Haar features (8).16 The convolutional features were computed using a VGG16 network with imagenet weights (25,088 features).17 Experiments were performed by using a 10-fold cross-validation algorithm, and only varying the intensity normalization. One-way analysis of variance (one-way ANOVA) was used to determine statistical significance18.
Results
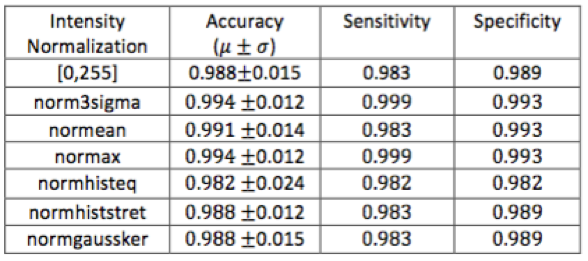
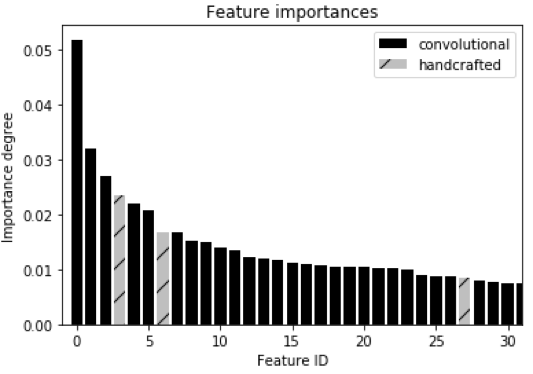
Similar accuracy rates (around 99%) were achieved across the different intensity normalization methods (Table 1). No statistically significant difference was observed (p-value>0.05) among the normalization methods. The feature importance degree was also computed to evaluate which features are most discriminant (Figure 4). The convolutional features were the most discriminating in distinguishing patients with atherosclerosis from normal subjects.Discussion
Intensity normalization on supervised machine learning algorithms did not result in significant differences in the classification results. The use of higher dimension feature spaces, containing scale invariant texture19 and convolutional features made the method sufficiently robust to handle image variability inherent to multicenter heterogeneous datasets. In contrast with previous machine learning methods that have been applied to MR images, 6,7,15,16 complex intensity normalization techniques are not mandatory when using discriminative and robust features. High accuracy verifies the potential of this method in future multicenter studies.Conclusion
Different pre-processing normalization methods were applied in order to analyze their influence on the classification between patients with atherosclerosis and healthy control subjects using handcrafted textural and convolutional features. Comparable classification rates were achieved when varying the intensity normalization method, demonstrating little influence of this pre-processing step on the outcome. We can recommend the application of the intuitive, simplest and least computationally intense intensity normalization method (i.e., normalization between the range [0,255]) without loss of accuracy. In addition, our method achieved high classification accuracy classification despite 1) the use of heterogeneous imaging dataset and 2) the presence of WMH in the healthy control subject group. This finding is likely due to the use of a high dimensional and robust feature space.Acknowledgements
The authors would like to thank Hotchkiss Brain Institute; CAPES process PVE 88881.062158/2014-01; FAPESP processes 2012/21826-1 CEPID2013/07559-3 for providing financial support.References
1. Wardlaw J, Smith E, Biessels G, et al. Neuroimaging standards for research into small vessel disease and its contribution to aging and neurodegeneration. Lancet Neurology 2013; 12:822-838.
2. Leite M, Gobbi D, Frayne R, et al. 3D texture-based classification applied on brain white matter lesions on MR images. Proceedings of SPIE 9785 Medical Imaging, 2016.
3. Calabrese M, Rocca M, Atzori M, et al. Cortical lesions in primary progressive multiple sclerosis: a 2-year longitudinal MR study. Neurology. 2009; 72(15):1330-1336.
4. Souza R, Lucena O, Garrafa J, et al. An open, multi-vendor, multi-field-strength brain MR dataset and analysis of publicly available skull stripping methods agreement. NeuroImage. 2017; In press.
5. Leite M, Rittner L, Appenzeller S, et al. Etiology-based classification of brain white matter hyperintensity on magnetic resonance imaging. Journal of Medical Imaging. 2015; 2(1):014002.
6. Belaroussi B, Milles J, Carme S, et al. Intensity nonuniformity correction in MRI: Existing methods and their validation. Medical Image Analysis. 2006; 10(2): 234-246 .
7. Sled J, Zijdenbos A and Evans A. A nonparametric method for automatic correction of intensity nonuniformity in MRI data. IEEE Transactions on Medical Imaging. 1998; 17(1): 87-97.
8. Tardif J, Spence J, Heinonen T, et al. Atherosclerosis imaging and the canadian atherosclerosis imaging network. The Canadian Journal of Cardiology. 2013; 29 (3):297–303.
9. Tsang A, Lebel C, Bray S, et al. White Matter Structural Connectivity Is Not Correlated to Cortical Resting-State Functional Connectivity over the Healthy Adult Lifespan. Frontiers in Aging Neuroscience. 2017; 9:144.
10. Ammirati E, Moroni F, Magnoni M, et al. Relation between characteristics of carotid atherosclerotic plaques and brain white matter hyperintensities in asymptomatic patients, Scientific Reports. 2017; 7 (10559)1-11.
11. Yichuan T. Deep learning using linear support vector machines. Proceedings of International Conference on Machine Learning, 2013.
12. Bergstra J and Bengio Y. Random search for hyper-parameter optimization, Journal Machine Learning Research. 2012; 13(1): 281-305.
13. Pedregosa F, Varoquaux G, Gramfort A, et al. Scikit-learn: Machine Learning in Python. Journal of Machine Learning Research. 2011; 12: 2825-2830.
14. Collewet G, Strzelecki M and Mariette F. Influence of MRI acquisition protocols and image intensity normalization methods on texture classification. Magnetic Resonance Imaging. 2004; 22(1): 81-91.
15. Loizou C, Pantziaris M, Pattichis C. and Seimenis I. Brain MR image normalization in texture analysis of multiple sclerosis. Journal of Biomedical Graphics and Computing. 2013;3(1):20.
16. Schwartz R, Siqueira F and Pedrini H. Evaluation of feature descriptors for texture classification. Journal of Eletronic Imaging. 2012;21(2):1-17.
17. Shin H, Roth H, Gao M, et al. Deep convolutional neural networks for computer-aided detection: CNN architectures, dataset characteristics and transfer learning. IEEE Transactions on Medical Imaging. 2016; 35(5):1285-1298.
18 Winkler R and Hays W. Statistics: Probability, Inference, and Decision (2nd ed.). New York: Holt, Rinehart and Winston. 1975; p.761.
19. Walt S, Schonberger J, Iglesias J, et al. Scikit-image: Image processing in Python. The Peer Journal of Bioinformatics Software Tools Collection. 2014.
Figures