3497
Classification of Adipose Tissues using Machine Learning1Physics and Astronomy, University of Georgia, Athens, GA, United States, 2Bio-Imaging Research Center, University of Georgia, Athens, GA, United States, 3Biochemistry and Molecular Biology, University of Georgia, Athens, GA, United States
Synopsis
Previous classification techniques for determining the quantification of white adipose tissue and brown adipose tissue have relied on using fat fraction and proton relaxation times using fixed peak spectroscopic models. Machine learning algorithms have proven to be highly accurate for image segmentation but their accuracies rely heavily on input datasets. By using the recently proposed Multi-Varying MR Spectroscopy model an increase in dataset specificity can be applied to each voxel by addition of varying fat peak intensity values. Using this new dataset, four machine learning models were compared.
Introduction
The role of white adipose tissue (WAT) and brown adipose tissue (BAT) in many diseases is well known, therefore the need to accurately classify the volume and distribution of WAT and BAT in the body is clinically useful.1 In recent years, Deep Learning algorithms have proven to be highly successful for image segmentation in MRI. There has been previous work showing success in adipose differentiation using T2, T2* and fat fraction calculations as datasets for various machine learning methods.2,3 However, the success of Deep Learning algorithms rely heavily on the quality of the input dataset, and therefore an increase in the dataset specificity for each voxel should provide an increase in classification accuracy. Two datasets, an Echo dataset and Peak dataset, were created based on the complex echo based signal and a multi-varying peak signal decomposition method respectively.4 The accuracies of four machine learning models were compared to determine the quality of these datasets for fat classification.Data acquisition and Methods
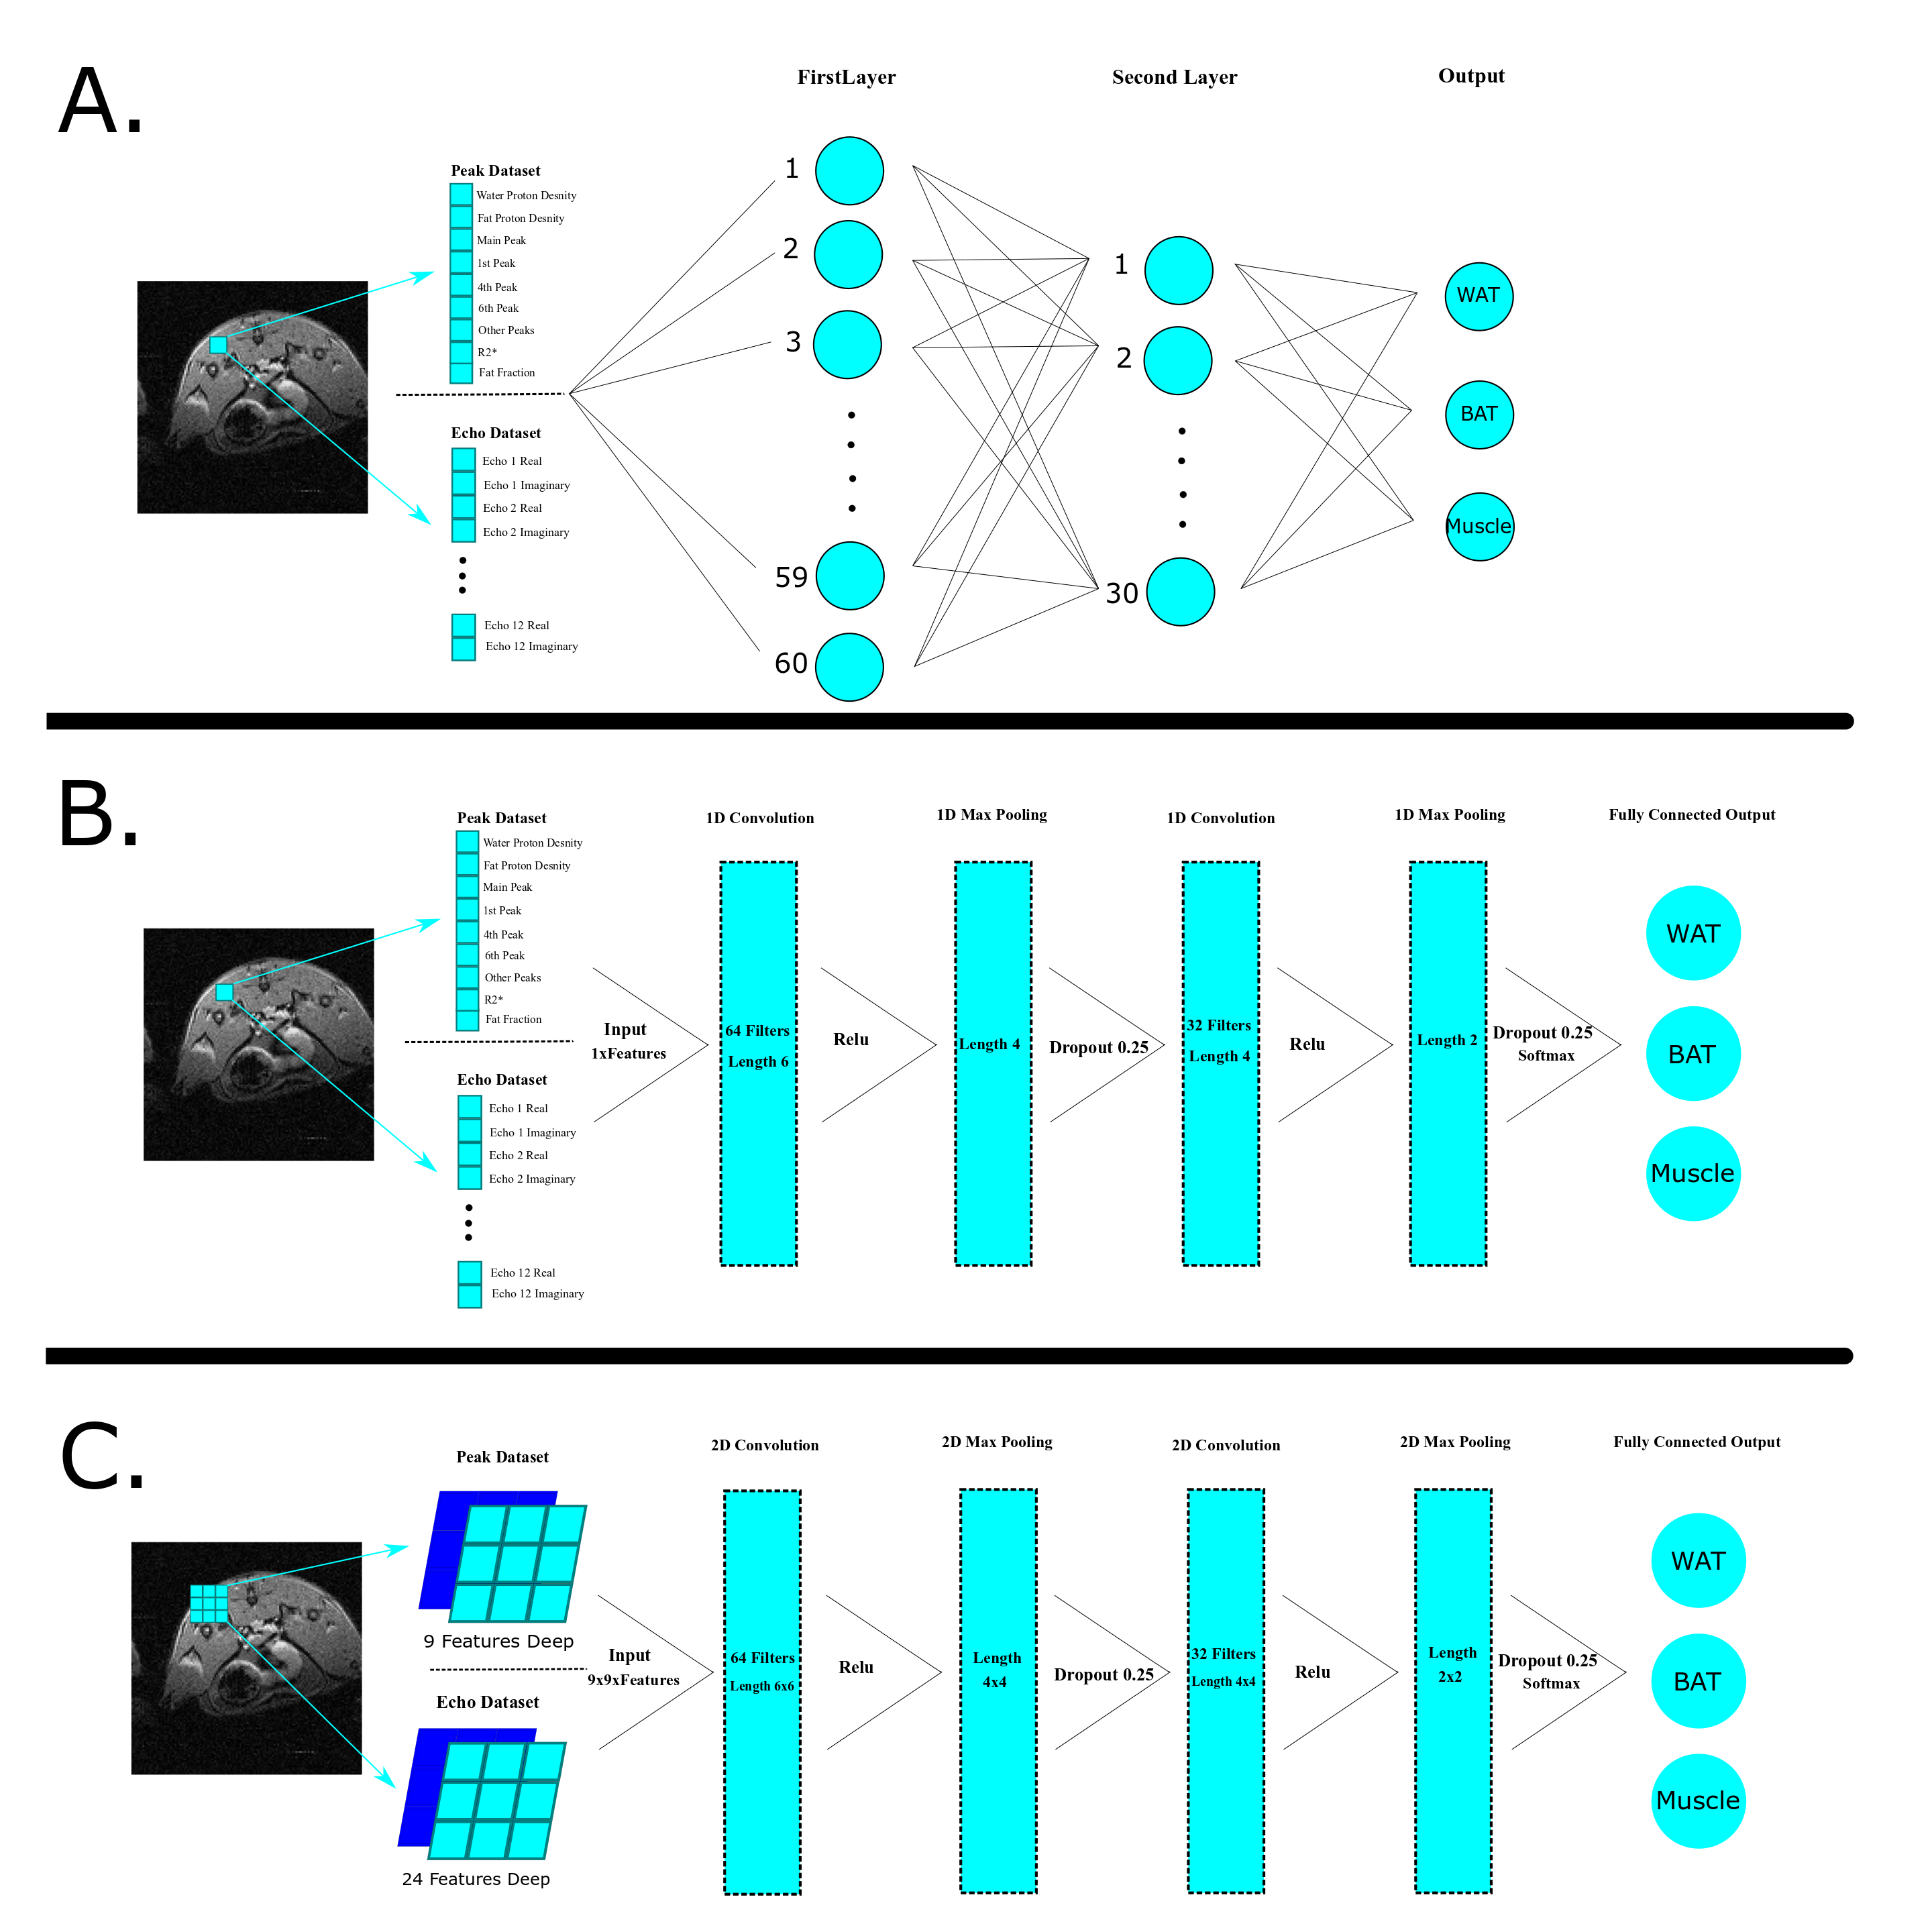
MRI data was acquired from the inter-capsular BAT (iBAT) and inguinal WAT (igWAT) regions of six healthy C57/BL6 mice using a 7T Agilent small animal imaging scanner. A 2D multi-echo gradient-echo sequence was used, consisting of 12 echoes with a spacing of 0.525ms and initial echo at 5.7ms, FOV of 25x25mm and a matrix of 256x256. Labels were applied to the data based on the known locations of BAT, WAT and muscle in the scanned regions for supervised learning. An Echo dataset was created using the complex echo signal from 12 echoes during data acquisition. The real and imaginary components from the data were organized by alternating real and imaginary components for each echo. A Peak dataset consisting of five spectroscopic peaks derived from the previously proposed Multi-Varying-Peak MR Spectroscopy method (MVP-MRS) plus fat fraction and R2* was produced.4 Previous multi-peak methods assume a fixed-peak amplitude for each spectroscopic fat peaks, and therefore the MVP-MRS model allows these spectroscopic peak amplitudes to be included in a feature set for classification.5
Four different supervised machine learning methods were applied to each dataset to compare their accuracies: Support Vector Machine (SVM), Fully-Connected Neural Network (FCNN), One-dimensional Convolutional Neural Network (1D-CNN), and a Two-dimensional Convolutional Neural Network (2D-CNN). Figure 1 shows the architecture of the models. The inputs for each of the methods except the 2D-CNN were flattened arrays of data from each dataset for each voxel. The inputs for the 2D-CNN were extracted from the data via patches of 9x9 voxels. The center voxel from each input corresponded to the label of the patch, therefore allowing segmentation predictions to be made upon this center voxel.
Results and Discussions
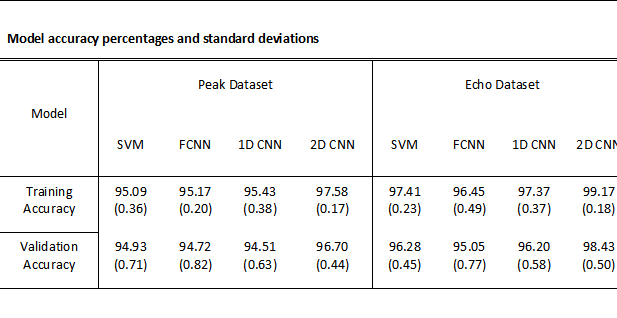
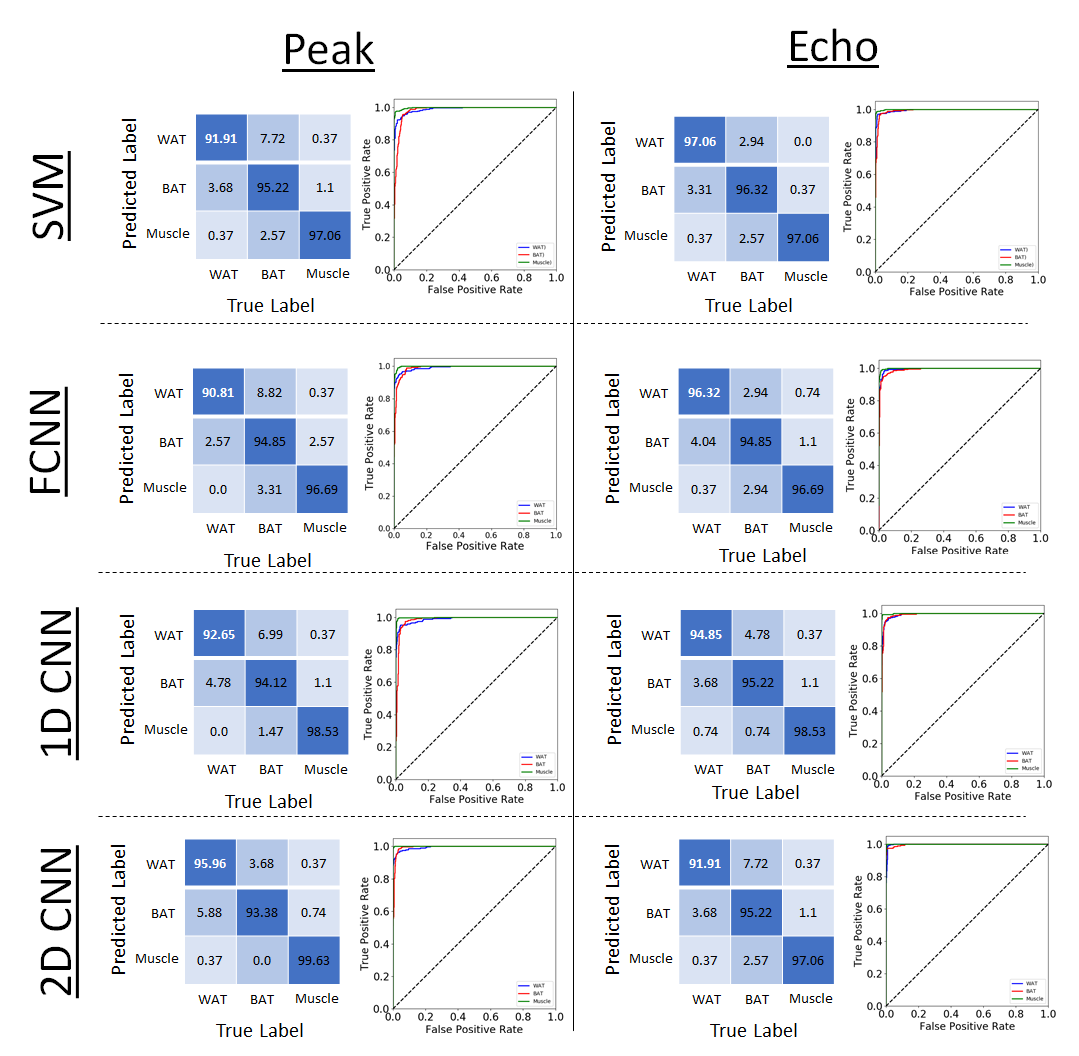
To determine the accuracies of each of the models, ten separate runs were performed for each model and the average value and standard deviation for training and validation accuracies were calculated, Figure 2. Confusion matrices and ROC curves were generated for each of the model’s validation results, Figure 3. The lowest testing and validation accuracies when considering both datasets and every model is the SVM using the Peak dataset with values 95.09% for training and 94.93% for validation respectively. This is an expected result as the SVM is a linear classifier with the least number of parameters determining predictions. The model with the best performance is the 2D-CNN with the Echo dataset (99% and 98%), showing a small improvement over the Peak dataset (97% and 96%). The inclusion of spatial information provided by the 2D-CNN is likely the reason this model shows the best performance.
The confusion matrices and ROC curves in Figure 3 provide extra insight in the classification predictions of each model. The major error in class differentiation comes from the difficulty in separating WAT and BAT. The ROC curves show that in each case, at low confidence values, false negatives for BAT present the biggest problem. This can be seen by the red curve in each ROC plot. The area under this curve tends to be slightly lower in each case compared to the other classes.
Conclusion
Each model presents a considerably high accuracy and could be potentially used to confidently predict quantities of WAT and BAT. However, it is interesting that the Echo dataset is consistently more accurate compared to the Peak dataset. This is possibly due to the increased dimensionality per input for each of the voxels in the dataset. To test the full potential and accuracy of these results, histological results will further confirm the machine learning results.Acknowledgements
No acknowledgement found.References
1. Cypess, A. M. et al. Identification and Importance of Brown Adipose Tissue in Adult Humans. N. Engl. J. Med. 360, 1509–1517 (2009).
2. Bhanu Prakash, K. N. et al. Segmentation and characterization of interscapular brown adipose tissue in rats by multi-parametric magnetic resonance imaging. Magn. Reson. Mater. Physics, Biol. Med. 29, 277–286 (2016).
3. Bhanu Prakash, K. N., Srour, H., Velan, S. S. & Chuang, K.-H. A method for the automatic segmentation of brown adipose tissue. Magn. Reson. Mater. Physics, Biol. Med. 29, 287–299 (2016).
4. Simchick, G., J. Wu, G. Shi, H. Yin, and Q. Z. Characterization of Brown Adipose Tissue using Multi-Varying-Peak MR Spectroscopy (MVP-MRS). in Proceedings of the Annual Conference of International Society of Magnetic Resonance in Medicine 3280 (2016).
5. Zancanaro, C. et al. Magnetic resonance spectroscopy investigations of brown adipose tissue and isolated brown adipocytes. J. Lipid Res. 35, 2191–2199 (1994).
Figures