3496
Estimating Inclusion Stiffness with Artificial Neural Networks in Magnetic Resonance Elastography1Radiology, Mayo Clinic, Rochester, MN, United States
Synopsis
Magnetic Resonance Elastography stiffness estimates in intracranial tumors correlate with intraoperative assessment of tumor consistency, but the spatial kernel-based stiffness calculation of Direct Inversion (DI) creates challenges for small or heterogeneous tumors. The objective of this study is to evaluate an artificial neural network based inversion technique (NNI) in the assessment of small stiff inclusions in a brain phantom. This study shows that NNI can resolve inclusions as small as 1.75cm in diameter with a contrast to noise ratio higher than that of DI. Furthermore, preliminary clinical results show agreement with intraoperative findings.
Introduction
Magnetic Resonance Elastography (MRE) is an MRI-based technique for noninvasive assessment of tissue stiffness1. When intracranial tumors are resected, tumor stiffness is an important determinate of surgical difficulty and preoperative knowledge of tumor consistency may have implications on the chosen surgical approach. Two studies have shown MRE tumor stiffness values correlate with intraoperative surgical assessments of meningioma consistency, but the spatial kernel-based nature of stiffness calculation in MRE creates challenges in spatial resolution for small or heterogeneous tumors2,3. The objective of this study was to evaluate the capabilities of a recently-developed neural network-based inversion (NNI)4 to aid the assessment of small stiff inclusions within a brain phantom.Methods
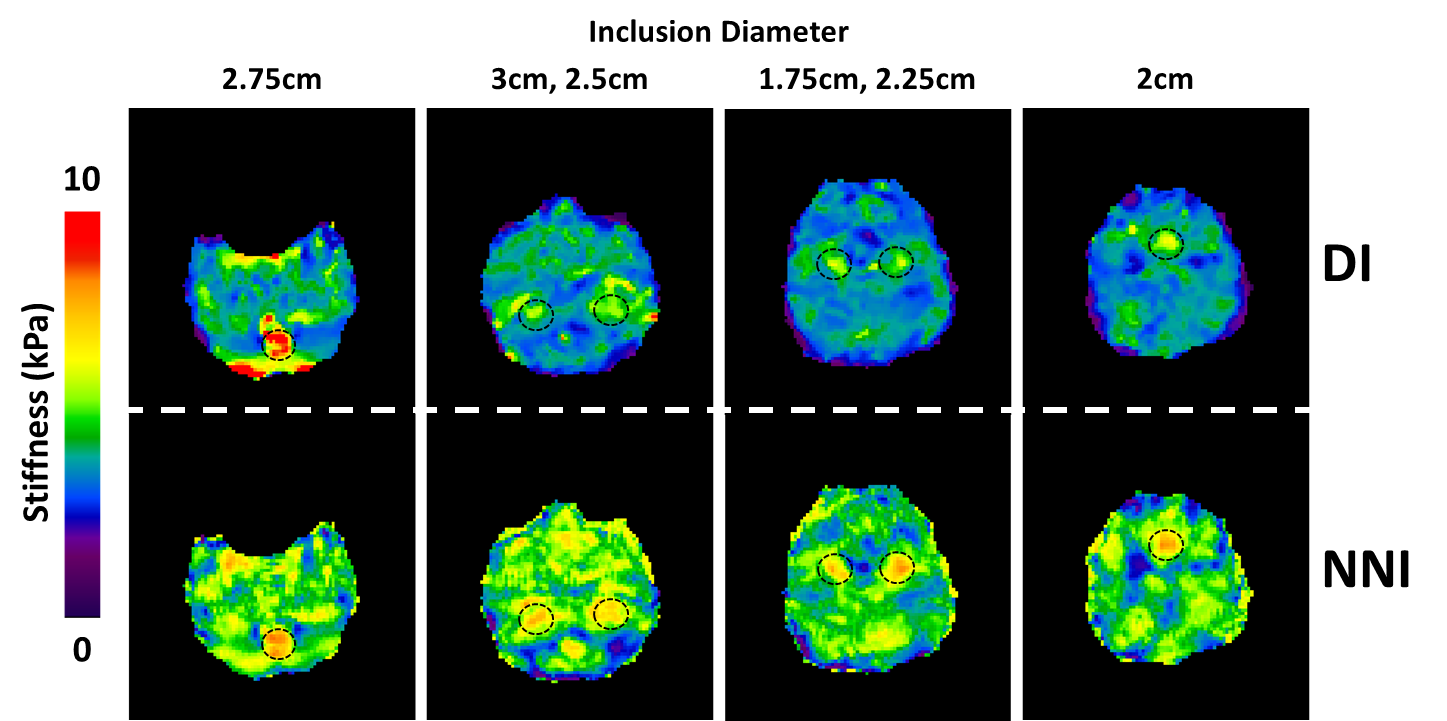
Image acquisition. MRE was performed on a polyvinyl chloride (PVC) brain phantom with background stiffness of ~3.5kPa (at 60Hz) embedded with 6 spherical inclusions (~7.0kPa at 60Hz) ranging in size from 1.75-3cm at driver power levels of 3, 5, and 7 percent. Two scans were completed at each power level. Scanning was performed on a compact 3T system with a high performance gradient capable of 80 mT/m amplitude and 700 T/m/s5-7 slew rate using a modified 3D GRE pulse sequence with parameters as follows: 7.2 mT/m motion encoding gradients (MEG), mechanical vibration=60Hz, TE=20.4ms, TR=24.1ms, first-moment nulled MEG, motion encoding sensitivity (MENC) = 7.1 μm/rad, BW = ±25kHz, FOV = 240x240x192mm3, acquisition matrix= 120x120x96, resolution = 2x2x2mm3, flip angle = 12°, 2D ARC reduction=2, 8 channel receiver array (Invivo, Gainesville Fl), scan time = 12:25. One patient with a meningioma (recruited under an IRB-approved protocol) was imaged using the same scan parameters.
Data analysis. After computing the curl of the displacement field, smoothing was performed with a 3x3x3 quartic filter8 and stiffness was estimated by algebraic direct inversion (DI)9. A 3x3x3 median filter was applied to these stiffness maps to remove outliers. To train the neural network, 1.2 million 7x7x7 simulated data sets were generated with 2-mm isotropic voxels and 4 phase offsets evenly distributed over one period of 60Hz motion. The stiffness of each cube varied randomly between 0.1 and 10 kPa. Sinusoidal waves of the appropriate wavelength were computed from up to 10 point-sources outside of the cube. Noise was added such that the signal to noise ratio varied from 1 to 20 for each example. Model features were the real and imaginary parts of the first harmonic of the curled data selected from a structural element with the same spatial footprint as DI prior to median filtering. An artificial neural network consisting of 3 hidden layers with 24 nodes in each and hyperbolic tangent transfer functions was trained using scaled conjugate gradient backpropagation10 on 1 million of the simulated datasets, the rest being used for validation. To prevent overfitting, training was stopped when mean-squared error failed to improve in six consecutive iterations in the validation set. When applying NNI to image data, the same features as above for each curl component were fed to NNI, and the final stiffness map (elastogram) was generated as the weighted sum of squares of these images. Contrast to noise ratio was defined as11:
$$CNR=\sqrt{\frac{2 (median_{inclusion} - median_{background})^2}{({σ_{inclusion}}^2+{σ_{background}}^2 )}}$$
For NNI the statistics were calculated directly from the elastogram. For DI, the median and standard deviation were calculated from the filtered map.
Results
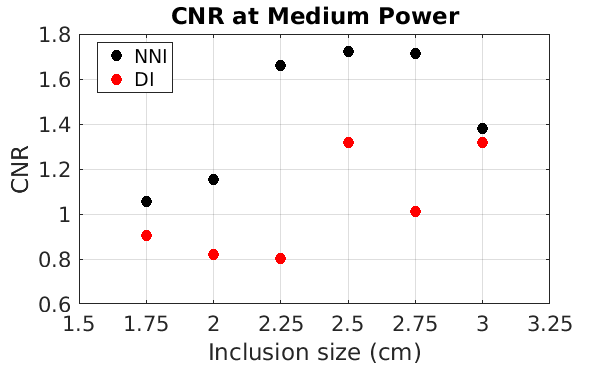
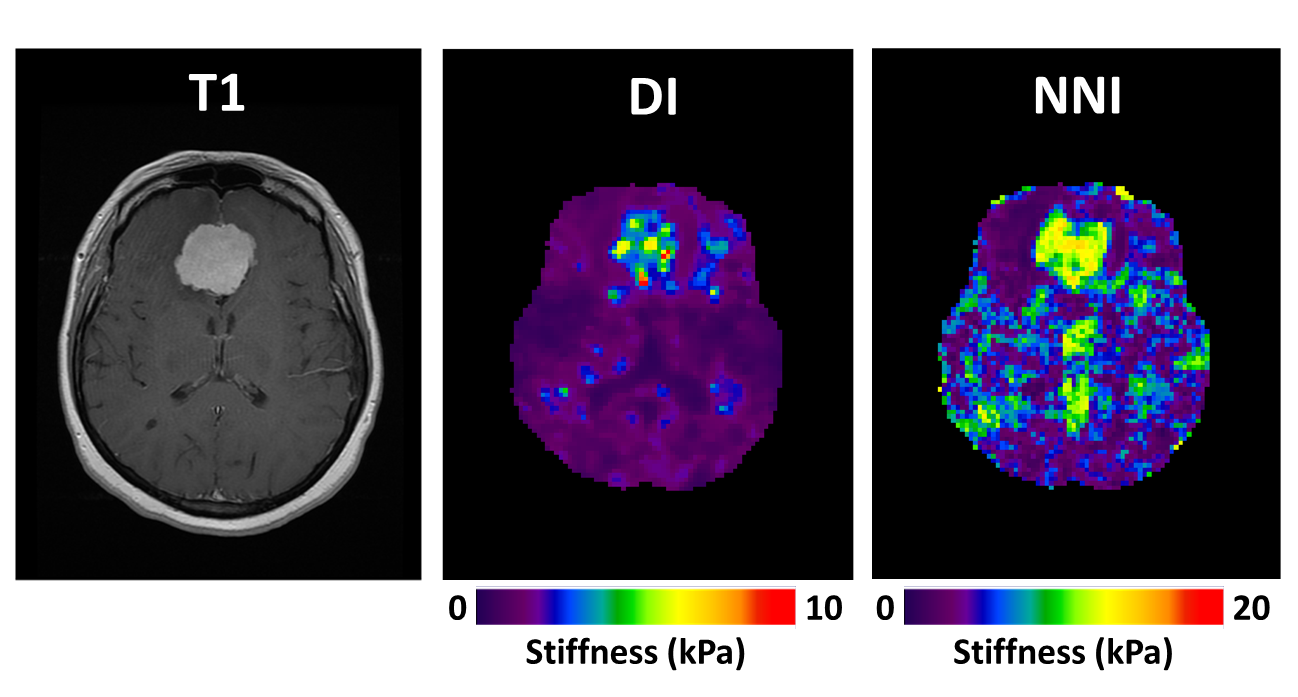
Elastograms of the PVC phantom with inclusions as generated by DI and NNI are shown in Figure 1. All six inclusions in the phantom could be visualized with both inversions. Stiffness estimates from DI were globally lower than for NNI. CNR for the first run of the middle power level is shown in Figure 2. Results were similar for all runs of all power levels. NNI provided higher CNR in 18/18 possible combinations of driver power and inclusion size. Figure 3 shows NNI and DI elastograms in a patient with a meningioma. At resection, this tumor was found to be very stiff and fibrous. The NNI elastogram of this tumor better demonstrates the margins and high level of stiffness than the DI elastogram and provided a better match to intraoperative findings.Conclusions
This study shows that artificial neural networks provide a promising alternative inversion method for MRE. While both NNI and DI were able to resolve inclusions as small as 1.75 cm in diameter, NNI provided higher CNR in 18/18 combinations of inclusion size and driver power level. Preliminary clinical results in using this inversion to assess focal brain lesions are promising.Acknowledgements
This research was supported by National Institutes of Health R01 grant EB001981 (R.L.E).References
1. Muthupillai R, Lomas DJ, Rossman PJ, et al. Magnetic resonance elastography by direct visualization of propagating acoustic strain waves. Science 1995; 269(5232): 1854-1857. 2. Murphy MC, Huston J, Glaser KJ, et al. Preoperative assessment of meningioma stiffness using magnetic resonance elastography. J Neurosurg 2013; 118(3): 643-648. 3. Hughes JD, Fattahi N, Van Gompel J, et al. Higher-Resolution Magnetic Resonance Elastography in Meningiomas to Determine Intratumoral Consistency. Neurosurgery 2015; 77(4): 653-658. 4. Murphy MC, Trzasko JD, Manduca A, et al. Artificial neural networks for stiffness estimation in magnetic resonance elastography. Magnetic Resonance in Medicine. In press. 5. Lee SK, Mathieu JB, Graziani D, et al. Peripheral nerve stimulation characteristics of an asymmetric head-only gradient coil compatible with a high-channel-count receiver array. Magnetic Resonance in Medicine 2016; 76(6):1939-1950. 6. Mathieu JB, Lee SK, Graziani D, et al. Development of a Dedicated Asymmetric Head-only Gradient Coil for High-Performance Brain Imaging with a High PNS Threshold. Proceedings of the ISMRM Annual Meeting, Toronto: 2015, p. 1019. 7. Weavers PT, Shu Y, Tao S, et al. Technical Note: Compact three-tesla magnetic resonance imager with high-performance gradients passes ACR image quality and acoustic noise tests. Medical Physics 2016; 43(3):1259–64. 8. Romano A J, Bucaro JA, Ehman RL, et al. Evaluation of a material parameter extraction algorithm using MRI-based displacement measurements. IEEE Trans Ultrason Ferroelectr Freq Control 2000; 47(6): 1575-81. 9. Oliphant TE, Manduca A, Ehman RL, et al. Complex-valued stiffness reconstruction for magnetic resonance elastography by algebraic inversion of the differential equation. Magnetic Resonance in Medicine 2001; 45(2): 229-310. 10. Møller MF. A scaled conjugate gradient algorithm for fast supervised learning. Neural Networks 1993; 6(4): 525-533. 11. Doyley MM, Weaver JB, Van Houten EE, et al. Thresholds for detecting and characterizing focal lesions using steady-state MR elastography. Medical Physics 2003; 30(4): 495-504Figures