3495
3D Texture Analysis on fMRI to Detect Alterations in the Striatal Network of an Alcohol-Preferring Rat Model1Center for Biomaterials and Tissue Engineering, Universitat Politècnica de València, Valencia, Spain, 2School of Pharmacy, University of Camerino, Camerino, Italy, 3Instituto de Neurociencias, Consejo Superior de Investigaciones Científicas - Universidad Miguel Hernández, Sant Joan d' Alacant, Spain
Synopsis
We propose an approach that uses 3D texture features extracted from fMRI to detect changes in the striatal network induced by alcohol drinking. Scans of eighteen alcohol-preferring rats before and after 30 days of alcohol consumption were analyzed. Data were preprocessed and a group independent component analysis was performed to identify striatal network; in total 36 volumes of interest were studied. Texture analysis was performed using 43 texture features and six predictive models. An AUC of 0.927±0.089 (sensitivity=84.25%, specificity=81.75%) was obtained for the best model (random forests). The proposed method was able to accurately identify subjects with alcohol use disorders.
Introduction
Alcohol use disorders (AUD) are a mental health condition related to both alcohol abuse and alcohol dependence. Its high prevalence makes necessary a better understanding of the effects of alcohol to improve diagnosis and treatment. There is evidence from neuroimaging studies that the effects of AUD are associated with abnormalities in brain networks, both functional and structural. In this study, the main objective was to detect changes in the striatal network according to textural alterations caused by excessive alcohol consumption. For this purpose, we have developed a classification model able to identify subjects with AUD using 3D texture features extracted from functional MRI.Materials and Methods
A longitudinal study was performed using eighteen Marchigian-Sardinian rats, a rat line with a high ethanol preference. T2*-weighted resting-state fMRI and T2-weighted anatomic images were acquired before and after 1 month of 5-6 g/Kg/day of alcohol consumption (control and alcohol conditions).
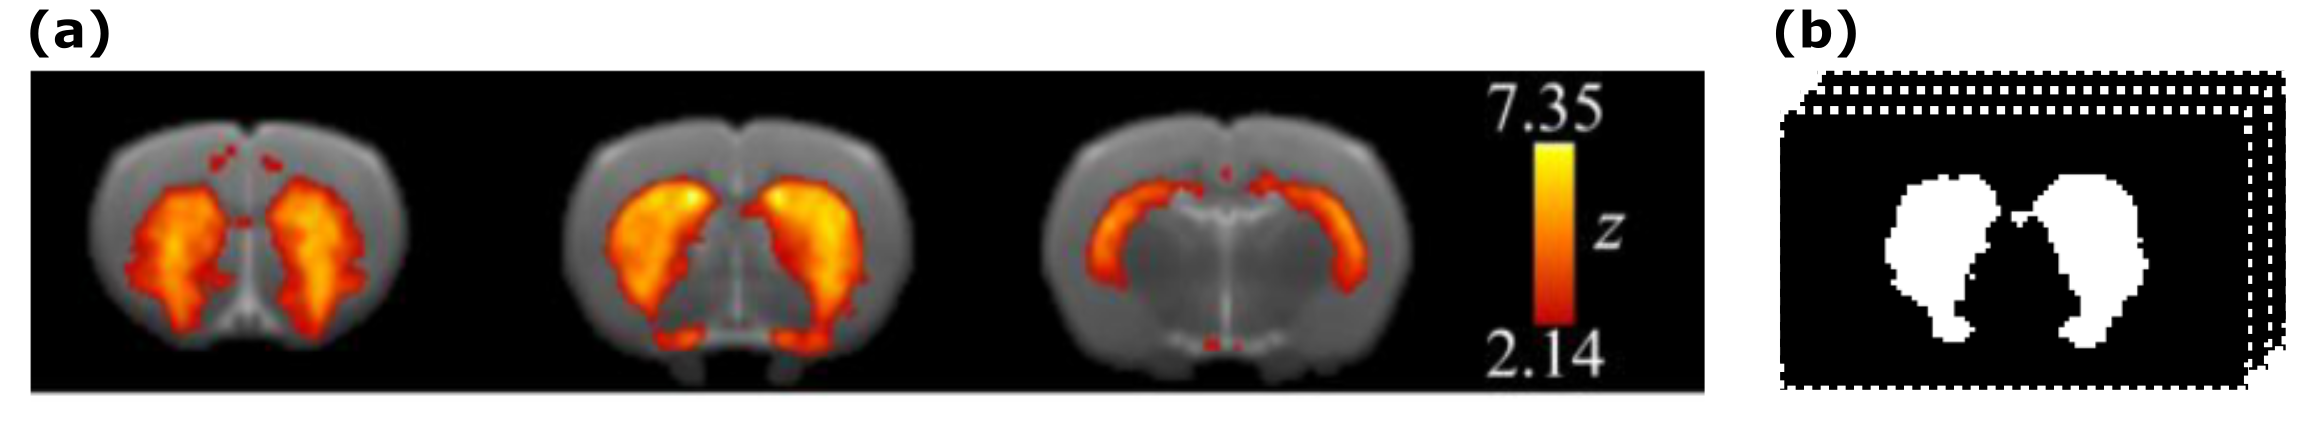
Prior to extracting the volumes of interest (VOIs), the rs-fMRI data were preprocessed. Firstly, the middle volume was used as a reference for head motion correction and brain segmentation. Secondly, the transformation matrices necessary to register the functional images to a rat brain template were obtained. Afterwards spatial smoothing was applied followed by a global 4D mean-based intensity normalization. Twelve motion parameters and motion outliers were regressed out and a Gaussian band-pass filter was applied (0.01-01 Hz). Finally, using the transformation matrices, the filtered functional images were co-registered to the brain-extracted T2-weighted anatomical images and then normalized to the rat template (resolution = 0.193 × 0.193 × 0.8 mm3)1. The preprocessed data were used to perform a group independent component analysis considering both, control and alcohol conditions. Several independent components were obtained and nine of them were identified as resting-state networks2. Binary mask of the striatal network was selected as VOI to perform the texture analysis as it is one of the brain networks most affected by AUD condition2,3 (Fig. 1). Therefore, texture features were computed using the first volume of the normalized data corresponding to the striatal network of each of the 18 rats in each condition (36 VOIs in all).
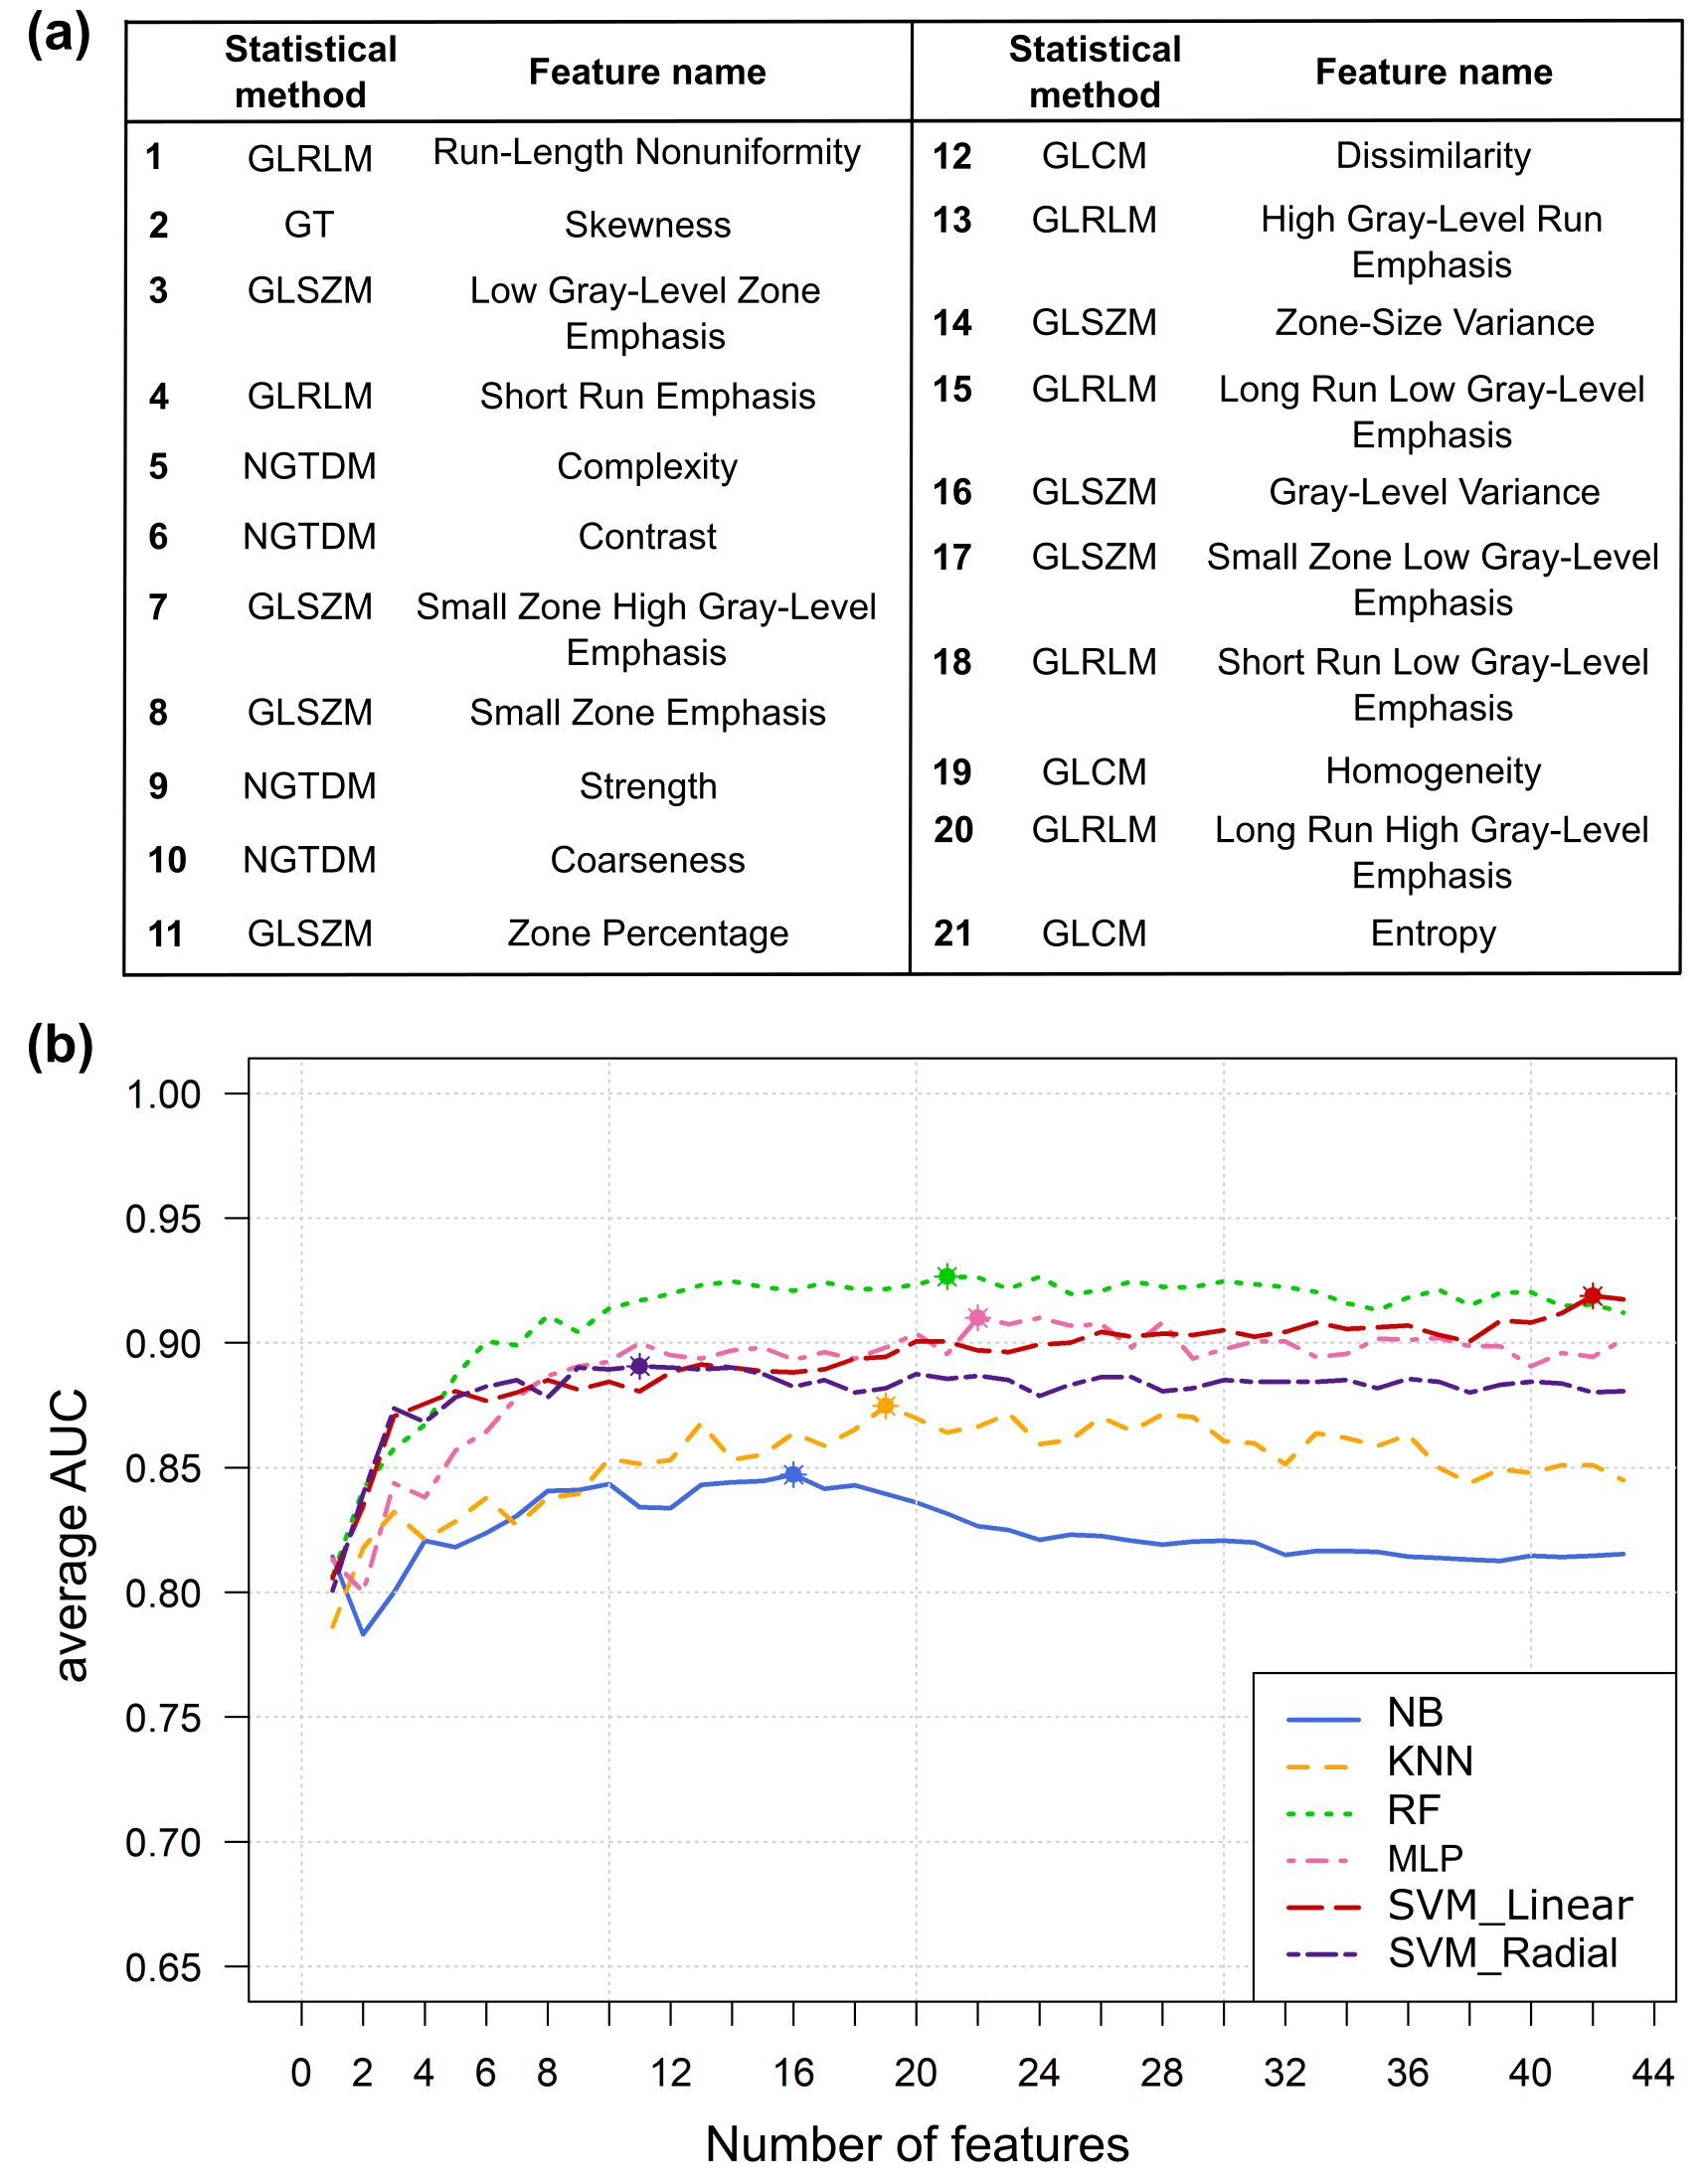
Ahead of feature extraction, all volumes to be analysed were preprocessed to minimize the effects of acquisition protocols: (i) volumes were resampled to the in-plane resolution. (ii) Image intensities were normalized between the range μ ± 3σ, being μ and σ the mean value and the standard deviation of the gray-levels inside each VOI, respectively. (iii) The range obtained was then quantized to a smaller number of gray-levels (16, 32, 64 and 128)4. Afterwards, 43 rotation-invariant standardized texture features were computed for each VOI based on five statistical methods5.
Six predictive models were built and compared: naïve Bayes (NB), k-nearest neighbours (KNN), random forests (RF), multilayer perceptron (MLP) and support vector machine (SVM) with linear and radial kernels. Each model was evaluated using a leave-group-out test, so datasets were randomly split into training (75%) and testing (25%) a total of 100 times, forming in this way 100 different groups. Training set in each group was used to build the model. During this process, a feature selection step was performed to obtain a ranking with the most discriminative features. In this case, a technique based on linear SVM and recursive feature elimination (RFE) was applied. Test set in each group was used to evaluate the classifier performance. Final results were provided averaging the area under the ROC curve (AUC) over all groups, considering all possible feature subsets. Optimal mean specificity and sensitivity were also computed.
Results
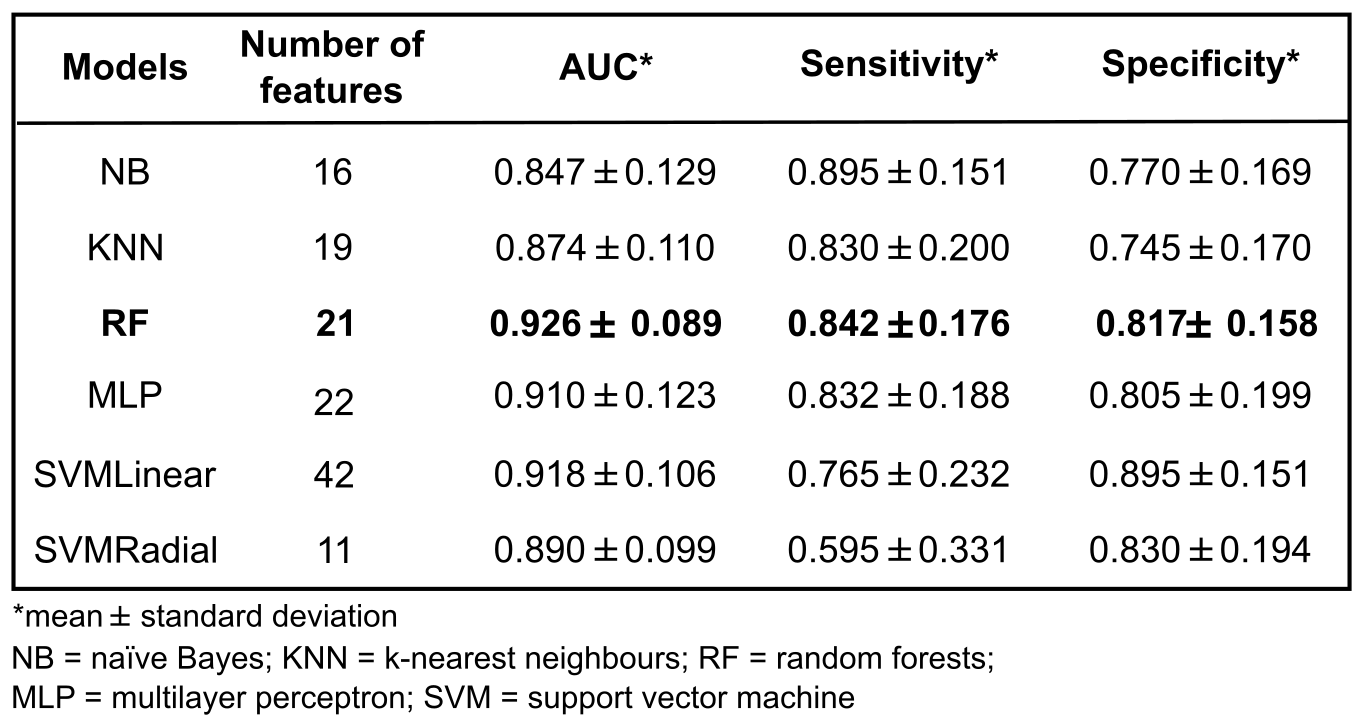
The best results were obtained using 32 gray-levels for all predictive models. For this number of gray-levels, highest classification accuracy (AUC>0.92) was achieved using the random forests model with a subset of 21 features (Fig. 2). Nevertheless, good results were obtained for the six models, performance measures are described in Fig. 3.
Discussion and Conclusion
The number of gray-levels used had significant influence on the classification. Optimization of this value is important since changing the number of gray-levels modifies the signal-to-noise ratio, which affects the texture computation4. Another key aspect to build a robust predictive model is to find the proper subset of features and it has been proven that the technique used (SVM-RFE) is a powerful approach to achieve this goal6. In conclusion, the results reveal that it is possible to differentiate between control and alcohol conditions with high accuracy using texture analysis and a RF model on fMRI. The results also show the ability of the approach to detect changes in the striatal network identifying in this way subjects with AUD.Acknowledgements
The authors thank the financial support of the Spanish Ministerio de Economía y Competitividad (MINECO) and FEDER funds under Grant BFU2015-64380-C2-2-R. R.O.-R. is funded by the Conselleria d’Educació, Cultura i Esport of the Generalitat Valenciana under grant ACIF/2015/078. A.D.-P. is funded by the Spanish Ministerio de Educación, Cultura y Deporte under grant FPU13/01475. U.P.-R. is funded by the Spanish Ministerio de Educación, Cultura y Deporte under grant FPU13/03537.References
1. Schwarz A. J., et al. A stereotaxic MRI template set for the rat brain with tissue class distribution maps and co-registered anatomical atlas: application to pharmacological MRI. Neuroimage. 2006; 32(2); 538–550.
2. Pérez-Ramírez U., et al. Brain functional connectivity alterations in a rat model of excessive alcohol drinking: A Resting-State Network Analysis. Conf. Proc. IEEE Eng. Med. Biol. Soc. (EMBC). 2017; 3016-3019.
3. Ortiz-Ramón R., et al. Evaluation of texture features on resting-state networks of a rat model of alcohol use disorders. Magn. Reson. Mater. Phy. 2017; 30(1), 623.
4. Gibbs P., et al. Textural analysis of contrast-enhanced MR images of the breast. Magn. Reson. Med. 2003; 50; 92-98.
5. Vallières M., et al. A radiomics model from joint FDG-PET and MRI texture features for the prediction of lung metastases in soft-tissue sarcomas of the extremities. Phys. Med. Biol.2015; 60; 5471–96.
6. Fernandez-Lozano C., et al. Texture classification using feature selection and kernel-based techniques. Soft Comput. 2015. 19(9); 2469–2480.
Figures