3488
Explanatory Auxiliary Generative Adversarial Network for Prostate Cancer Lesion Awareness with Very-Weak Supervision1Radiology Department, University of California, Los Angeles, Los Angeles, CA, United States, 2Computer Science, University of California, Los Angeles, Los Angeles, CA, United States
Synopsis
Although supervised deep convolutional neural network has shown good performance regarding lesion detection and classification using multi-parametric MRI, it is still limited by high data label requirement. In this work, we proposed a model called explanatory auxiliary generative adversarial network (ExpA-GAN), which generates heatmap for object detection under very-weak supervision (no ground truth location). The model was trained and evaluated in a public TCIA prostate dataset. Among 50 testing slices enclosing the whole prostate, the proposed model achieves 0.169 normalized distance for lesion detection, showing the potential to improve lesion detection using limited labeled data.
Introduction
In recent years, many studies demonstrated the feasibilities of using deep convolutional neural networks (CNN) with multi-parametric MRI (mp-MRI) for prostate cancer detection and grading. CNN typically extracts useful features from mp-MRI to build a detector or classifier, but many fully-supervised CNN approaches may not be suitable for practical solutions in medical imaging due to possible overfitting issues, particularly when using limited but biased data as a strong supervision. In this work, we propose to apply a very-weak supervision for prostate lesion detection using our novel explanatory auxiliary generative adversarial network (ExpA-GAN). For each training sample, only the existence of a lesion is provided to ExpA-GAN, and a heat map, generated by ExpA-GAN, is used to estimate the level of lesion awareness of the entire prostate. Our very-weak supervision approach can be robust to potential data bias and overfitting because of the nature of the very-weak supervision to the generative model and can be a proper solution for prostate cancer detection with mp-MRI.
Methods
A publicly available dataset from The Cancer Imaging Archive (TCIA) was used in our experiments2. The MRI protocol used in the data is described by Litjens3. For each case, several normal slices that contain no lesions (normal) and slices contain only one lesion (abnormal) on T2w images were selected. For each selected image slice, a 144* 144 square region of interest enclosing the prostate region was cropped as input images. We used the resulting 189 lesion slices with 721 normal lesion slices from 248 patients for training and testing. We did not use ADC and DCE (Ktrans) images provided in the dataset to avoid error induced by potential motion between image series, but our method is not restricted to T2w images with proper registration.
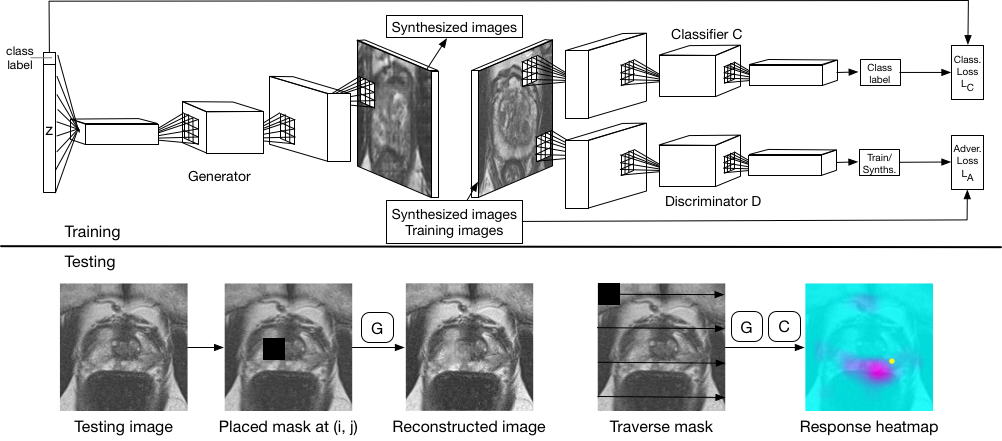
As shown on Figure 1, ExpA-GAN consists of two components: generative adversarial network (GAN) as a knowledge base and classifier1,4, and region-by-region explainer for the classification result. During testing, the explainer will intentionally dismiss the region from the test image, and use the generative distribution of GAN to reconstruct the missing information5. Heat map is calculated from the variance of classifier raw output by
$$heatmap_{(i,j)}=C(x, y)-C(x_{mask_{(i,j)}\&recon},y)$$
where $$$(i, j)$$$ is the region center, $$$C(x,y)$$$ is the classifier raw output given image $$$x$$$ and class $$$y$$$ (which is always abnormal in this study), and $$$x_{mask_{(i,j)}\&recon}$$$ is the reconstructed image from the masked image. The assumption behind is that the region that contains important information tends to receive lower classification score once it is dismissed.
In
the training stage, we trained ExpA-GAN with the 910 images and corresponding
binary normal/abnormal label. For each training image, we performed random
shifting and flipping. For the ease of computation, in testing, we randomly
selected 50 out of 189 abnormal slices to generate lesion awareness heat map. We
fed the resized test images into our framework. We used the binary square mask
with the width of 22 pixels, and each step size is 4 pixels when slipping the
mask.
Results & Discussion
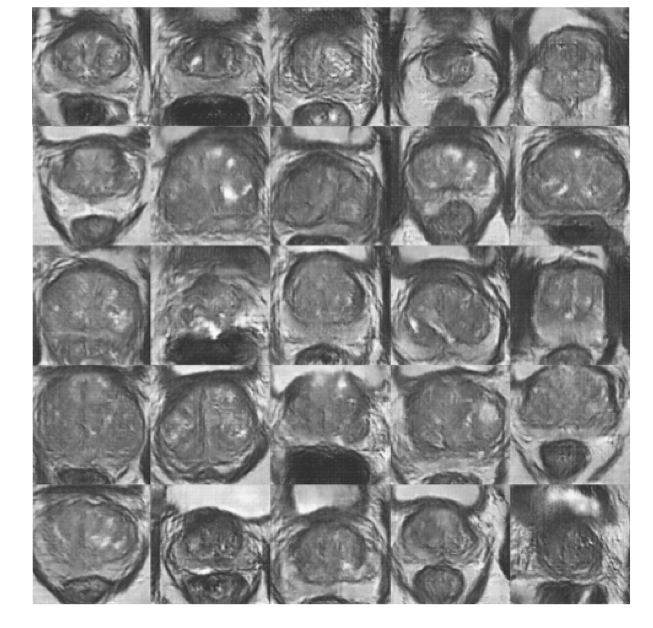
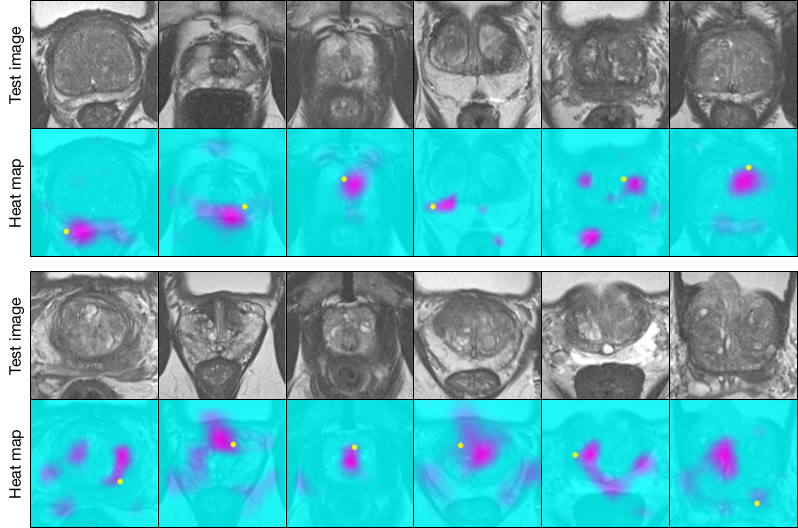
Figure 2 shows samples synthesized by ExpA-GAN. The realistic synthesized images demonstrated that our generative model had accurately learned samples. As shown on Figure 3, ExpA-GAN produced informative heat map. Unlike other lesion detector, using very-weak supervision, ExpA-GAN did not require any lesion location label in training but still produced reliable predictions.
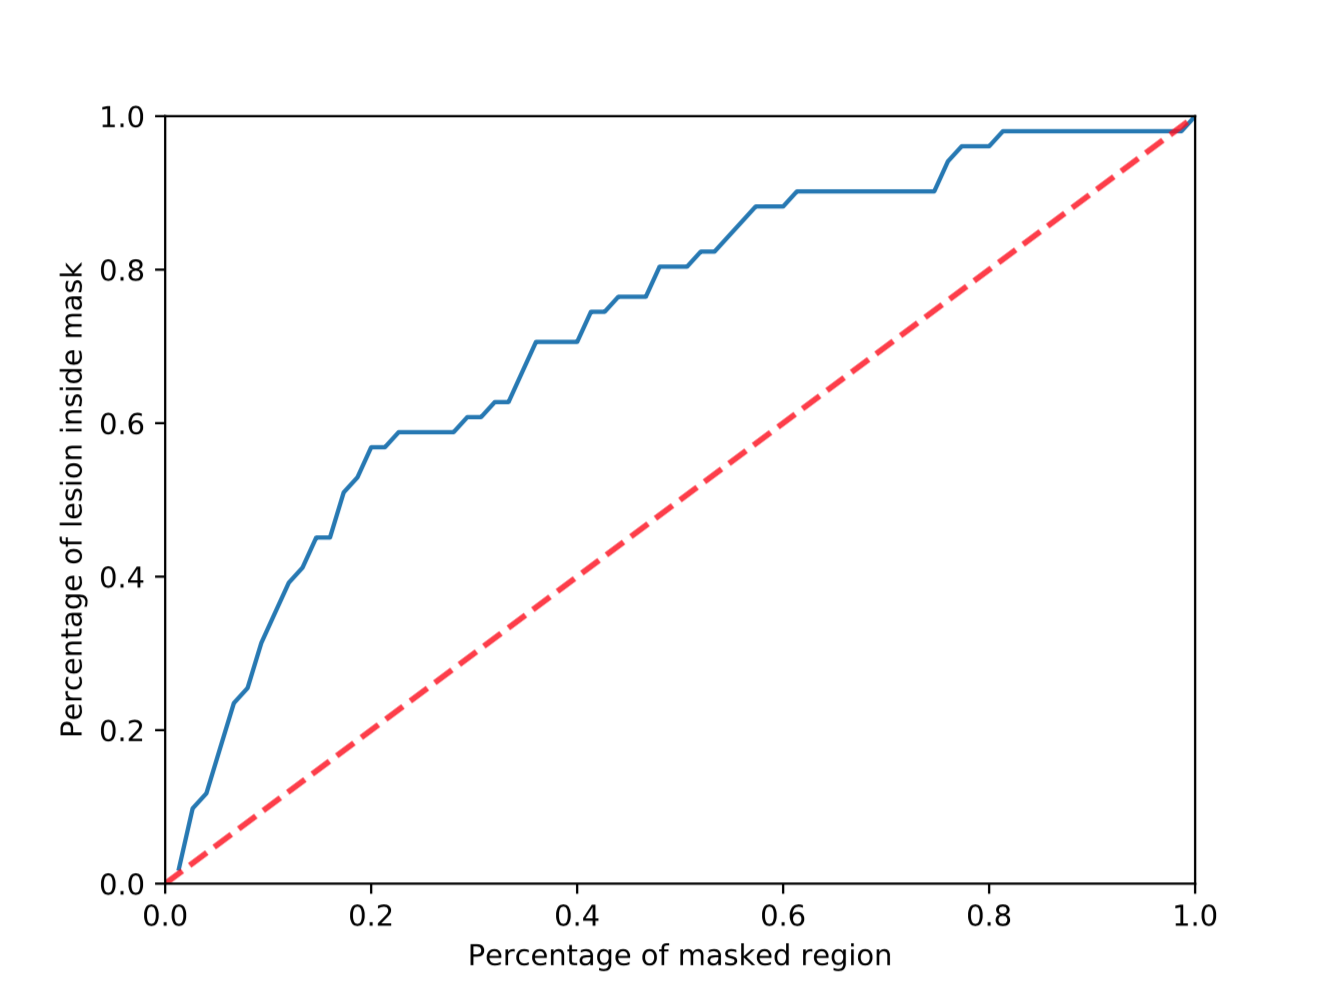
To quantitatively evaluate the validity of lesion awareness heat map, we used normalized distance between the center of top-score region and the ground-truth lesion location, under the assumption that a heat map will have the strongest signal at a region most likely to contain a lesion. We received a normalized distance6 of 0.169 on abnormal images (normal images do not contain lesion). In addition, for each lesion awareness heat map, we drew a binary lesion mask by setting a threshold to the heat map. On Figure 4, we achieved 58.8% accuracy on the binary lesion masks with masks only covering 22.7% of total image region on average. In future work, we may introduce a small number of lesion location labels to guide the localization.
Conclusion
We proposed a novel very-weak supervision model, explanatory auxiliary generative adversarial network (ExpA-GAN), that can predict the level of prostate cancer awareness in the entire prostate. In training, ExpA-GAN only requires a binary label (normal/abnormal) and their corresponding prostate MRI. In experiment, for lesion detection, we achieved the prediction rate of 58.8%. We demonstrated the feasibility of the heat map prediction of the prostate cancer through qualitative and quantitative evaluations.Acknowledgements
This study was supported in part by Siemens Healthcare.References
- Goodfellow I, Pouget-Abadie J, Mirza M, Xu B, Warde-Farley D, Ozair S, Courville A, Bengio Y. Generative adversarial nets. InAdvances in neural information processing systems 2014 (pp. 2672-2680).
- Litjens G, Debats O, Barentsz J, Karssemeijer N, and Huisman H. "ProstateX Challenge data", The Cancer Imaging Archive. 2017. https://doi.org/10.7937/K9TCIA.2017.MURS5CL
- Litjens G, Debats O, Barentsz J, Karssemeijer N, Huisman H. Computer-aided detection of prostate cancer in MRI. IEEE transactions on medical imaging. 2014 May;33(5):1083-92.
- Odena A, Olah C, Shlens J. Conditional image synthesis with auxiliary classifier gans. arXiv preprint arXiv:1610.09585. 2016 Oct 30.
- Yeh R, Chen C, Lim TY, Hasegawa-Johnson M, Do MN. Semantic image inpainting with perceptual and contextual losses. arXiv preprint arXiv:1607.07539. 2016 Jul 26.
- Zhang Q, Cao R, Wu YN, Zhu SC. Growing Interpretable Part Graphs on ConvNets via Multi-Shot Learning. InAAAI 2017 (pp. 2898-2906).
Figures