3483
Machine learning for prostate cancer Gleason score prediction using radiomics of T2-weighted imaging, diffusion weighted imaging and T2-mapping1Department of Future Technologies, University of Turku, Turku, Finland, 2Department of Diagnostic Radiology, University of Turku, Turku, Finland, 3Department of Pathology, University of Turku, Turku, Finland, 4Department of Urology, Turku University Hospital, Turku, Finland
Synopsis
We extensively evaluated large number radiomics of prostate T2-weighted imaging, diffusion weighted imaging and T2-mapping. The highest overall performance estimate (AUC = 0.88) we obtained for the model utilizing a small subset of texture features from the ADCm, K, and T2w parameters. These features included texture descriptors based on gray-level co-occurrence matrix, Gabor transform, and the Zernike and Hu moments.
Introduction
Prostate Cancer (PCa) continue be one of the most common cancers among men in United States(1). The Gleason score is a commonly used marker for estimating prostate cancer aggressiveness . Unfortunately, in 30-50% of patients the findings based on systematic TRUS do not represent true Gleason score (2-4). Machine learning (ML) and computer-aided diagnostics (CAD) for prostate MRI has demonstrated to have complementary role to a reporting radiologist in PCa detection (5-7). However, there is only a limited number of studies focusing on characterizing of the detected PCa lesions.Materials and Methods
The MR examinations were performed using a 3 Tesla MR scanner (Ingenuity PET/MR, Philips, Cleveland, USA), using a two channel volume whole body RF coil for excitation, and a 32 channel manufacture’s cardiac coils for measuring the signal. T2-weighted images (T2w) were acquired with TR/TE 4668/130 ms, FOV 250x250 mm2, reconstruction matrix size 250x320, slice thickness 2.5 mm. For acquiring the DWI data sets, a single shot spin-echo based sequence was used with monopolar diffusion gradient scheme and echo-planar read out, TR/TE 3141/51ms, FOV 250x250 mm2, reconstruction matrix 224x224, slice thickness 5.0 mm, number of slices 20, diffusion time (Δ−δ/3) 20.3 ms, and b values (number of signal averages) 0 (2), 100 (2), 300 (2), 500 (2), 700 (2), 900 (2), 1100 (2), 1300 (2), 1500 (2), 1700 (3), 1900 (4), 2000 (4) s/mm2. T2 relaxation values (T2) were obtained using a gradient and spin echo (GraSE) sequence with TR/TEs of 686/20, 40, 60, 80, 100 ms, FOV 230x183 mm2, reconstruction matrix 512x400, slice thickness 5.0 mm. DWI data sets fitted on voxel level using the monoexponential (ADCm) and kurtosis (ADCk, K) models.
Prostate cancer extent on each MRI acquisition (T2w, DWI, T2) was manually delineated by one a research fellow working in consensus with genitourinary pathologist using whole mount prostatectomy sections as “ground true”.
Several texture descriptor methods with various parameter combinations were used for extracting 2D texture features from the manually delineated PCa lesions (Figure 1). Seven window configurations were used for DWI and nine for T2 and T2w data. The following texture feature classes were calculated: gray-level co-occurrence matrix (GLCM), local binary patterns (LBP), Gabor function, Haar transform, Hu moments, Zernike moments, histogram of oriented gradients, Sobel operator. The predictive performance for Gleason score classification 3+3 vs >3+3 was used a performance measure. The predictive performance of the models built by the regularized logistic regression algorithms was estimated by a nested cross validation strategy (8), which consisted of an outer leave-pair-out cross-validation (LPOCV) (9) and an inner 10-Fold cross validation (10FCV) for hyper-parameter selection.
Results
In total 62 patients and 71 tumors were included in final analyses. When using all features and L1 regularization (Figure 2), T2w had AUC (95% CI) value of 0.82 (0.72 – 0.92), DWI derived parametric maps (ADCm,ADCk, K) had AUC (95% CI) values ranging from 0.64 (0.52 – 0.77) to 0.71 (0.58 – 0.83), and T2 derived features had AUC (95% CI) value of 0.58 (0.45 – 0.71). In contrast, logistic regression utilizing L2 regularization showed better performance than using L1 regularization for all image types except for T2w where AUC (95% CI) value dropped to 0.68 (0.55 – 0.82), DWI derived parametric maps (ADCm,ADCk, K) had AUC (95% CI) values ranging from 0.69 (0.57 – 0.81) to 0.73 (0.60 – 0.85), and T2 derived features had AUC (95% CI) value of 0.70 (0.59 – 0.82).
No substantial improvements of AUC values were present when combining all features of image types (Figure 3). The AUC (95% CI) values were in the range from 0.53 (0.40 – 0.66) to 0.82 (0.73 – 0.91) for L1 regularization and from 0.69 (0.56 – 0.81) to 0.80 (0.71 – 0.89) for L2 regularization.
Discussion
We have evaluated an extensive number of MRI radiomics in multivariate setting for their ability to predict the Gleason score of prostate cancer. Moreover, we have presented a machine learning system that, from a very large number of candidate features, searches for a relevant subset for the task and alternatively weights the features accordingly. The single feature with highest prediction performance estimate (AUC = 0.84) was a gray-level co-occurrence matrix homogeneity of T2w.Conclusion
Our results suggest that the use of texture features extracted from T2w, ADCm, and K parametric maps leads to improved PCa characterization accuracy compared to the more commonly used statistical features of DWI. In contrast, adding features from T2 did not improve the classification accuracy.Acknowledgements
No acknowledgement found.References
1. Siegel RL, Miller KD, Jemal A. Cancer statistics, 2016. CA Cancer J Clin 2016;66:7-30.
2. Nepple KG, Wahls TL, Hillis SL, Joudi FN. Gleason score and laterality concordance between prostate biopsy and prostatectomy specimens. Int Braz J Urol 2009;35:559-564.
3. Steinberg DM, Sauvageot J, Piantadosi S, Epstein JI. Correlation of prostate needle biopsy and radical prostatectomy Gleason grade in academic and community settings. Am J Surg Pathol 1997;21:566-576.
4. Rajinikanth A, Manoharan M, Soloway CT, Civantos FJ, Soloway MS. Trends in Gleason score: concordance between biopsy and prostatectomy over 15 years. Urology 2008;72:177-182.
5. Kwak JT, Xu S, Wood BJ, et al. Automated prostate cancer detection using T2-weighted and high-b-value diffusion-weighted magnetic resonance imaging. Med Phys 2015;42:2368-2378.
6. Viswanath SE, Bloch NB, Chappelow JC, et al. Central gland and peripheral zone prostate tumors have significantly different quantitative imaging signatures on 3 tesla endorectal, in vivo T2-weighted MR imagery. J Magn Reson Imaging 2012.
7. Ginsburg SB, Viswanath SE, Bloch BN, et al. Novel PCA-VIP scheme for ranking MRI protocols and identifying computer-extracted MRI measurements associated with central gland and peripheral zone prostate tumors. J Magn Reson Imaging 2014.
8. Varma S, Simon R. Bias in error estimation when using cross-validation for model selection. BMC Bioinformatics 2006;7:91.
9. Airola A, Pahikkala T, Waegeman W, De Baets B, Salakoski T. An experimental comparison of cross-validation techniques for estimating the area under the ROC curve. Computational Statistics & Data Analysis 2011;55:1828-1844.
Figures
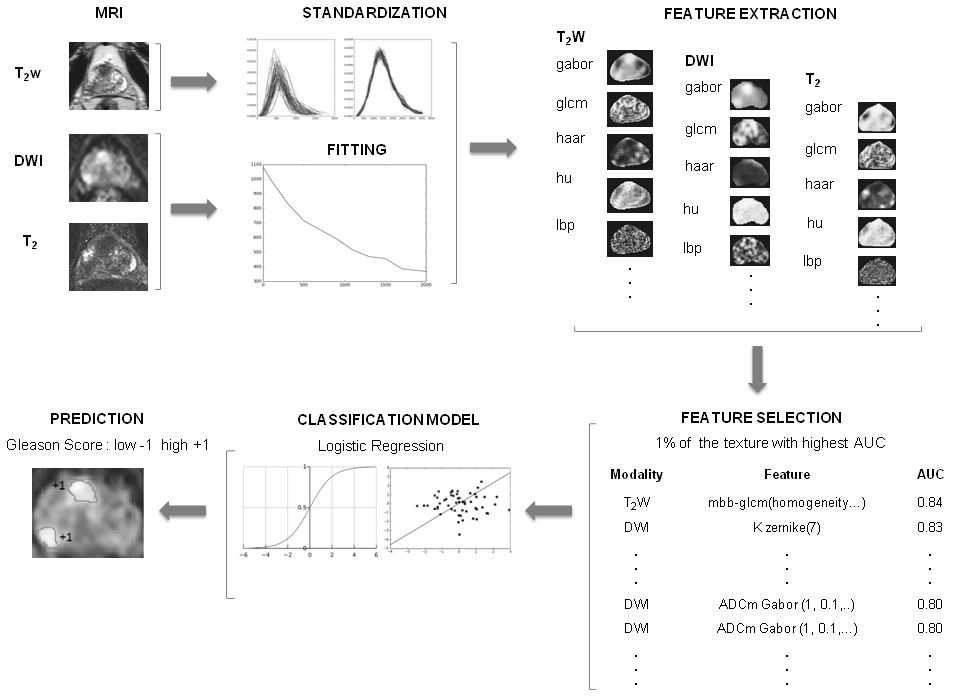
Figure 1
The post-processing pipeline. The T2-weighted imaging (T2w) data set is standardized while the monoexponential and kurtosis models are applied to diffusion weighted imaging (DWI) data set. The T2 relaxation values are obtained using a two parameter monoexponential function. Subsequently, the features are calculated using T2w and parametric maps. The feature selection is performed by choosing 1% of the features with highest AUC. Then with the selected features a logistic regression model is fitted and used to predict the lesion’s Gleason score group.
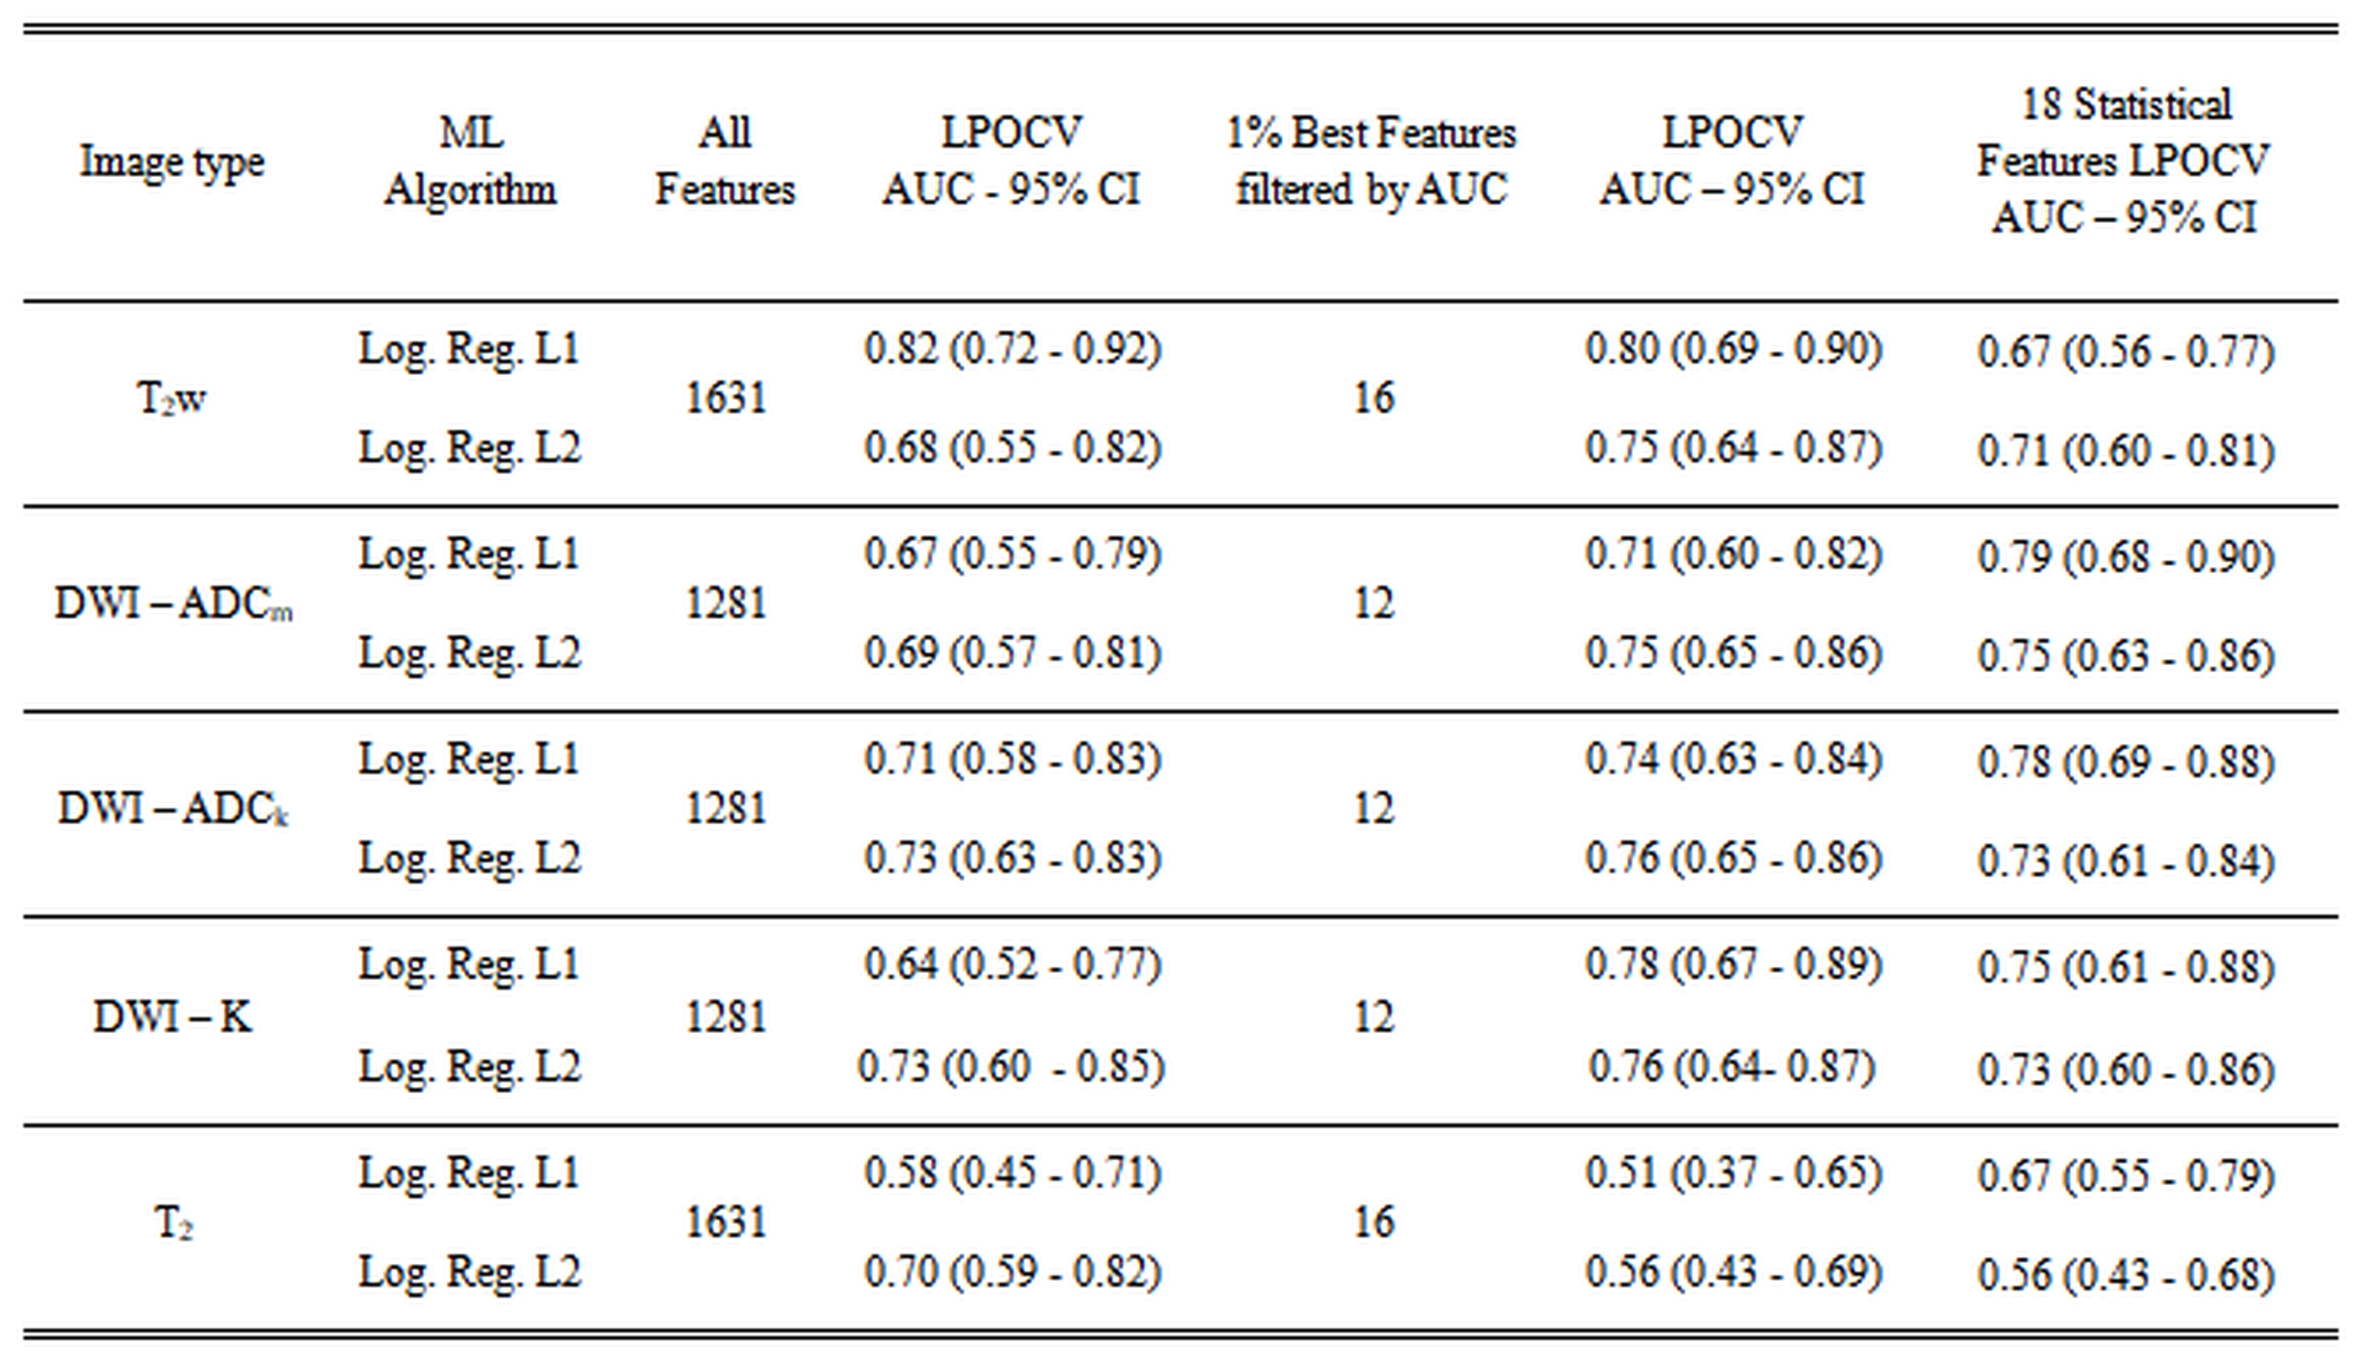
Figure 2
Area under the receiver operating curve values estimated using outer leave-pair-out cross-validation (LPOCV) per image type with all features and with selected features.
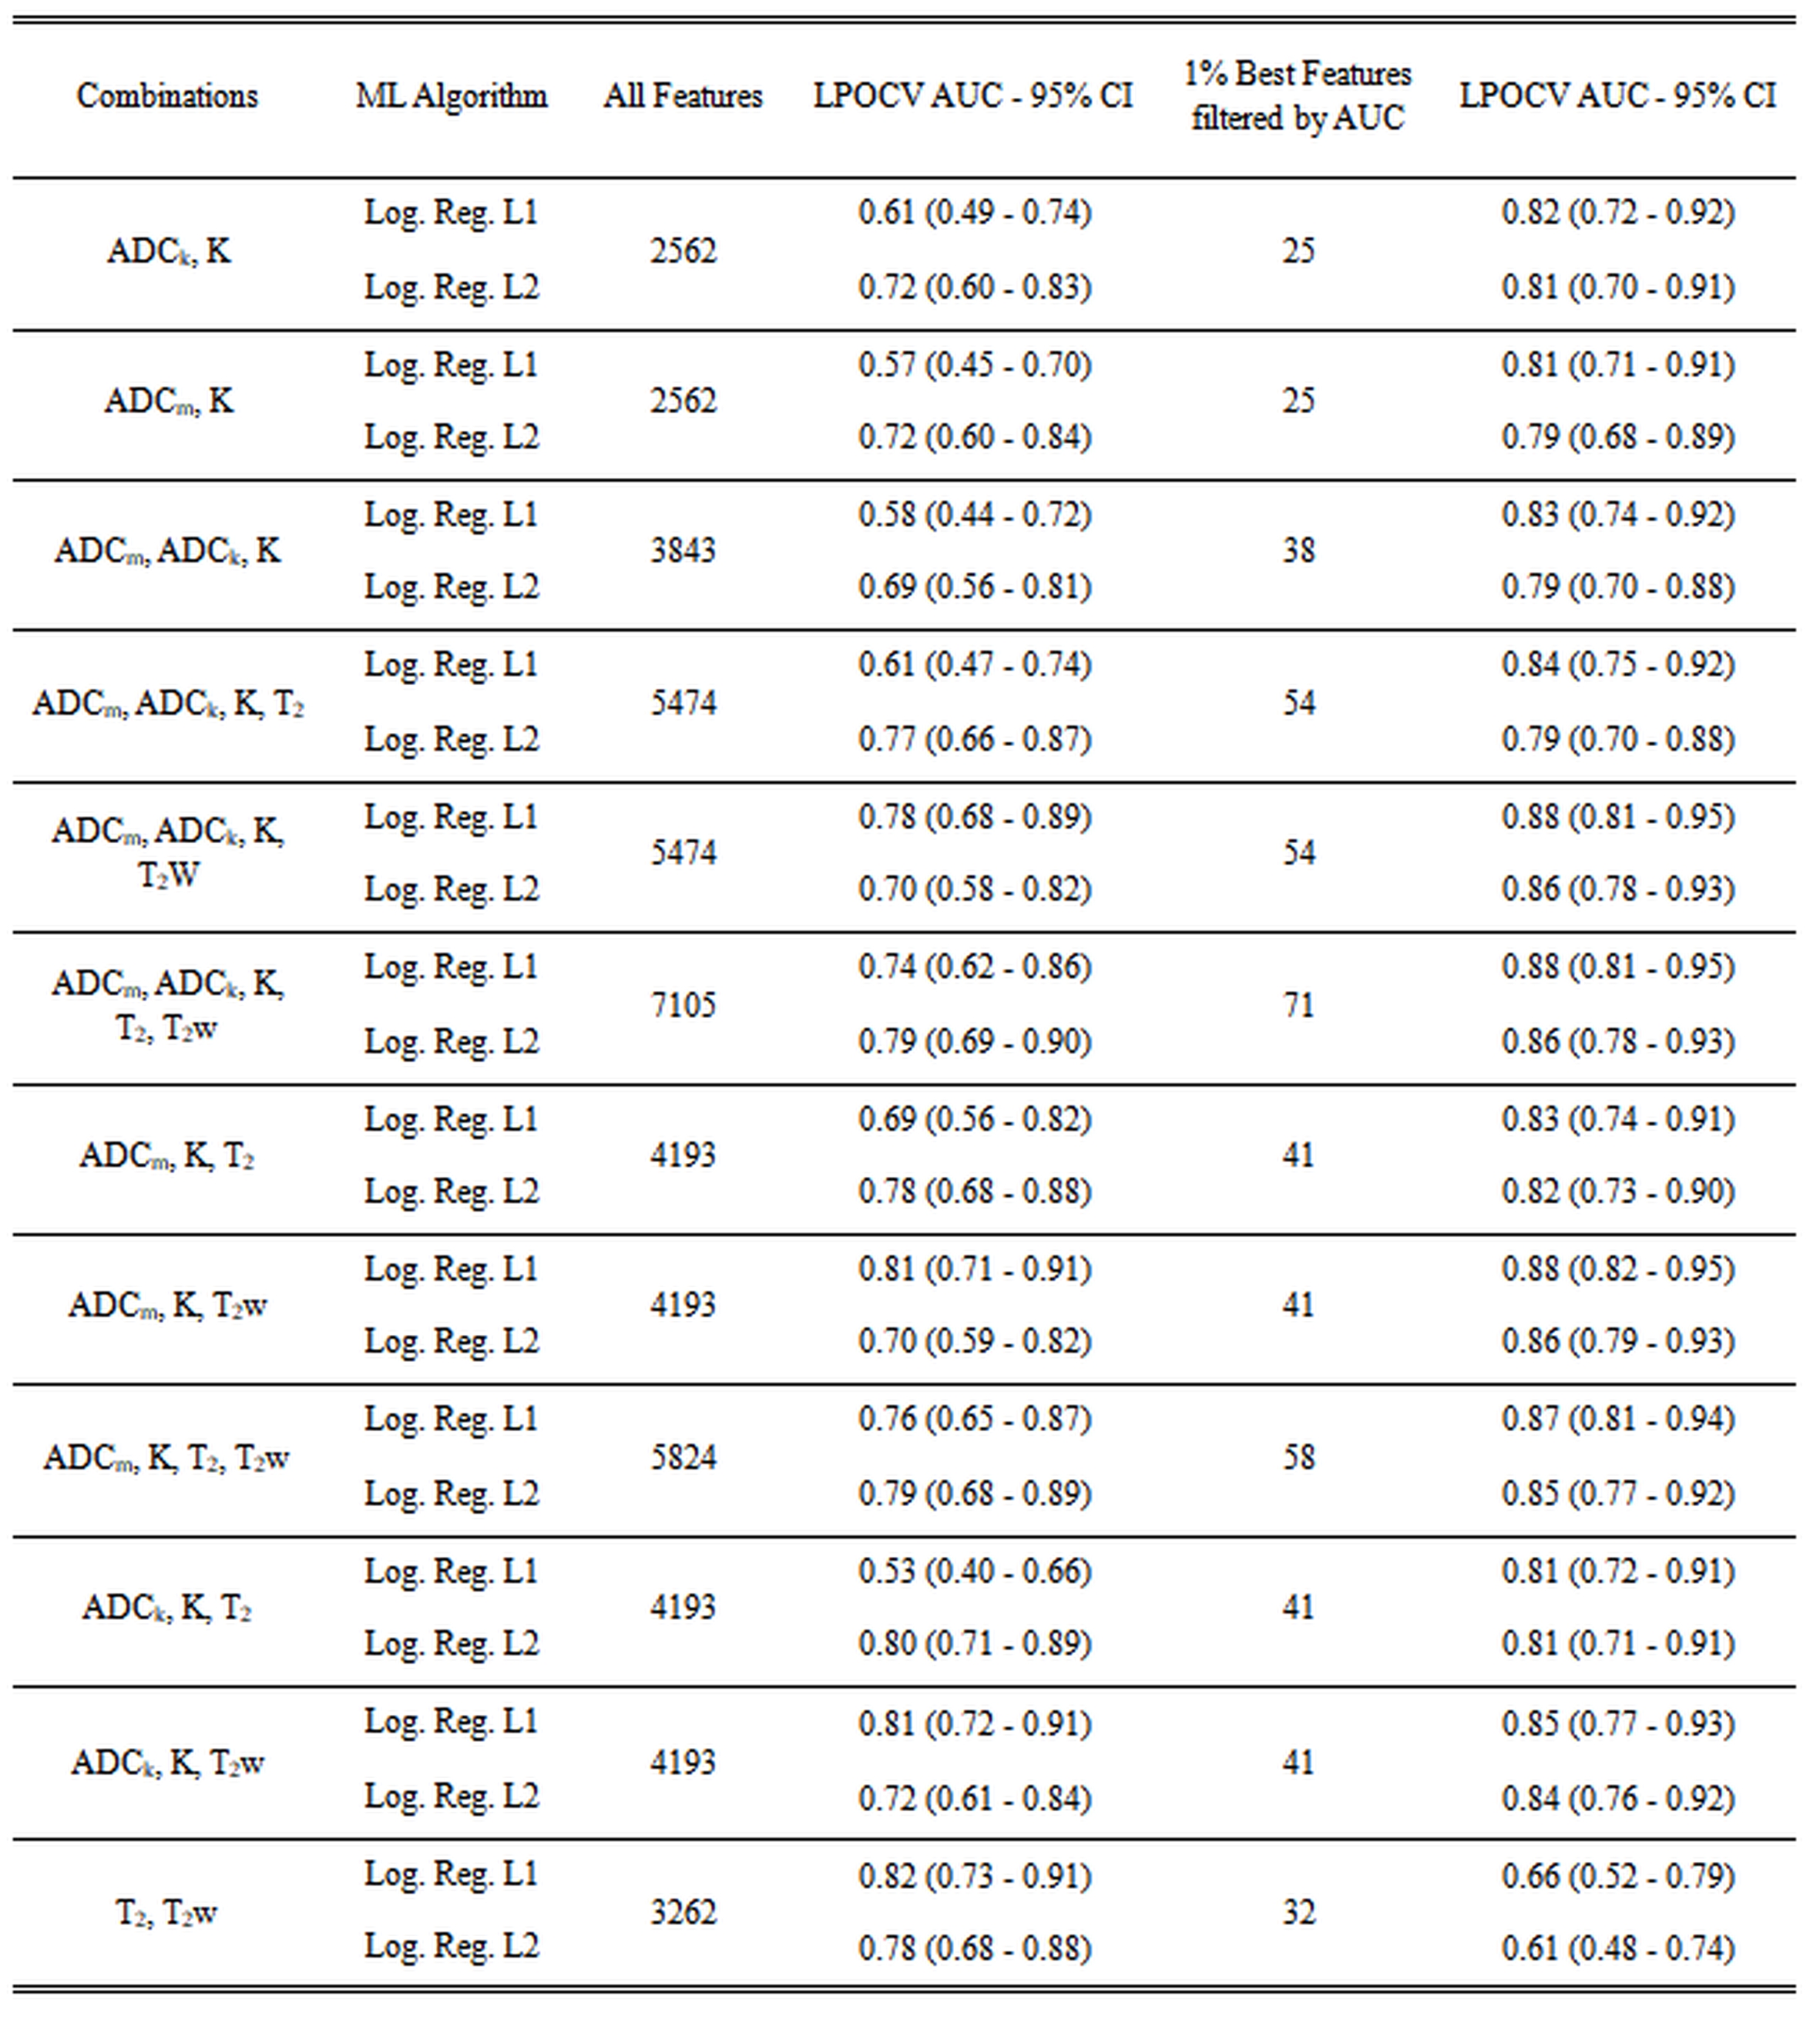
Figure 3
Area under the receiver operating curve values estimated using outer leave-pair-out cross-validation for the combinations of the image types.