3482
Supervised Machine Learning with Blind Source Separation (BSS) reveals distinct networks of pathological changes in brain magnetic susceptibility (QSM): Application to multiple sclerosis.1Buffalo Neuroimaging Analysis Center, Department of Neurology, Jacobs School of Medicine and Biomedical Sciences, University at Buffalo, The State University of New York, Buffalo, NY, United States, 2Center for Biomedical Imaging, Clinical and Translational Science Institute, University at Buffalo, The State University of New York, Buffalo, NY, United States, 3MR Research Laboratory, IRCCS, Don Gnocchi Foundation ONLUS, Milan, Italy, 4BairdMS Center, Department of Neurology, Jacobs School of Medicine and Biomedical Sciences, University at Buffalo, The State University of New York, Buffalo, NY, United States
Synopsis
Conventional region-of-interest (ROI) or voxel-based analyses of quantitative susceptibility maps (QSM) do not provide insights on the mechanistic and temporal independence of tissue alterations between subjects. In this study, we combined Blind Source Separation (BSS) with a Machine Learning strategy to reveal specific, independent disease-related networks of tissue alterations. Our analysis identified anatomically localized independent networks of pathological susceptibility alterations in multiple sclerosis (MS) without a priori information on age, sex, disease, or anatomy.
Introduction
Quantitative Susceptibility Mapping (QSM) is a recent post-processing technique for phase-based MRI that has a uniquely high sensitivity toward myelin and iron in the brain.1-4 The technique is increasingly being used to study brain iron homeostasis and white matter lesions in neurological diseases.5-7 Studies typically compare susceptibility values in patients with those in controls on a region-of-interest basis or with voxel-wise statistics. However, these conventional analysis techniques do not provide insights on the mechanistic and temporal independence of tissue alterations between subjects and regions.
In the present study, we combined Blind Source Separation (BSS) with a Machine Learning strategy to reveal specific, independent disease-related networks of tissue alterations.
Methods
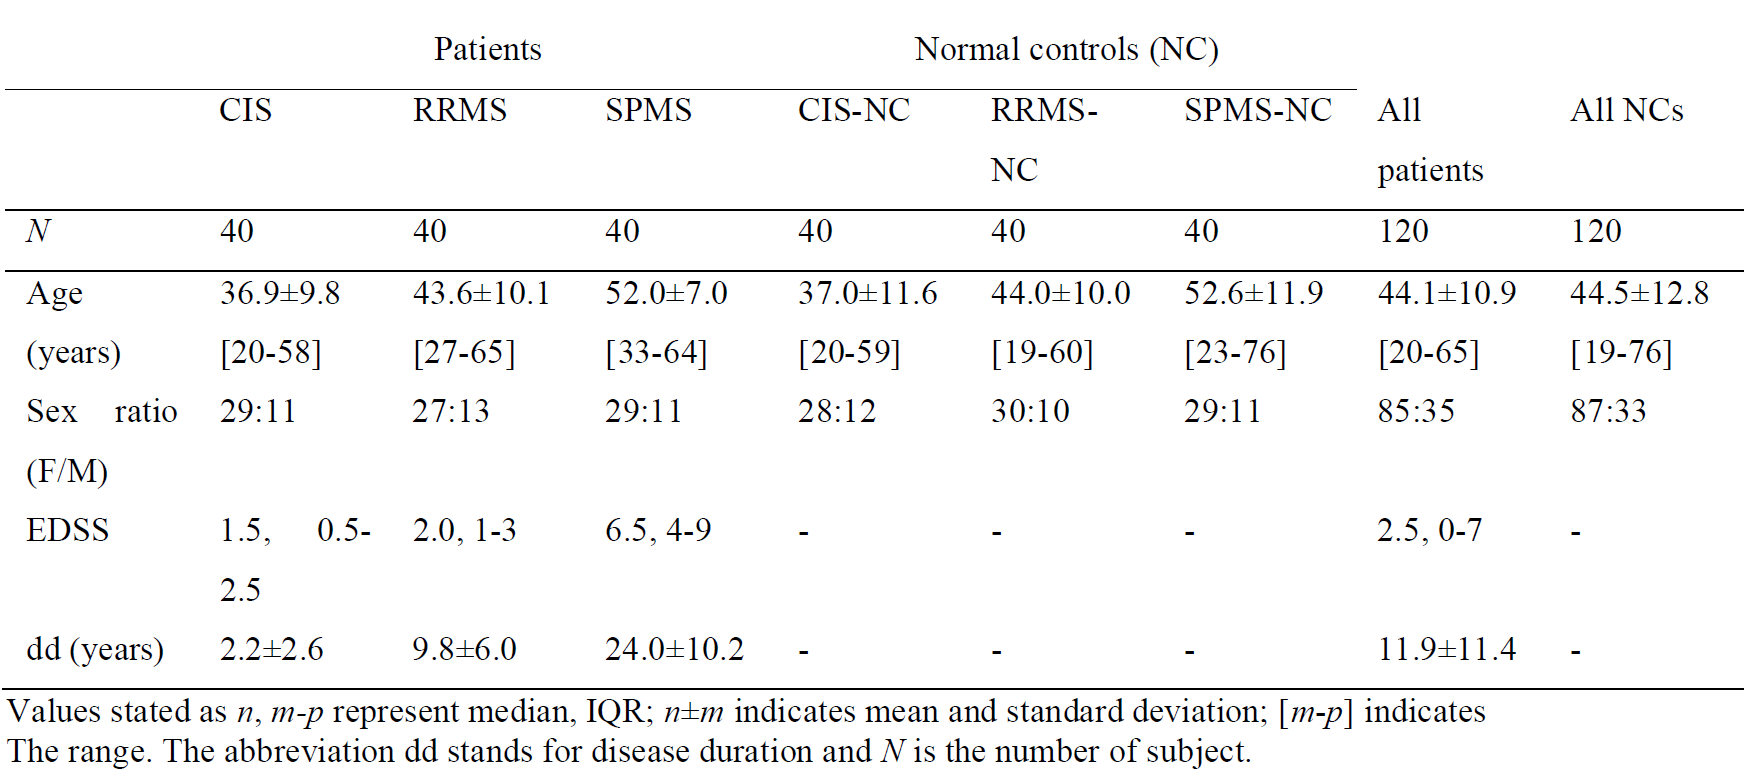
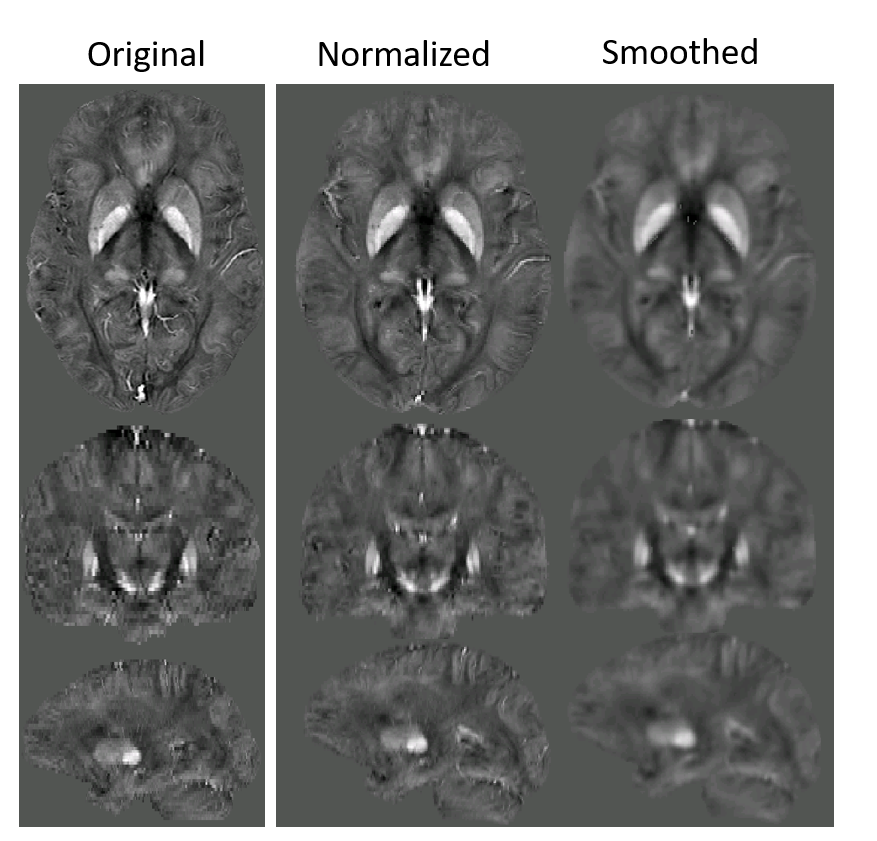
This IRB-approved study relied on three separate patient groups for clinically isolated syndrome (CIS), relapsing-remitting MS (RRMS), and secondary-progressive MS (SPMS). For each group, we included separate age- and sex-matched control groups (Table 1). The same cohort had been used in a recently published study in which we analyzed thalamic susceptibility and volumes with a conventional approach.8 Subjects were imaged at 3T (GE Signa Excite HD 12.0) using single-echo gradient-echo (matrix 512x192x64; 0.5x1x2mm3; 12° flip, TE/TR=22ms/40ms, bandwidth=13.89kHz). Susceptibility maps were obtained by phase unwrapping,9 background-field correction,10,11 and HEIDI.12 All susceptibility maps were normalized (ANTs) to a custom isotropic 1mm3 susceptibility brain template13 and smoothed with a 1mm Gaussian kernel.
Applying a 3D Independent Component Analysis (ICA; FSL-MELODIC; automated dimensionality selection) to the entire cohort (three patient groups and three control groups), we separated the inter-subject susceptibility variations into their underlying statistically independent source networks (Independent Components; IC) of inter-subject variations and the corresponding subject-specific weights for each network (mixing coefficients; MC). In a first pre-filtering step, we searched for significant outliers in mixing coefficients (MC) to identify and eliminate non-representative subjects from the cohort, e.g. controls with potential subclinical pathology leading to an extremely high deep gray matter iron concentration. Visual screening of the ICs from a second ICA of the cleaned cohort identified networks that showed typical QSM artifacts and vessels. These ICs were excluded from all subsequent analyses.
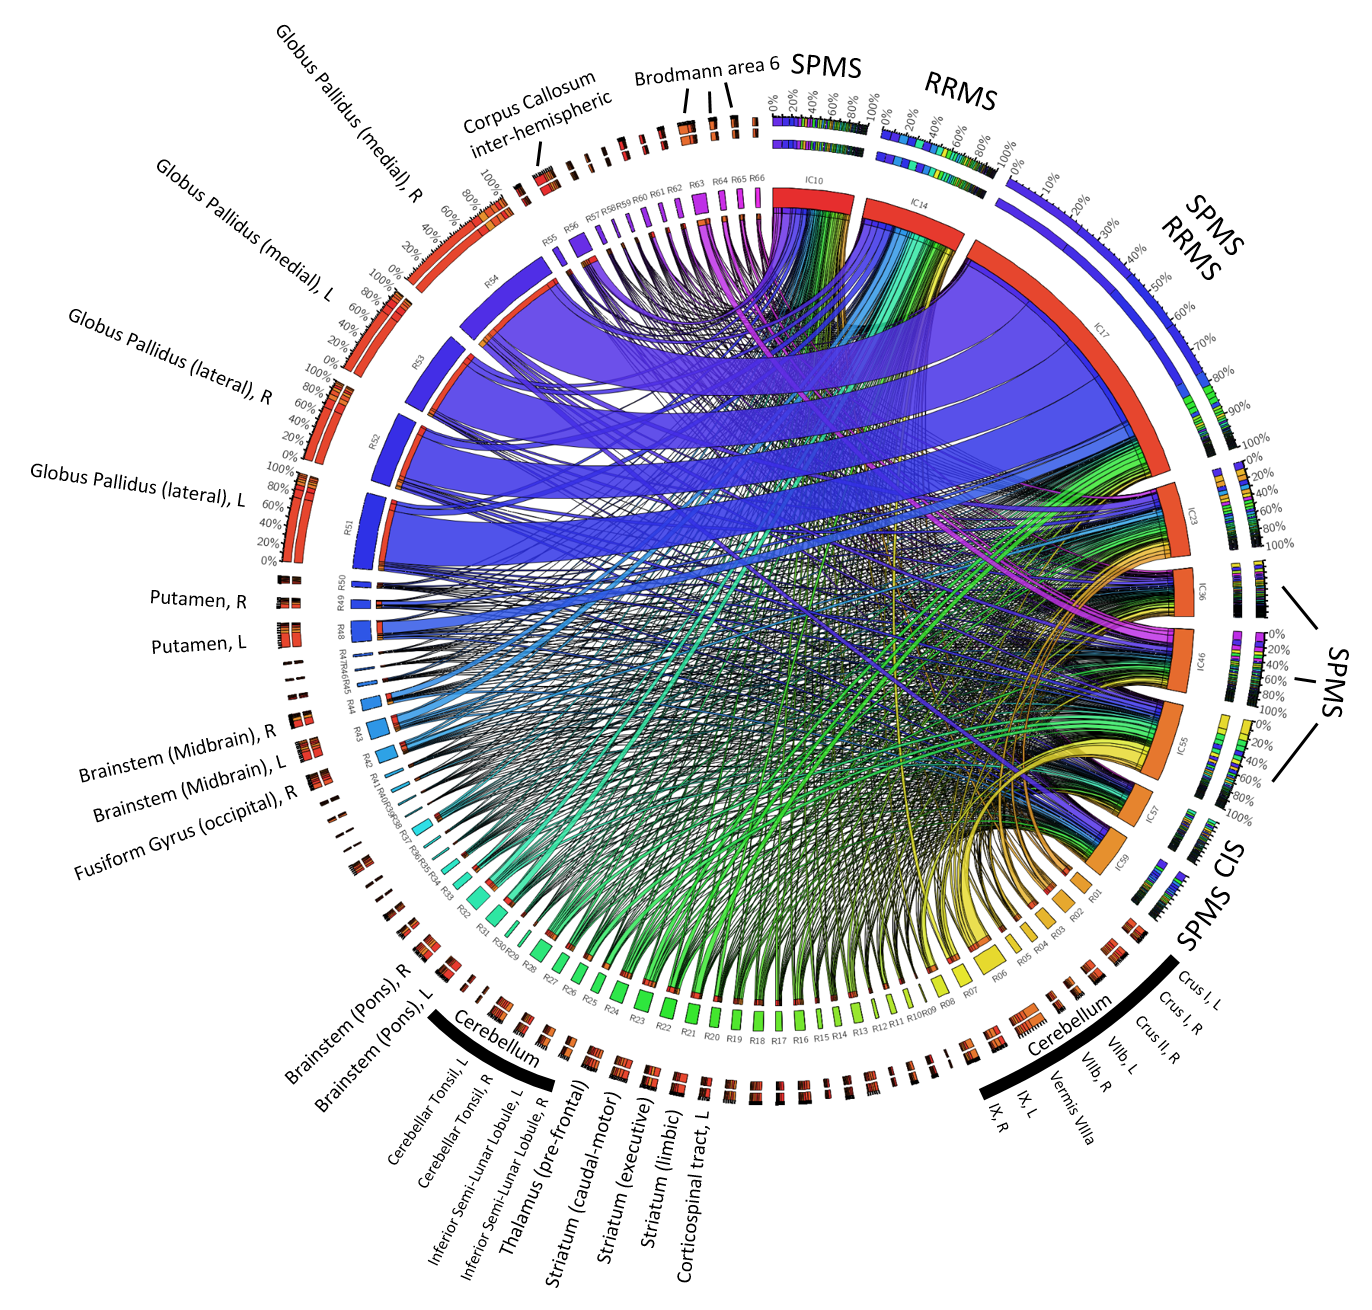
To assess the anatomical representation of the IC-networks, we calculated for each IC the mean intensity values in the anatomical regions defined by brain atlases of thalamic connectivity,14,15 striatal connectivity,16 tractography,17 cerebellum,18 and the Talairach atlas.19 Regions were considered for subsequent analyses if Spatial Mixture Modelling revealed more than 200 voxels with p<0.05 in the region. Associations of networks (ICs) with anatomical locations were visualized using Circos.20
To identify networks associated with MS pathology we applied a Linear Discriminant Analysis (LDA) classification algorithm to the MCs using stepwise inclusion of networks (entry F=3.84; removal F=2.71). We determined predictive power in a leave-one-out cross-validation using predicted residual sum-of-squares (PRESS) statistics.
Results
Figure 1 shows an exemplary susceptibility map before and after the normalization procedure. Five subjects and 17 ICs satisfied the exclusion criteria, resulting in 42 meaningful networks (ICs).
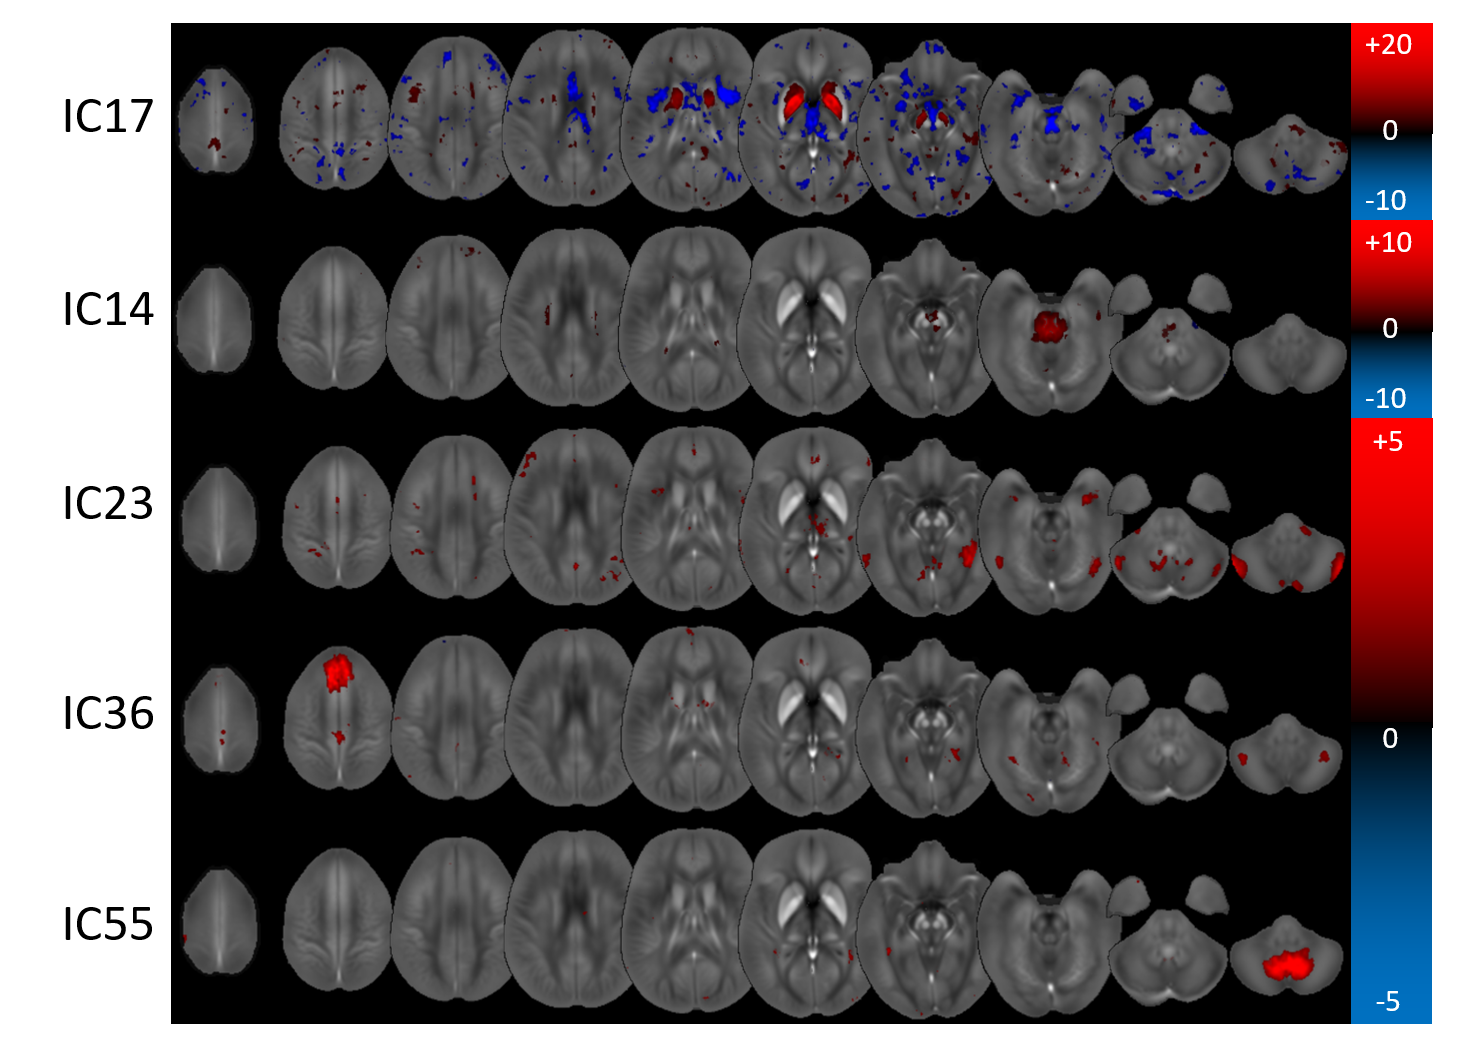
The LDA identified five disease-associated networks: ICs 17 (Canonical Discriminant Function Coefficient: 0.694), 23 (-0.470), 36 (-0.432), 14 (0.395), and 55 (0.358). These networks predicted definite MS with a cross-validated sensitivity and specificity of 65.4% and 73.7%, respectively. IC17, most specific to definite MS, was a striatal network showing globus pallidus and left putamen, consistent with previous ROI-based findings of increased susceptibility in these regions.21,22
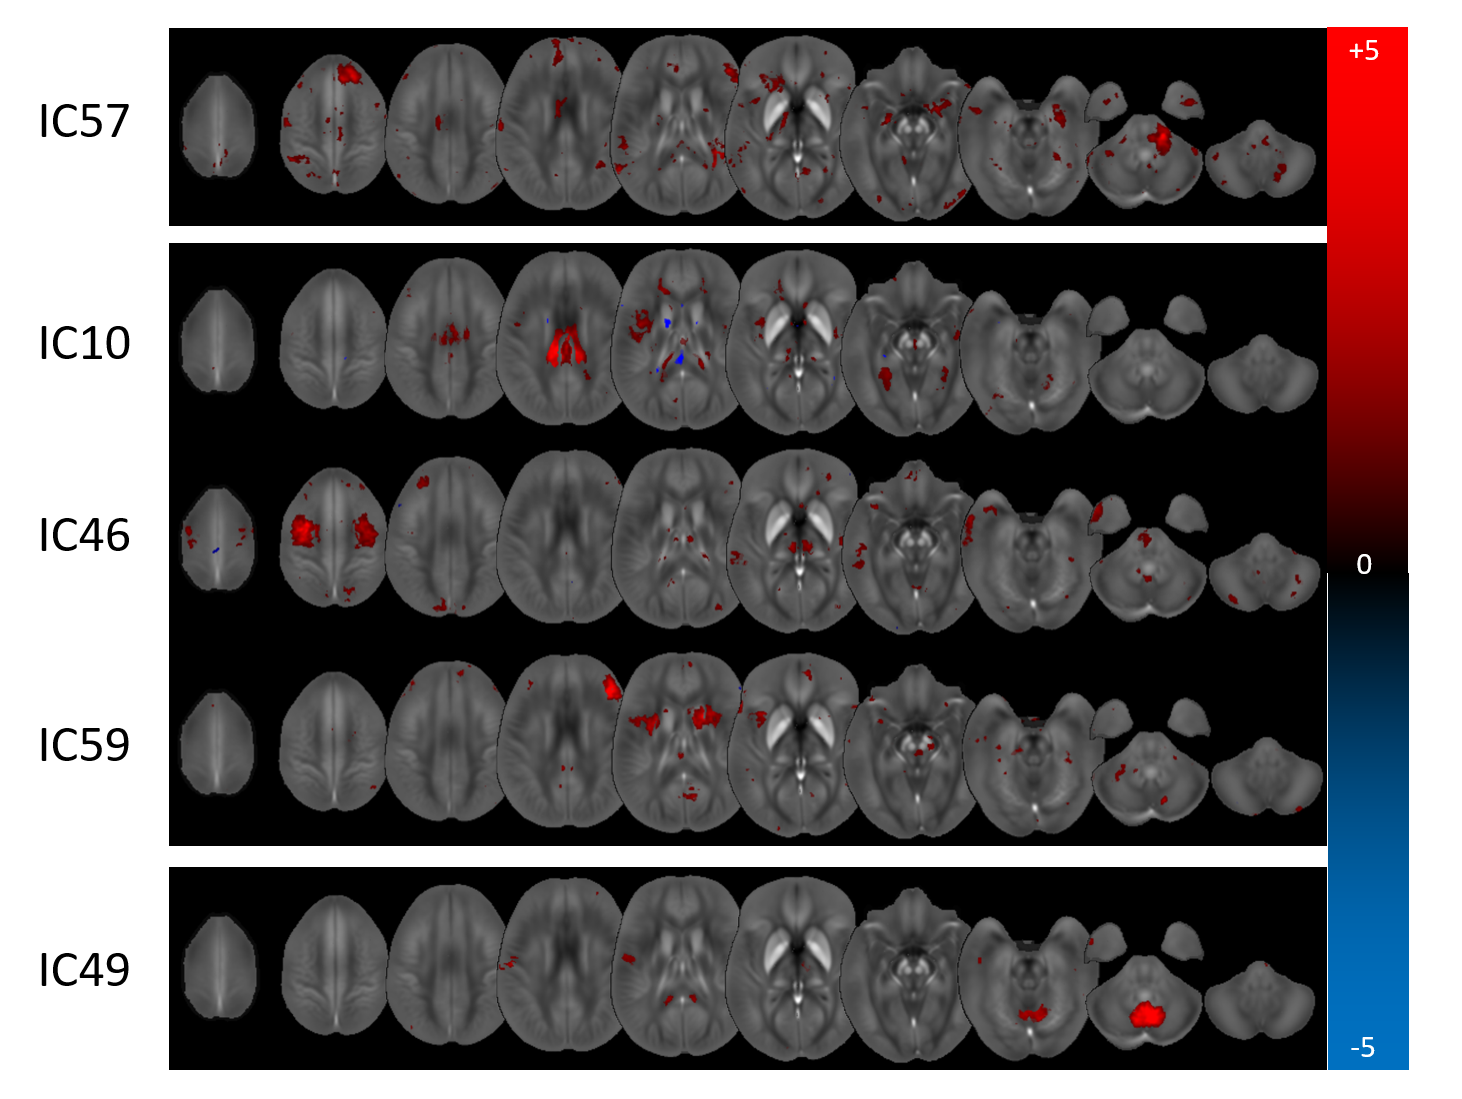
When only the RRMS patients and matched controls were considered, two networks were identified (ICs: 14, 17) with predictive sensitivity and specificity of 60.0% and 70.3%, respectively. For SPMS, sensitivity and specificity were 78.9% and 82.1% with six relevant networks (ICs: 10, 17, 36, 46, 55, 59). Only one network was relevant for CIS with sensitivity and specificity of 67.5% and 59.0% (IC57).
Figure 2 illustrates the involvement of anatomical regions in the identified networks. Figures 3 and 4 show the Z-statistics of the network patterns relevant for definite MS and the three sub-analyses, respectively.
Discussion
We demonstrated the utility of Blind Source Separation and advanced Machine Learning techniques to reveal independent networks of disease activity in MS. Besides the striatum, identified networks separated the brainstem, deep white matter, cerebellum, and cortical regions not previously identified with QSM. The observation of these regions in distinct components might suggest at least partial independence of pathological mechanisms from iron accumulation in the deep gray matter.Conclusion
The presented analysis technique identified anatomically localized independent networks of pathological susceptibility alterations in MS without a priori information on age, sex, disease, or anatomy. Our results suggest that the presented analysis technique represents a means to disentangle disease mechanisms that affect specific brain regions independently.Acknowledgements
Research reported in this publication was funded by the National Center for Advancing Translational Sciences of the National Institutes of Health under Award Number UL1TR001412. The content is solely the responsibility of the authors and does not necessarily represent the official views of the NIH.
We thank Dr. David Wack (Department of Nuclear Medicine) for stimulating discussions about the employed analysis techniques.
References
[1] J. R. Reichenbach, F. Schweser, B. Serres, and A. Deistung, “Quantitative Susceptibility Mapping: Concepts and Applications,” Clin Neuroradiol, 25(S2):225–230; 2015.
[2] C. Liu, H. Wei, N.-j. Gong, M. J. Cronin, R. Dibb, and K. Decker, “Quantitative Susceptibility Mapping: Contrast Mechanisms and Clinical Applications,” Tomography, 1(1):3–17; 2015.
[3] Y. Wang and T. Liu, “Quantitative susceptibility mapping (QSM): Decoding MRI data for a tissue magnetic biomarker,” Magn Reson Med, 73(1):82–101; 2015.
[4] E. M. Haacke, S. Liu, S. Buch, W. Zheng, D. Wu, and Y. Ye, “Quantitative susceptibility mapping: current status and future directions,” Magn Reson Imaging, 33(1):1–25; 2015.
[5] S. Ropele and C. Langkammer, “Iron quantification with susceptibility,” NMR Biomed, 30(4):e3534, 2017.
[6] M. J. Cronin, S. J. Wharton, A. M. Al-Radaideh, C. Constantinescu, N. Evangelou, R. Bowtell, and P. A. Gowland, “A comparison of phase imaging and quantitative susceptibility mapping in the imaging of multiple sclerosis lesions at ultrahigh field,” Magnetic Resonance Materials in Physics, Biology and Medicine, 2016.
[7] Y. Zhang, S. A. Gauthier, A. Gupta, W. Chen, J. Comunale, G. C.-Y. Chiang, D. Zhou, G. Askin, W. Zhu, D. Pitt, and Y. Wang, “Quantitative Susceptibility Mapping and R2* Measured Changes during White Matter Lesion Development in Multiple Sclerosis: Myelin Breakdown, Myelin Debris Degradation and Removal, and Iron Accumulation,” Am J Neuroradiol, 37(9):1629–1635; 2016.
[8] F. Schweser, A. L. Raffaini Duarte Martins, J. Hagemeier, F. Lin, J. Hanspach, B. Weinstock-Guttman, S. Hametner, N. P. Bergsland, M. G. Dwyer, and R. Zivadinov, “Mapping of thalamic magnetic susceptibility in multiple sclerosis indicates decreasing iron with disease duration: A proposed mechanistic relationship between inflammation and oligodendrocyte vitality,” NeuroImage (in press).
[9] H. S. Abdul-Rahman, M. A. Gdeisat, D. R. Burton, M. J. Lalor, F. Lilley, and C. J. Moore, “Fast and robust three-dimensional best path phase unwrapping algorithm.” Appl Opt, 46(26):6623–35; 2007.
[10] W. Li, B. Wu, and C. Liu, “Quantitative susceptibility mapping of human brain reflects spatial variation in tissue composition.” NeuroImage, 55(4):1645–56; 2011.
[11] F. Schweser, A. Deistung, B. W. Lehr, and J. R. Reichenbach, “Quantitative imaging of intrinsic magnetic tissue properties using MRI signal phase: An approach to in vivo brain iron metabolism?” NeuroImage, 54(4):2789–2807; 2011.
[12] F. Schweser, K. Sommer, A. Deistung, and J. R. Reichenbach, “Quantitative susceptibility mapping for investigating subtle susceptibility variations in the human brain.” NeuroImage, 62(3):2083–2100; 2012.
[13] J. Hanspach, M. G. Dwyer, N. P. Bergsland, X. Feng, J. Hagemeier, N. Bertolino, P. Polak, J. R. Reichenbach, R. Zivadinov, and F. Schweser, “Methods for the computation of templates from quantitative magnetic susceptibility maps (QSM): Toward improved atlas- and voxel-based analyses (VBA),” J Magn Reson Imaging (in press).
[14] T. E. J. Behrens, H. Johansen-Berg, M. W. Woolrich, S. M. Smith, C. A. M. Wheeler-Kingshott, P. A. Boulby, G. J. Barker, E. L. Sillery, K. Sheehan, O. Ciccarelli, A. J. Thompson, J. M. Brady, and P. M. Matthews, “Non-invasive mapping of connections between human thalamus and cortex using diffusion imaging.” Nature neuroscience, 6(7):750–7, 2003.
[15] T. E. J. Behrens, M. W. Woolrich, M. Jenkinson, H. Johansen-Berg, R. G. Nunes, S. Clare, P. M. Matthews, J. M. Brady, and S. M. Smith, “Characterization and Propagation of Uncertainty in Diffusion-Weighted MR Imaging,” Magn Reson Med, 50(5):1077–1088; 2003.
[16] A. C. Tziortzi, S. N. Haber, G. E. Searle, C. Tsoumpas, C. J. Long, P. Shotbolt, G. Douaud, S. Jbabdi, T. E. J. Behrens, E. A. Rabiner, M. Jenkinson, and R. N. Gunn, “Connectivity-based functional analysis of dopamine release in the striatum using diffusion-weighted MRI and positron emission tomography,” Cerebral Cortex, 24(5):1165–1177; 2014.
[17] K. Hua, J. Zhang, S. Wakana, H. Jiang, X. Li, D. S. Reich, P. A. Calabresi, J. J. Pekar, P. C. M. van Zijl, and S. Mori, “Tract probability maps in stereotaxic spaces: Analyses of white matter anatomy and tract-specific quantification,” NeuroImage, 39(1):336–347; 2008.
[18] J. Diedrichsen, J. H. Balsters, J. Flavell, E. Cussans, and N. Ramnani, “A probabilistic MR atlas of the human cerebellum,” NeuroImage, 46(1):39–46; 2009.
[19] J. L. Lancaster, M. G. Woldorff, L. M. Parsons, M. Liotti, C. S. Freitas, L. Rainey, P. V. Kochunov, D. Nickerson, S. A. Mikiten, and P. T. Fox, “Automated Talairach Atlas labels for functional brain mapping,” Human Brain Mapping, 10(3):120–131; 2000.
[20] M. Krzywinski et al., “Circos: an Information Aesthetic for Comparative Genomics,” Genome Res, 19(604):1639–1645; 2009. (http://circos.ca/intro/genomic_data/)
[21] J. Hagemeier, R. Zivadinov, M. G. Dwyer, P. Polak, N. Bergsland, B. Weinstock-Guttman, J. Zalis, A. Deistung, J. R. Reichenbach, and F. Schweser, “Changes of deep gray matter magnetic susceptibility over 2 years in multiple sclerosis and healthy control brain,” NeuroImage: Clinical (in press).
[22] C. Langkammer, T. Liu, M. Khalil, C. Enzinger, M. Jehna, S. Fuchs, F. Fazekas, Y. Wang, and S. Ropele, “Quantitative susceptibility mapping in multiple sclerosis.” Radiology, 267(2):551–9; 2013.
Figures