Ali Serhal1, Ioannis Koktzoglou2,3, Pascale Aouad1, James Carr1, Shivraman Giri4, Omar Morcos5, and Robert R Edelman1,2
1Radiology, Feinberg School of Medicine, Northwestern University, Chicago, IL, United States, 2Radiology, NorthShore University HealthSystem, Evanston, IL, United States, 3Radiology, Prtizker School of Medicine, University of Chicago, Chicago, IL, United States, 4Siemens Healthineers, Chicago, IL, United States, 5Surgery, NorthShore University HealthSystem, Evanston, IL, United States
Synopsis
A
major deficiency of MR angiography compared with CT angiography (CTA) has been
its inability to detect and characterize peripheral vascular calcifications. Recently, MRI using a proton density-weighted, in-phase stack of stars technique
proved capable of identifying these calcifications. However, the diamagnetic susceptibility and
short T2* of calcifications have the potential to cause clinically relevant, field
strength-dependent changes in lesion appearance with MRI. Since the impact of field strength on the
appearance of vascular calcifications is unknown, we performed a two-center
clinical study which demonstrated that MRI accurately depicts peripheral
vascular calcifications at both 1.5 Tesla and 3.0 Tesla.
Introduction
A
major deficiency of MR angiography compared with CT angiography (CTA) has been
its inability to identify peripheral vascular calcifications. For instance, dense arterial wall
calcifications should be avoided when choosing a percutaneous access site, and
their presence is a major determinant of failure for percutaneous endovascular
aneurysm repair. Recently, MRI using a
proton density-weighted, in-phase stack of stars (PDIP-SOS) technique has
proved capable of detecting these calcifications. Just as the high density of calcifications
can result in artifactual enlargement (“blooming”) with CT, diamagnetic susceptibility and T2* effects have the potential to cause inaccuracies due to field strength-dependent
blooming with MRI. We therefore studied
the influence of magnetic field strength on lesion volumes in a
two-center clinical study.Methods
This
study was IRB approved and informed consent was obtained. The study population consisted of 44 patients
with ilio-femoral vascular calcifications, of whom 24 were imaged at 1.5 Tesla
and 20 at 3.0 Tesla. PDIP-SOS images
were acquired in an oblique coronal plane centered at the level of the common
femoral arteries with scan times of ~7 to 8 minutes. Body and peripheral phased array coils were
used for signal reception. Slice thickness was 1.3-mm at 1.5 Tesla and 1.0-mm
at 3.0 Tesla, with 128 reconstructed slices per 3D slab and in-plane resolution
at both field strengths of 1.0-mm x 1.0-mm prior to interpolation. Between 600 and 660 radial views were
acquired. Sampling bandwidth was 300
Hz/pixel at 1.5 Tesla and 460 Hz/pixel at 3.0 Tesla. The PDIP-SOS images were
processed into thin (4 to 15-mm) minimum intensity projections for qualitative
display of the vascular calcifications.
In addition, nonenhanced quiescent-interval slice-selective (QISS) MRA
of the ilio-femoral vessels was acquired.
Qualitative image analysis as well as quantitative analysis using a
semi-automated technique were performed using CTA as the reference standard.Results
166
vessel segments were analyzed.
Qualitatively, all PDIP-SOS MR images showed good-to-excellent
confidence to detect vascular calcifications, with good inter-reader agreement
(κ=0.73, P<0.001). There was an
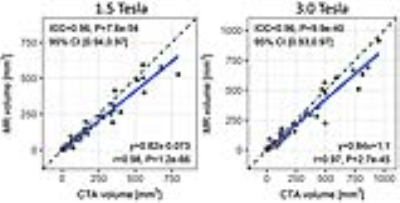
overall excellent correlation (r=0.98, P<0.001) and agreement (intraclass
correlation coefficient=0.96, P<0.001) between PDIP-SOS MRI and CTA measures
of calcification volume, with no overt difference in performance at 1.5 Tesla
vs. 3.0 Tesla. MRI lesion volumes were
slightly lower than those measured for CTA at both field strengths.Discussion and Conclusion
MRI
using a PDIP-SOS pulse sequence is an accurate test for ilio-femoral peripheral
vascular calcifications at both 1.5 Tesla and 3.0 Tesla. Lesion volumes were not substantially different
despite the two-fold variation in magnetic field strength. Our results suggest that PDIP-SOS MRI
provides a reliable alternative to CT for pre-interventional evaluation of
calcium burden at both 1.5 Tesla and 3.0 Tesla.Acknowledgements
NIH grants R01 HL130093 and R21 HL126015.References
1. Ferreira
Botelho MP, Koktzoglou I, Collins JD, Giri S, Carr JC, Gupta N, Edelman
RR. MR imaging of iliofemoral peripheral
vascular calcifications using proton density-weighted, in-phase
three-dimensional stack-of-stars gradient echo.
Magn Reson Med. 2017 Jun;77(6):2146-2152. doi: 10.1002/mrm.26295. Epub
2016 Jun 14.
