3478
DCE-MRI of Intracranial Artery Athoersclerosis: Quantitative Change After 6-month Statin Therapy.1Center for Biomedical Imaging Research, Department of Biomedical Engineering, School of Medicine, Tsinghua university, Beijing, China
Synopsis
Dynamic contrast-enhanced MRI (DCE-MRI) has been proven to be able to quantify the inflammation and neovasculature in the atherosclerotic plaque of carotid artery. However, few studies has focus on the DCE-MRI of intracranial artery atherosclerosis, which is another major cause of cerebral ischemic events. This study found that the Ktrans of intracranial artery calculated from DCE-MRI was significantly lower at follow-up comparing with baseline after 6-month statin therapy, suggesting DCE-MRI a good tool for therapeutic response evaluation for intracranial artery atherosclerosis
Purpose
Dynamic contrast-enhanced MRI (DCE-MRI) has been proven to be able to quantify the inflammation and neovasculature in the atherosclerotic plaque of carotid artery [1]. Higher transfer constant (Ktrans) calculated from pharmacokinetic modeling of carotid DCE-MRI was found to be a risk factor of cardiovascular events [2]. However, carotid plaque, on which many previous studies focus, only responsible for part of the stroke, atherosclerosis of the intracranial artery is another major cause of stroke [3]. Recently, Vakil et al. have studied the DCE-MRI of plaque in intracranial arteries [4]. This study further investigate the quantitative change of the intracranial plaque after 6-month statin therapy with black-blood DCE-MRI technique.Methods
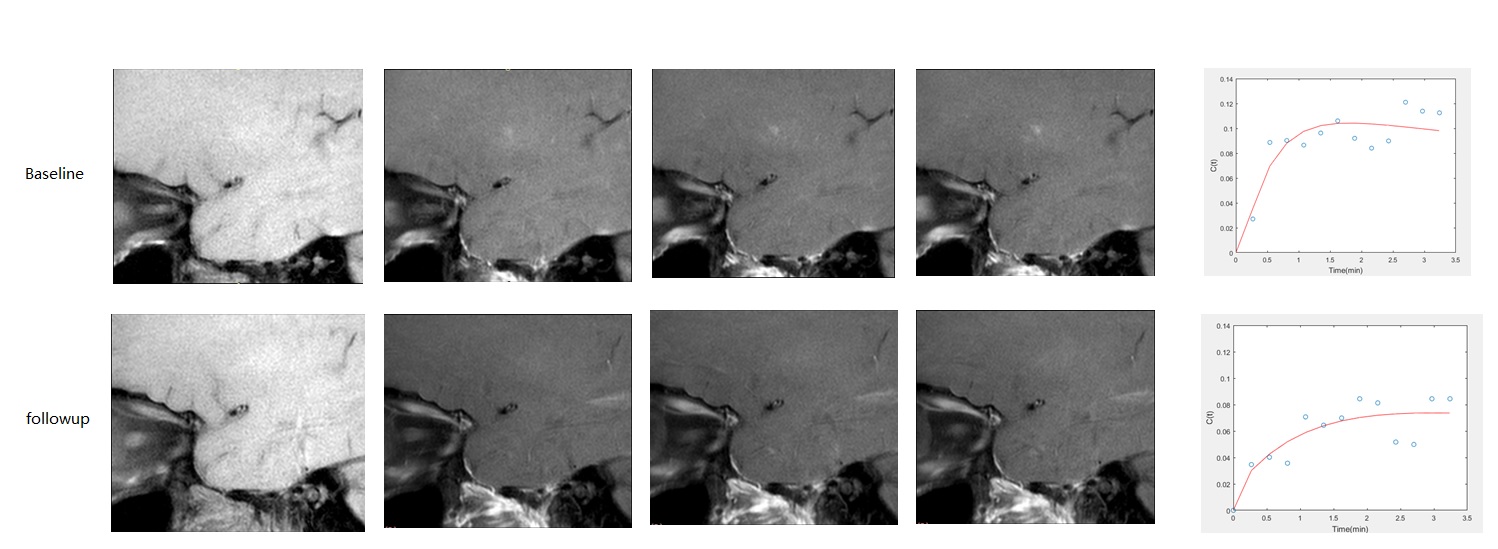
Fifteen patients with stroke or transient ischemic attack (TIA) happened within 10 days and an intracranial plaque found in middle cerebral artery (MCA) considered to be responsible were enrolled in this study. All the patients were imaged twice by a turbo spin-echo (TSE) black-blood DCE-MRI sequence on a 3T whole body MR scanner (Philips TX) with a head coil. The first scan was carried out within 10 days of the first ischemic event, and the second scan was acquired at six months later. During this period, all patients were under statin therapy. The imaging parameters were: slice number=1, slice thickness=5 mm, TR/TE=900/7 ms, in-plane resolution=0.6 mm, temporal resolution=16.2 s, phases=15, total acquisition time = 243s. During the DCE acquisition, 0.1mmol/kg Gd-DTPA were injected with a power injector at 2ml/s coincident with the third phase. Both DCE imaging was done perpendicular to the MCA and at the location with most severe stenosis. In the image analysis, the vessel walls were manually outlined blind to the time-point and patient information. The mean intensity curve of the vessel wall were then calculated. Then, the Ktrans was calculated by the Patlak model [5]. A population AIF consistent with a traditional biexponential equation [6] was used. The concentration curve of intracranial vessel wall was converted from intensity based on assumed preconstrast T1 (1150 ms) and signal equation [7]. The Ktrans value of all the patients at the baseline scan and 6-month follow-up were reported and compared using paired t-test.Results
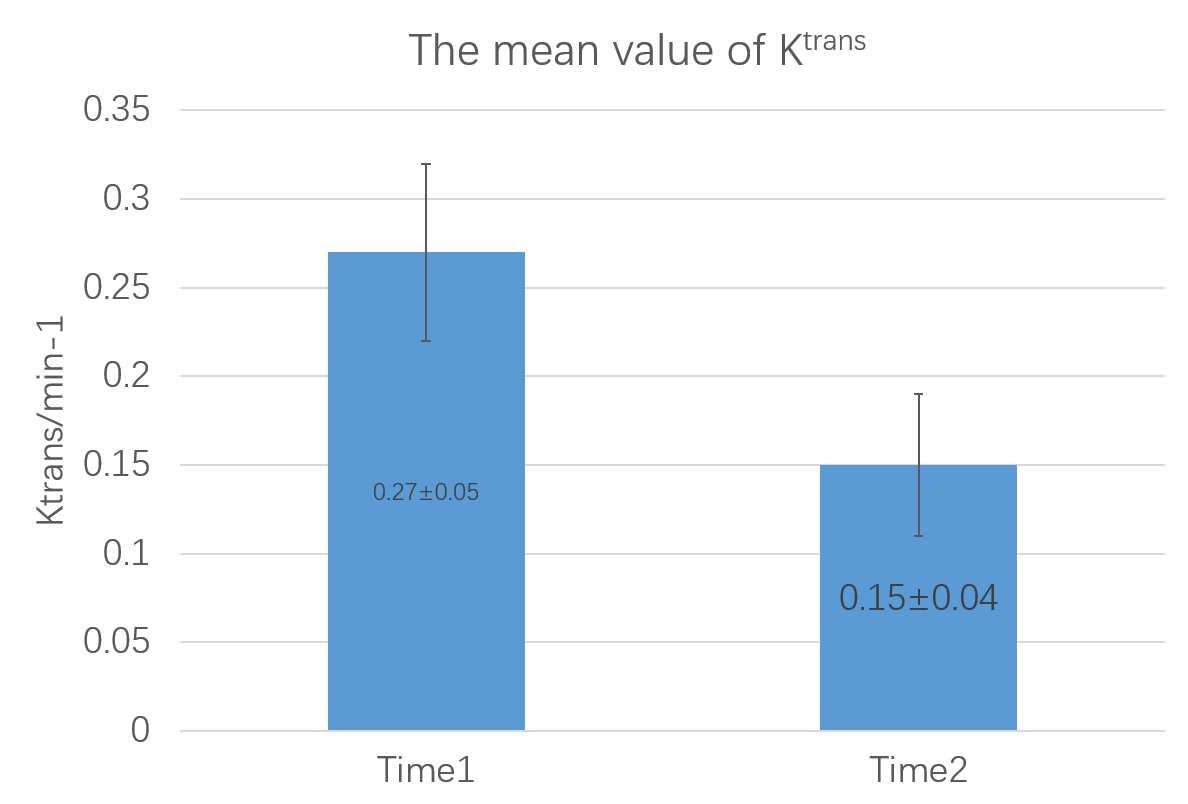
The images and intensity curve of an example case were shown in Fig.1 The enhancement of the follow-up scan was obvious lower. Overall, significant decreased Ktrans can be observed at the follow-up after the patients having statin therapy for 6-month, comparing with the base-line scan (mean: 0.27±0.05 min-1 vs. 0.15±0.04 min-1, p<0.001), as shown in Fig. 2.Discussion and Conclusion
In this study, we found that the Ktrans of intracranial artery calculated from DCE-MRI was significantly lower at follow-up comparing with baseline after 6-month statin therapy. Previous study [8] showed that 1-year statin therapy can reduce the neovasculature in carotid plaque. Although the physiological meaning of the Ktrans still needs further histological investigation, it may be related to the angiogenesis of plaque, according to the experience in carotid artery plaque [1]. If so, the results of this study suggested that the statin therapy also can reduce the neovasculature in intracranial plaque. Also, this change can be observed within only 6-month, indicating that the DCE-MRI can detect very early change in intracranial plaque. Thus, the DCE-MRI could be a useful tool in therapeutic response evaluation for intracranial artery atherosclerosis.Acknowledgements
NoneReferences
[1] Kerwin WS, Oikawa M, Yuan C, Jarvik GP, Hatsukami TS. MR imaging of adventitial vasa vasorum in carotid atherosclerosis. Magn Reson Med 2008;59:507-14.
[2] Wang J, Chen H, Sun J, Hippe DS, Zhang H, Yu S, Cai J, Xie L, Cui B, Yuan C, Zhao X, Yuan W, Liu H. Dynamic contrast-enhanced MR imaging of carotid vasa vasorum in relation to coronary and cerebrovascular events. Atherosclerosis. 2017;263:420-426
[3] Qiao Y, Suri FK, Zhang Y, Liu L, Gottesman R, Alonso A, Guallar E, Wasserman BA.Racial Differences in Prevalence and Risk for Intracranial Atherosclerosis in a US Community-Based Population.JAMA Cardiol.2017 Nov 1. doi: 10.1001/jamacardio.2017.4041. [Epub ahead of print]
[4] Vakil P, Elmokadem A H, Syed F H, et al. Quantifying Intracranial Plaque Permeability with Dynamic Contrast-Enhanced MRI: A Pilot Study[J]. Ajnr American Journal of Neuroradiology, 2016, 38(2):243.
[5] Patlak CS, Blasberg RG, Fenstermacher JD. Graphical evaluation of blood-to-brain transfer constants from multiple-time uptake data. J Cereb Blood Flow Metab 1983;3:1–7.
[6] Jaspers K, Aerts HJ, Leiner T, Oostendorp M, van Riel NA, Post MJ, Backes WH. Reliability of pharmacokinetic parameters: small vs. medium-sized contrast agents. Magn Reson Med 2009;62:779–787.
[7] Tofts PS. Modeling tracer kinetics in dynamic Gd-DTPA MR imaging. J Magn Reson Imaging 1997;7:91–101.
[8] Dong L, Kerwin WS, Chen H, et al. Carotid Artery Atherosclerosis: Effect of Intensive Lipid Therapy on the Vasa Vasorum--Evaluation by Using Dynamic Contrast-enhanced MR Imaging. Radiology 2011;260:224-31.
Figures