3475
Quantification of endothelial permeability in the mouse aortic root with 3D self-gated T1 mapping: disease progression and treatment with statins1Translational and Molecular Imaging Institute, Icahn School of Medicine at Mount Sinai, New York, NY, United States, 2Biomedical Engineering and Physics, Academic Medical Center, Amsterdam, Netherlands
Synopsis
Quantification of endothelial permeability in the mouse aortic root with 3D self-gated T1 mapping: disease progression and treatment with statins
Introduction
Endothelial dysfunction and increased endothelial permeability play an important role in all stages of atherogenesis, from disease initiation, to the final stages of plaque hemorrhage and thrombosis, leading to major cardiovascular events (1,2). The development and validation of non-invasive MR imaging techniques to quantify these parameters in vivo may greatly improve our current ability to stratify the risk of cardiovascular event associated with specific plaque phenotypes and is currently an active area of research (3). Here, we investigate the quantification of endothelial permeability in the aortic root of atherosclerotic mice using 3D, black blood self-gated T1 mapping (4,5) before and after injection of a gadolinium (Gd) based contrast agent.Methods
Animal model and study design. Seven-week-old male ApoE -/- mice
(n= 14) were fed a high-fat diet (HFD) for 8 weeks, after which animals were randomized
into two groups: 1) controls (n=8), continuing on HFD for 16 weeks; 3) statin
treated (n=6), fed medicated HFD with atorvastatin (10mg/kg/day) for 16 weeks. All animals were imaged before HFD initiation
(0W time point), and at end of study (24W time point).
Image acquisition. Imaging was performed on a 7T preclinical MRI
scanner. Endothelial permeability was quantified
using a 3D, self-gated gradient recalled echo (GRE) sequence with variable flip
angles (2, 5, 8, 11 and 14°) for T1 mapping, before and ~30 minutes after
injection of 0.3 mmol/Kg of gadopentetate dimeglumine. Imaging parameters were:
slice thickness 0.3mm with a spatial resolution of 0.117x0.117mm2,
echo time 1.7ms, repetition time 7.6ms defining a 6 cardiac cycles sequence
with 20 slices per cardiac cycle. Image
analysis. For each flip angle series acquired before and after contrast
agent injection, an experienced observer traced the inner and outer boundary of
the aortic root (Figure 1), and a
region of interest (ROI) in the background noise. Aortic root ROI signal intensity at each flip
angle acquisition was used to calculate R1 (s-1) values before and
after contrast agent injection using the DESPOT method (6). Aortic root signal to noise ratio
(SNR) was calculated both pre and post contrast agent injection, by dividing
ROI signal in the vessel wall by noise standard deviation. Pre and post
contrast R1 values (R1pre and R1post, Figure 3), and the
ratios R1post/R1pre (R1_Ratio, Figure 3) and SNRpost/SNRpre
(SNR_Ratio, Figure 3) were
compared within each group of mice between the 0 and 24 weeks time points, and
at 24 weeks between statin-treated and untreated mice. Statistical analyses
were performed, using paired Student test to compare R1pre, R1post
, R1_Ratio, and SNR_Ratio within each group between the 0 and 24 weeks
time points. Unpaired Student t tests were used to compare the same variables at
24 weeks between statin-treated and untreated mice. P values <0.05 were used
to define statistical significance. Significant differences are indicated in
the Figures with a star (*).
Results
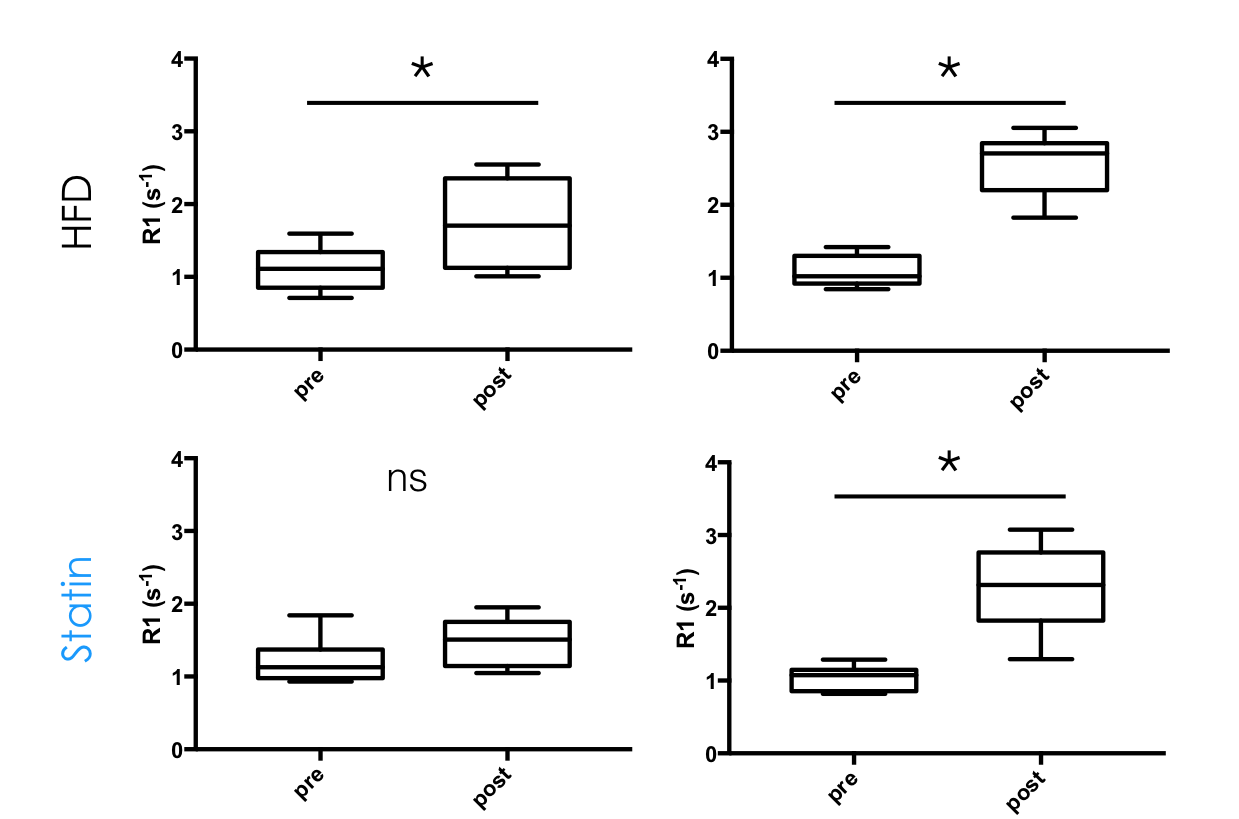
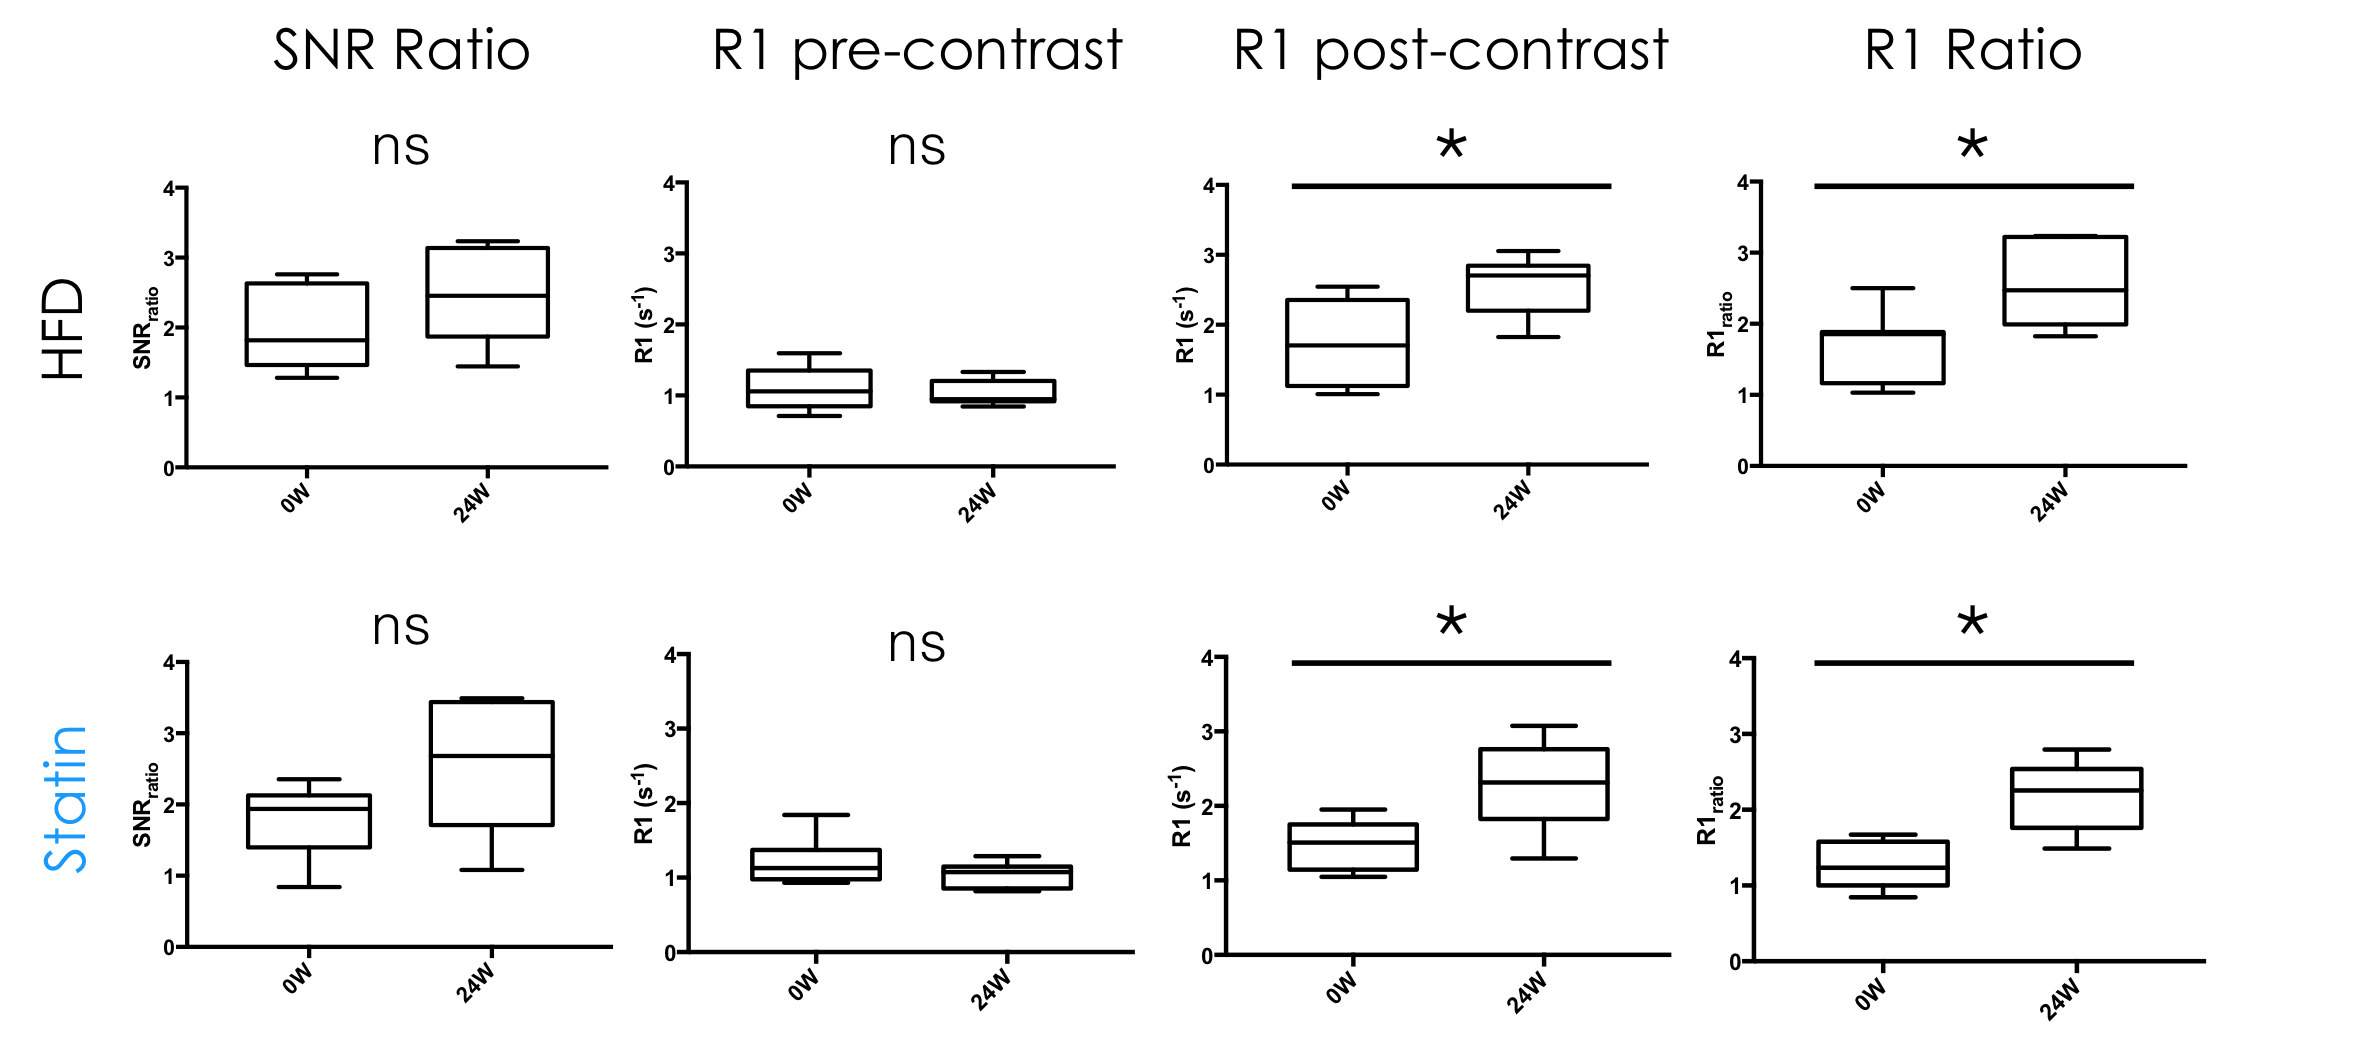
Post-contrast R1 values were consistently higher than pre-contrast values for all groups, and at all time points (Figure 2), indicating extravasation of contrast agent in the aortic root. Post to pre-contrast SNR ratio, and pre-contrast R1 were not significantly different between 0 and 24 weeks for both groups. Post-contrast R1 (p=0.0102 for HFD and p=0.0255 for statin) and post to pre-contrast R1 ratio (p=0.0053 for HFD and p=0.0059 for statin) were significantly different between 0 and 24 weeks for both HFD and statin groups (Figure 3), indicating higher contrast agent extravasation in older mice. At 24 weeks SNR ratio and pre-contrast R1 were similar between HFD and statin treated group, while post-contrast R1 and post to pre contrast R1 ratio were lower in the statin treated group (Figure 4), indicative of lower contrast agent extravasation and endothelial permeability, although the difference was not statistically significant.Discussion
This study suggests that 3D, self-gated, black blood T1 mapping after contrast agent injection is a promising technique to measure endothelial permeability in the aortic root of ApoE-/- atherosclerotic mice. Other studies in the literature investigating permeability in the mouse brachiocephalic artery, have used prospectively ECG triggered, bright blood acquisitions (7,8). Compared to these approaches, the technique that we propose allows for better vessel lumen/wall delineation of the mouse aortic root throughout the cardiac cycle, thereby allowing to quantify permeability in this challenging and important vascular territory. Compared to studies in humans, or larger animal models, we foresee that developing and validating the quantification of endothelial permeability by MRI in atherosclerotic mice will allow us to investigate in greater detail its relationship with the genetic, molecular and cellular make up of atherosclerotic plaques during the various stages of disease development, and after therapeutic intervention.Acknowledgements
The authors would like to acknoledge the Société Française de Chirurgie Vasculaire et Endovasculaire for the support of a part of the study.References
1. MacIsaac AI, Thomas JD, Topol EJ. Toward the quiescent coronary plaque. J Am Coll Cardiol. 1993 Oct; (4):1228–41.
2. Davignon J, Ganz P. Role of endothelial dysfunction in atherosclerosis. Circulation. 2004 Jun 15;109(23 Suppl 1):III27-32.
3. van Hoof RHM, Heeneman S, Wildberger JE, Kooi ME. Dynamic Contrast-Enhanced MRI to Study Atherosclerotic Plaque Microvasculature. Curr Atheroscler Rep. 2016 Jun;18(6):33.
4. Coolen BF, Geelen T, Paulis LEM, Nicolay K, Strijkers GJ. Regional contrast agent quantification in a mouse model of myocardial infarction using 3D cardiac T1 mapping. J Cardiovasc Magn Reson Off J Soc Cardiovasc Magn Reson. 2011 Oct 5;13:56.
5. Vandoorne K, Vandsburger MH, Jacobs I, Han Y, Dafni H, Nicolay K, et al. Noninvasive mapping of endothelial dysfunction in myocardial ischemia by magnetic resonance imaging using an albumin-based contrast agent. NMR Biomed. 2016 Nov;29(11):1500–10.
6. Coolen BF, Geelen T, Paulis LEM, Nauerth A, Nicolay K, Strijkers GJ. Three-dimensional T1 mapping of the mouse heart using variable flip angle steady-state MR imaging. NMR Biomed. 2011 Feb;24(2):154–62.
7. Phinikaridou A, Andia ME, Lavin B, Smith A, Saha P, Botnar RM. Increased Vascular Permeability Measured With an Albumin-Binding Magnetic Resonance Contrast Agent Is a Surrogate Marker of Rupture-Prone Atherosclerotic Plaque. Circ Cardiovasc Imaging. 2016 Dec;9(12).
8. Bar A, Skórka T, Jasiński K, Sternak M, Bartel Ż, Tyrankiewicz U, et al. Retrospectively gated MRI for in vivo assessment of endothelium-dependent vasodilatation and endothelial permeability in murine models of endothelial dysfunction. NMR Biomed. 2016 Aug (8):1088–97.
Figures
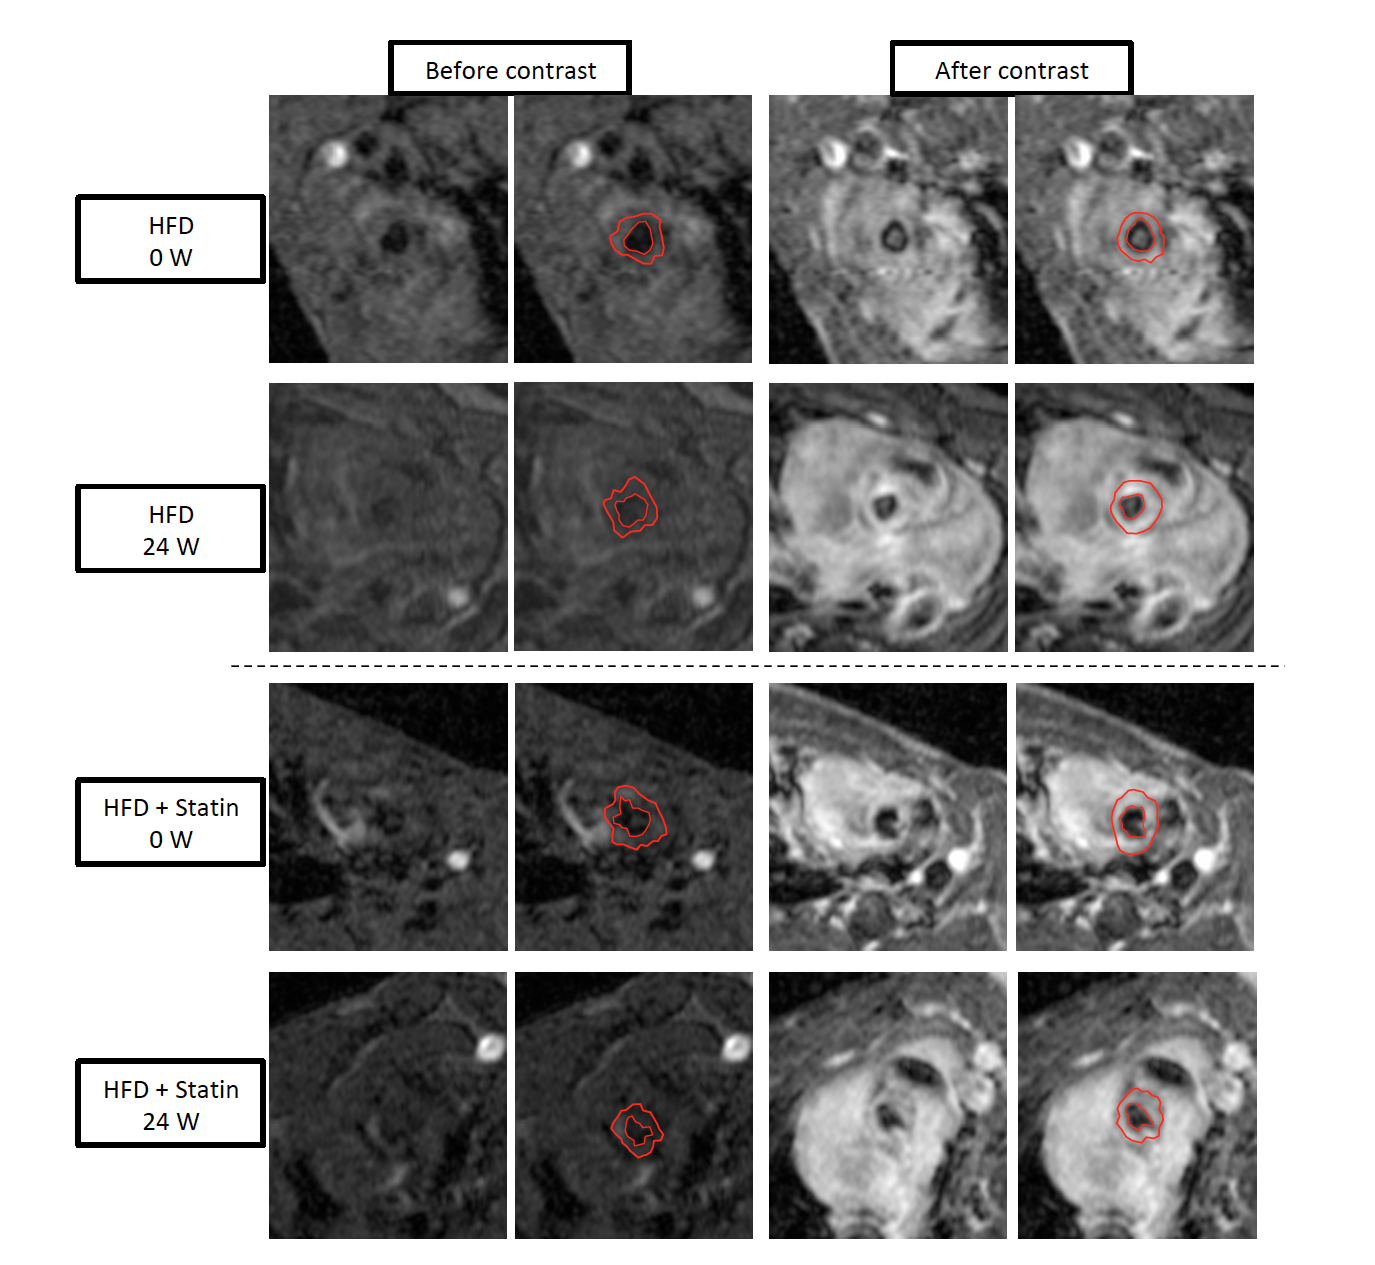
Aortic Root at 0 and 24 weeks after HFD induction, with and without treatment by statin, before and after injection of gadolinium.