3473
Does the amount of signal change depend on calcium concentration in lipid-rich core plaque?1Institute of Biomedical Sciences, Tokushima University Graduate School, Tokushima, Japan, 2School of Health Sciences, Tokushima University, Tokushima, Japan, 3Institute of Medical, Pharmaceutical and Health Sciences, Kanazawa University, Kanazawa, Japan, 4Global MR Applications and Workflow, GE Healthcare Japan, Hino, Japan, 5GE Healthcare, San Diego, CA, United States, 6Graduate school of Health Science, Tokushima University, Tokushima, Japan
Synopsis
The purpose of this study was to quantitatively detect calcification in LRNC plaques using multi-component analysis with UTE imaging. A phantom experiment was performed using a four echo-UTE sequence. The phantom consists of six different concentrations of hydroxyapatite (as calcification) and mayonnaise (as a lipid). The bi-exponential analysis with UTE enabled a split into two components of short- and long T2*successfully. R2* derived from each dataset increased with increasing concentrations of hydroxyapatite. In conclusion, multi-component T2* analysis with UTE makes it possible to evaluate calcification in atherosclerotic plaques.
Introduction
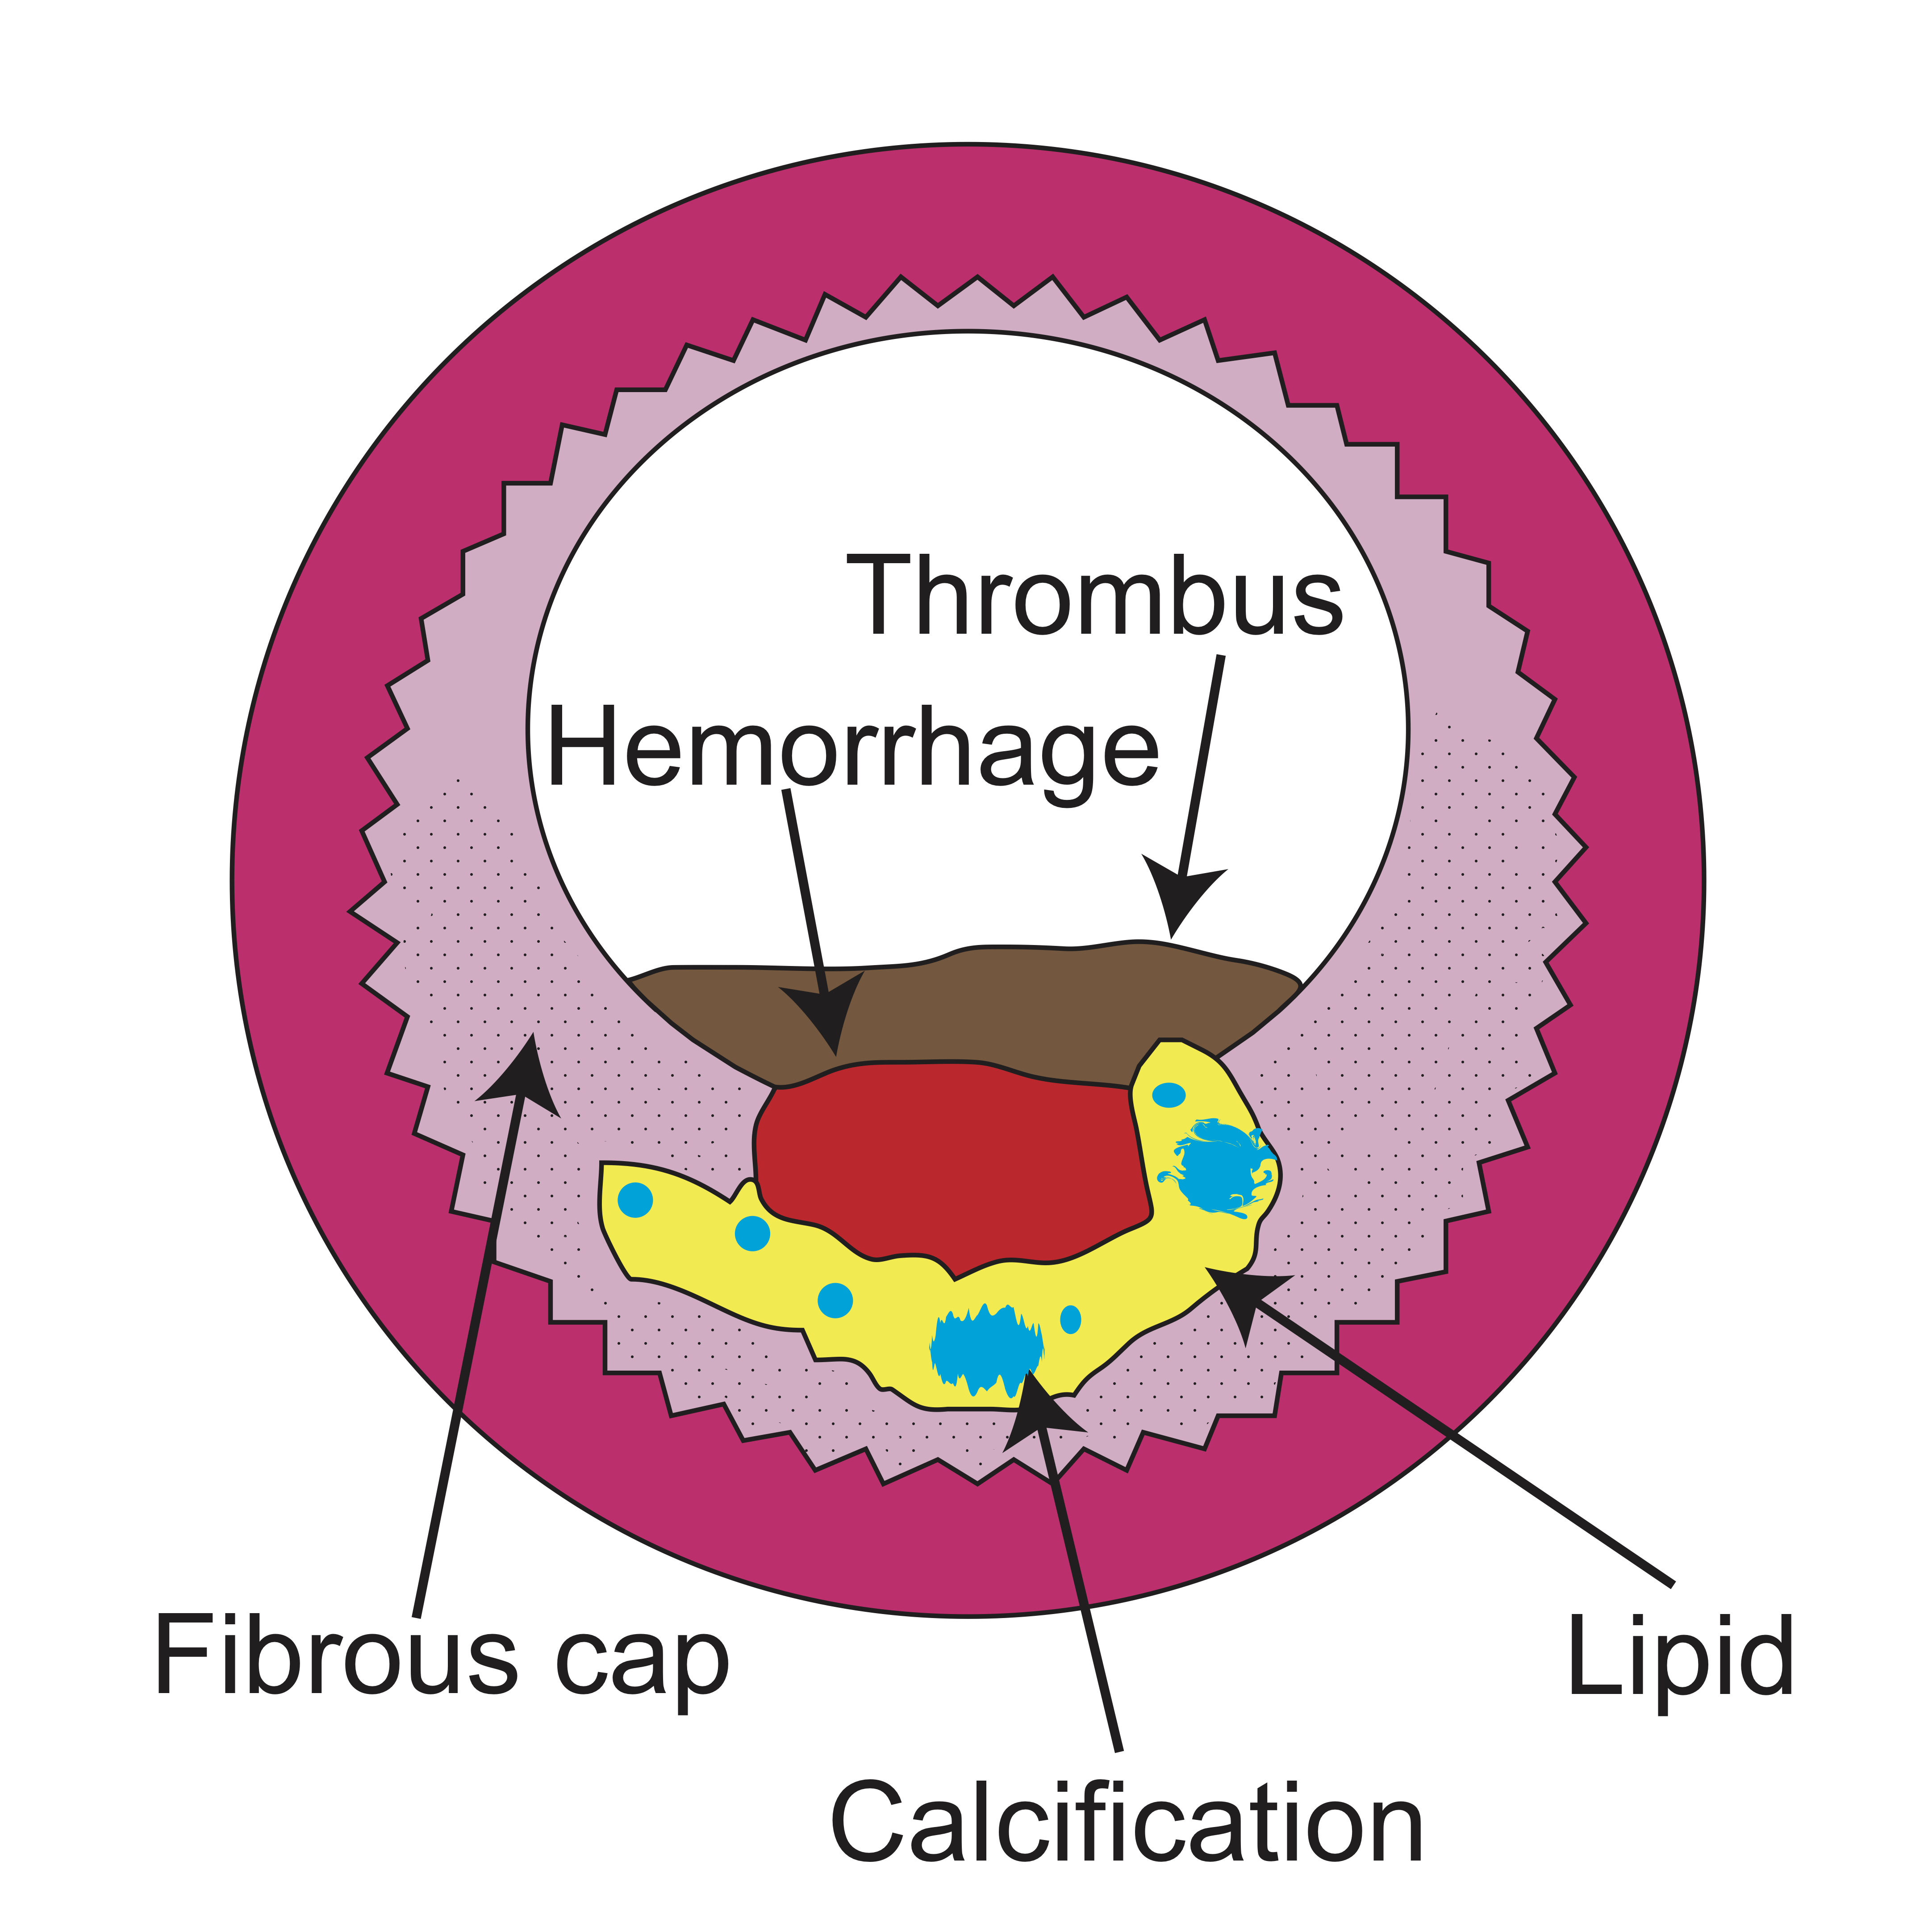
Detecting and determining the characteristics of advanced atherosclerotic lesions, i.e., atherosclerotic plaque, is important to avoid occurrence of secondary disease, e.g., cerebral infarction and myocardial infarction. There are various magnetic resonance (MR) signal patterns based on the histological properties of each atherosclerotic plaque; among these, high risk plaques consist of lipid and calcium, i.e., lipid rich necrotic core (LRNC). Figure 1 shows an illustration of a cross-sectional view of an LRNC plaque. Recently, application of ultrashort echo time (UTE) MR imaging has enabled the detection of plaque calcification in coronary arteries1; the signal pattern with UTE MR imaging of calcification, LRNC, and fibrotic plaque show up as an isointense descriptor. The presence of calcium with UTE MR imaging at ex-vivo carotid atherosclerotic plaques has 71% sensitivity and 96% specificity.2 Atherosclerotic plaque may cause the MR signal attenuation of other components including intra-pixel, e.g., LRNC, intra-plaque hemorrhage (IPH); these signals show various patterns in each MR contrast image according to the density of each material in a pixel. However, the degree of signal attenuation caused from calcification has not been evaluated in detail.Purpose
To detect calcification in LRNC plaque, we evaluated the relationship between the change in relaxation times and concentrations of hydroxyapatite by means of multi-component analysis with UTE imaging.Materials and Methods
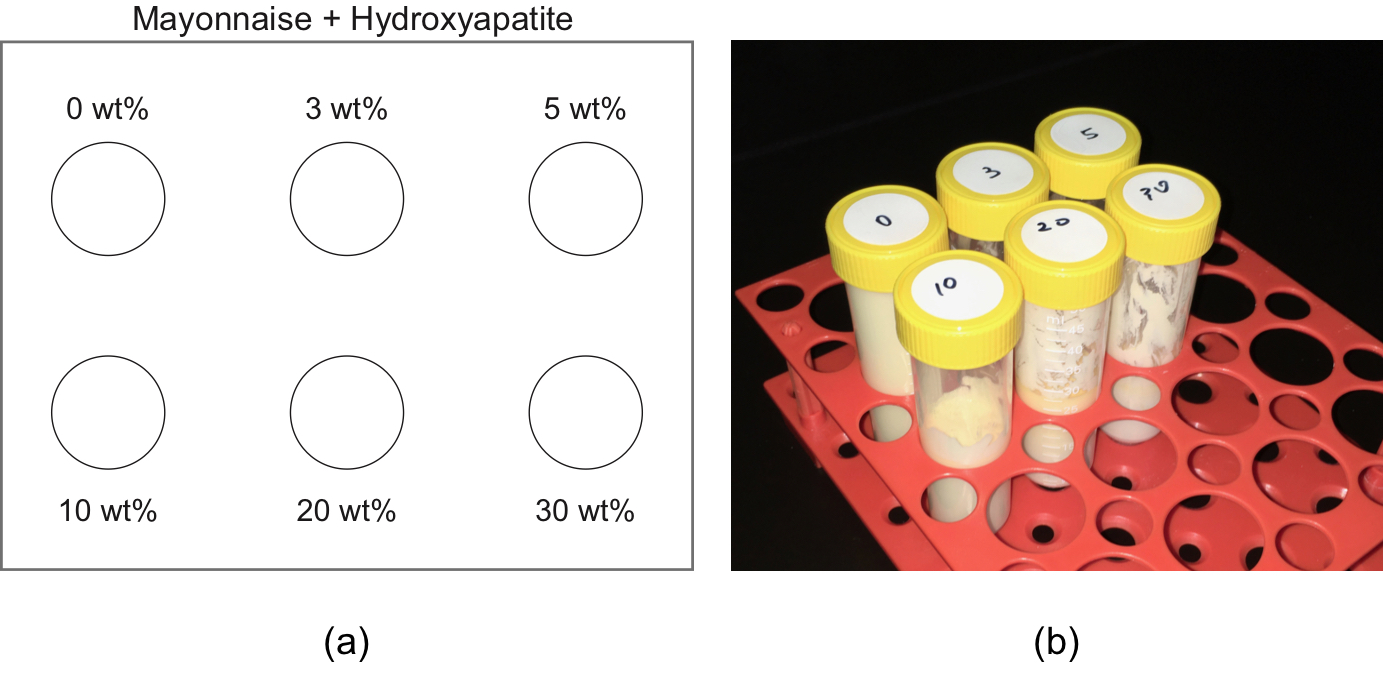
We performed a phantom experiment. The phantom was created from a set of six samples in a cylindrical vessel. These samples were composed of mayonnaise as lipid and hydroxyapatite as calcium; the concentration of hydroxyapatite varied from 0, 3, 5, 10, 20 and 30 wt%. Figure 2 shows the schematic drawing of the phantom components and photograph. On a 3.0 T MR system (Discovery 750, GE Healthcare), UTE imaging was performed using a spiral three-dimensional spoiled gradient-echo (3D-SPGR) sequence.3 The imaging parameters were as follows: TE, four echoes (0.032, 3.2, 6.4, and 18.0 ms); repetition time (TR), 26.6 ms; flip angle (FA), 18 degrees; bandwidth (BW), 488 Hz/pixel; slice thickness, 2 mm; matrix size, 256; field of view, 256 mm. Moreover, conventional multi-echo data were acquired with 3D-SPGR with the following parameters; TR, 27.9 ms; ΔTE, 1.6 ms (total, 16 echoes); FA, 15 degrees; BW, 977 Hz/pixel; other parameters were equal to UTE. After the multi-echo data were acquired, bi-exponential fitting of $$$T_2^*$$$ relaxation times of short- and long- components ($$$T_{2,short}^*$$$, $$$T_{2,long}^*$$$) at each pixel was performed using following equations:
$$I\left(TE\right)=I_{short}\exp\left(-\frac{TE}{T_{2,short}^*}\right)+I_{long}\exp\left(-\frac{TE}{T_{2,long}^*}\right) $$,
$$\therefore \left[I_{short},I_{long},T_{2,short}^*, T_{2,long}^* \right]=arg\min_{I_{short},I_{long},T_{2,short}^*, T_{2,long}^* }\left(\sum_{i=1}^{N_{TE}}\left(\left(i\left(TE\right)_{i}-I\left(TE\right)_{i},\alpha_{i}\right)^{2}\right)\right)$$,
where $$$I\left(TE\right)$$$ is the MR signal of each TE, $$$T_{2,short}^*$$$ and $$$T_{2,long}^*$$$ are the short- and long-component signals, respectively, and $$$i\left(TE\right)$$$ is the theoretical signal value. Then, using varying α values, a nonlinear curve fitting procedure could yield an estimation of parameters ($$$I_{short},I_{long},T_{2,short}^*, T_{2,long}^*$$$ ) based on the relationship between MR signal and TE. Then, the Trust-region-reflective algorithm method was used for nonlinear curve fitting. In addition, mono-exponential fitting was performed for each dataset.4 These fittings were applied to each voxel. After setting regions of interests for each sample, we measured signals and T2* values. Then, each multi-echo method was compared between probability density functions (PDF) derived from each dataset.
Results and Discussion
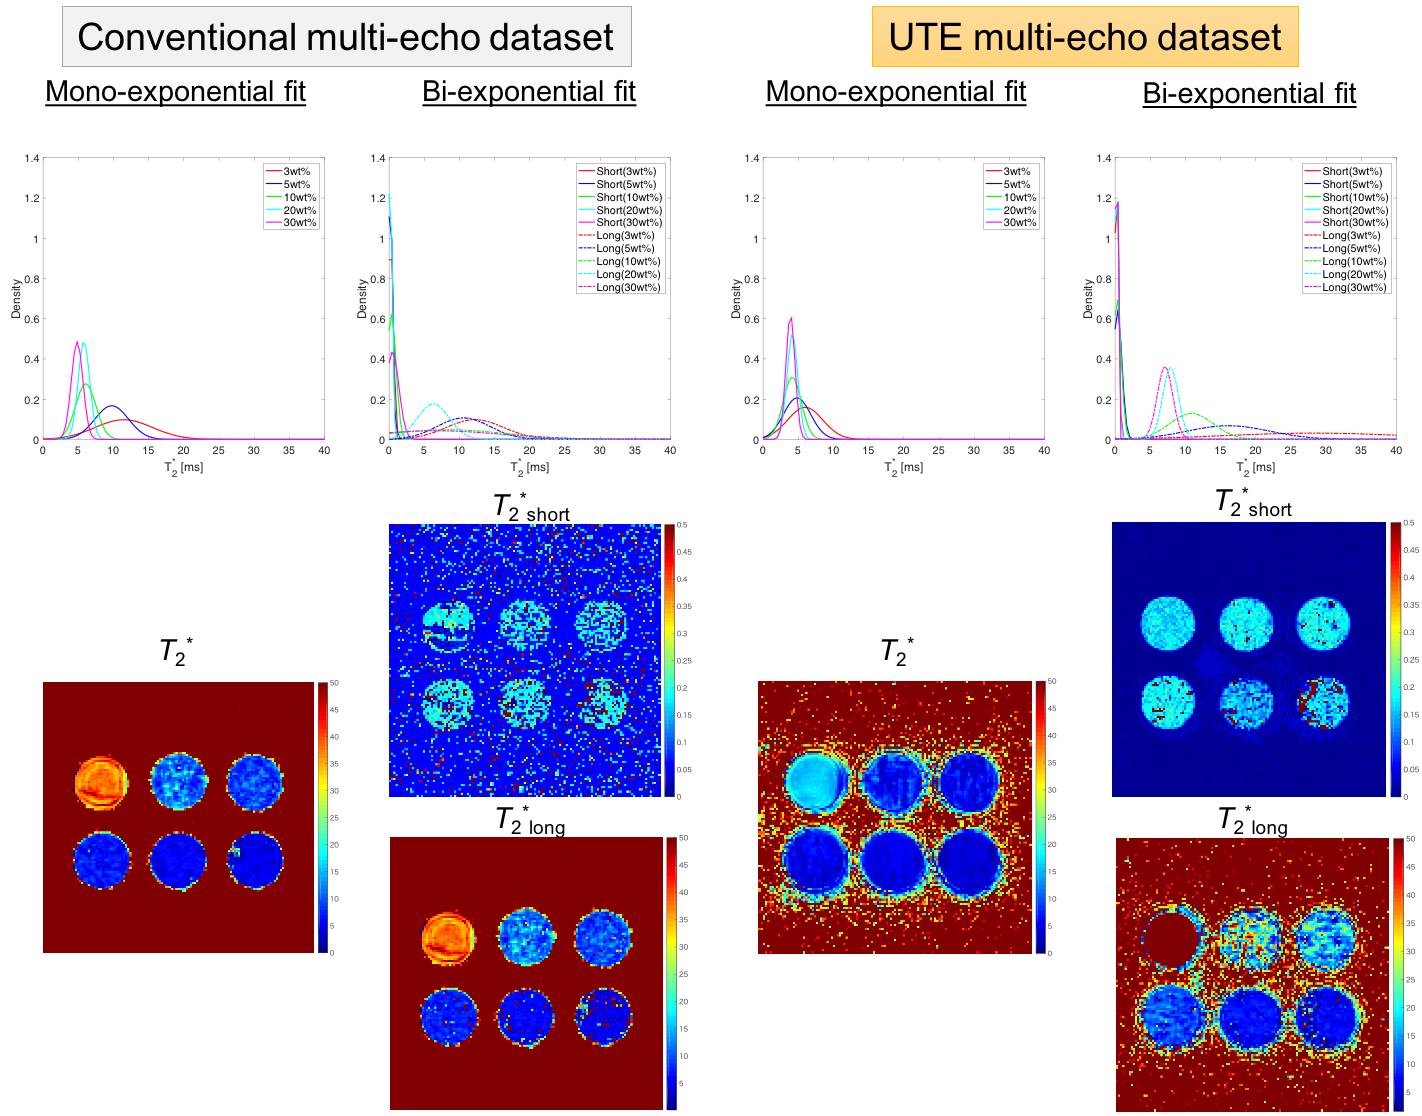
Table 1 summarizes measured T2* values of mono- and multi- component analysis with UTE and conventional multi-echo data, respectively. Figure 3 shows T2* map and a probability density distribution curve calculated from mono- and multi- component analysis with conventional multi-echo and UTE dataset, respectively. Figure 4 shows the relationship between concentration of hydroxyapatite and measured R2* of the phantom. The bi-exponential analysis with UTE enabled a split into two components $$$T_{2,short}^*$$$ and $$$T_{2,long}^*$$$; the result is better than that achieved with the conventional multi-echo method. R2*derived from each dataset increased with increasing concentrations of hydroxyapatite. $$$I_{short}$$$ and $$$I_{long}$$$ also changed with concentration of component. The result indicates that calcification may affect signal attenuation of LRNC when a component of interest includes hydroxyapatite and a short T2* is obtained.Conclusion
Multi-component T2* analysis with UTE makes it possible to evaluate of calcification of atherosclerotic plaques.Acknowledgements
No acknowledgement found.References
- Károlyi M, Seifarth H, Liew G, Schlett CL, Maurovich-Horvat P, Stolzmann P, Dai G, Huang S, Goergen CJ, Nakano M, Otsuka F, Virmani R, Hoffmann U, Sosnovik DE. Classification of coronary atherosclerotic plaques ex vivo with T1, T2, and ultrashort echo time CMR. JACC Cardiovasc Imaging. 2013;6(4):466-74.
- Chan CF, Keenan NG, Nielles-Vallespin S, Gatehouse P, Sheppard MN, Boyle JJ, Pennell DJ, Firmin DN. Ultra-short echo time cardiovascular magnetic resonance of atherosclerotic carotid plaque. J Cardiovasc Magn Reson. 2010;12:17.
- Carl M, Chiang JT. Investigations of the origin of phase differences seen with ultrashort TE imaging of short T2 meniscal tissue. Magn Reson Med. 2012;67(4):991-1003.
- Kanazawa Y, Harada M, Miyoshi M, Matsumoto Y, Hayashi H, Sasaki T, Ikemitsu N, Carl M. Dura Mater imaging with UTE T2* Mapping. Proceedings of the 25th Annual Meeting of ISMRM. 2017;4646.
Figures