3472
A Phantom Study to Compare the Theoretical Accuracy and Precision of CT Angiography versus Radial MRI for the Assessment of Coronary Endothelial Function1Diagnostic and Interventional Radiology, Lausanne University Hospital (CHUV and UNIL), Lausanne, Switzerland, 2Center for Biomedical Imaging (CIBM), Lausanne, Switzerland, 3Direction des Constructions, Ingénierie, Technique et Sécurité (CIT-S), Lausanne University Hospital (CHUV and UNIL), Lausanne, Switzerland, 4Institute of Radiation Physics, Lausanne University Hospital (CHUV and UNIL), Lausanne, Switzerland
Synopsis
CT angiography (CTA) and MRI are non-invasive imaging modalities to assess coronary endothelial function (CEF). However, the performance of these techniques has yet to be quantitatively compared. Images of an in vitro phantom that simulates a physiological range of coronary artery cross-sectional areas (CSAs) were acquired using both CTA and MRI. CSAs were automatically measured and compared to the known nominal values. Statistical analysis suggests that MRI is capable of detecting significantly smaller CSA differences than CTA (2.25±0.80% vs. 7.42±0.63% for a 3-mm baseline diameter; p<0.0001), which is well within the range of physiological vasomotor responses of proximal coronary arteries.
Introduction
Measurements of coronary artery vasomotor responses to endothelium-dependent stressors can be used as a surrogate of coronary endothelial function (CEF), and offer a window into the fundamental pathophysiology of coronary artery disease progression.1-4 Recent studies have demonstrated that MRI can be used to measure small cross-sectional area (CSA) changes of coronary arteries in response to stress, and thus to discriminate normal from abnormal CEF.5-8 While the feasibility of measuring coronary vasomotor response with CT has also been investigated,9 the performance of CT angiography (CTA) has yet to be quantitatively determined and compared with MRI. Because CTA offers higher spatial resolution than MRI, we hypothesized that CTA would also enable more precise and accurate measurements of coronary artery CSA. Therefore, our objectives were first to determine the optimal coronary CTA protocol for CEF assessment in vitro, and secondly to compare its performance to a previously validated radial MRI technique.10Methods
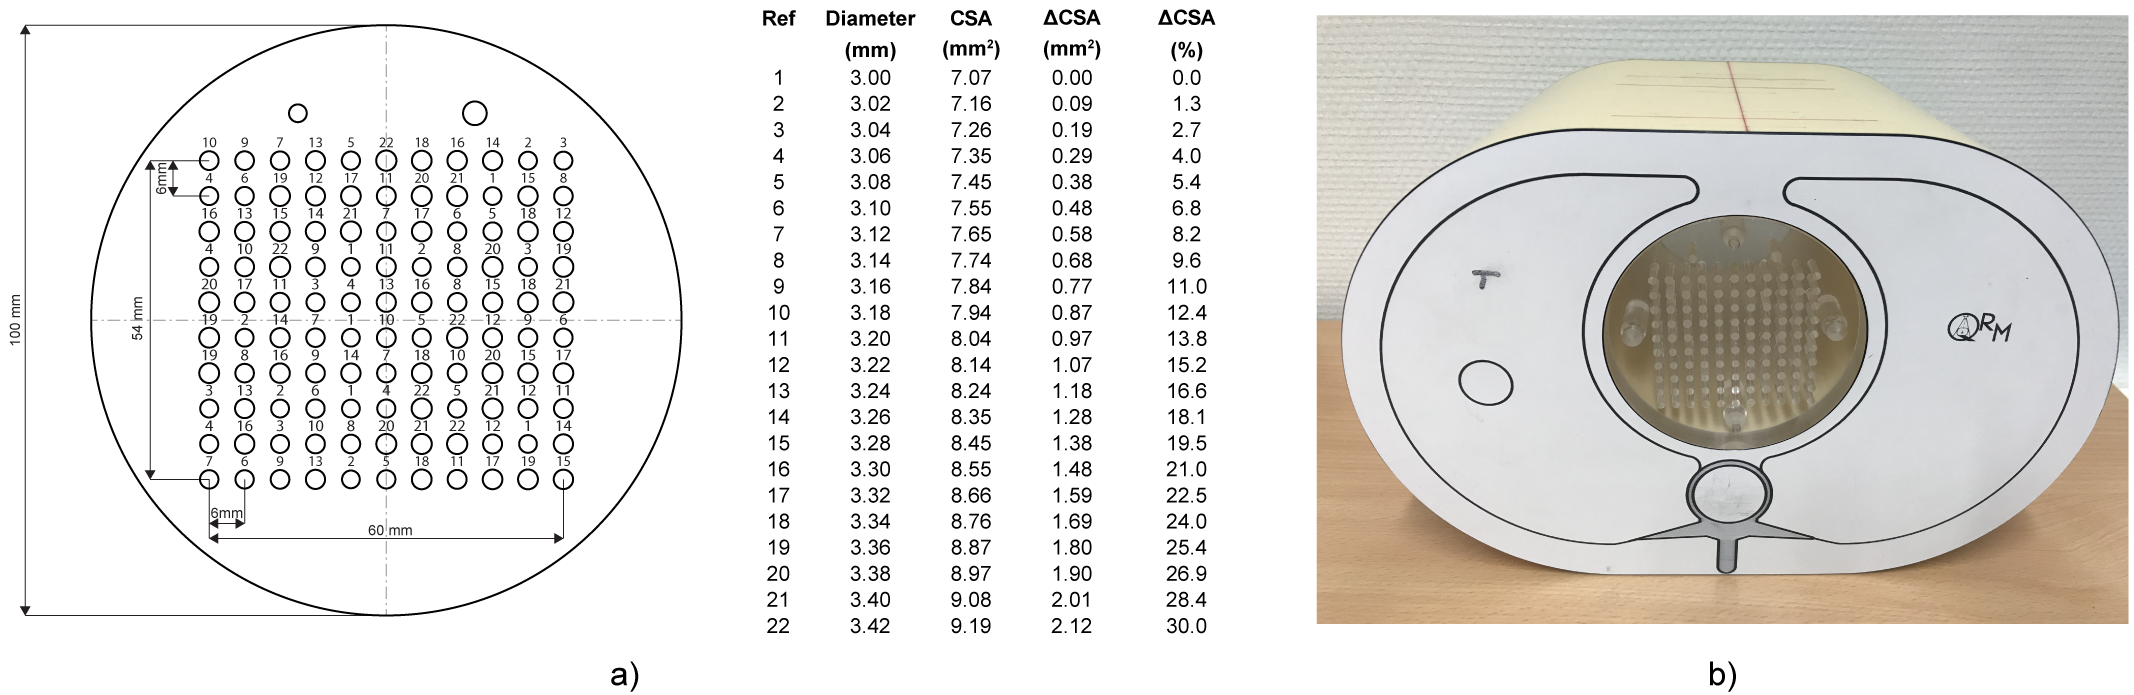
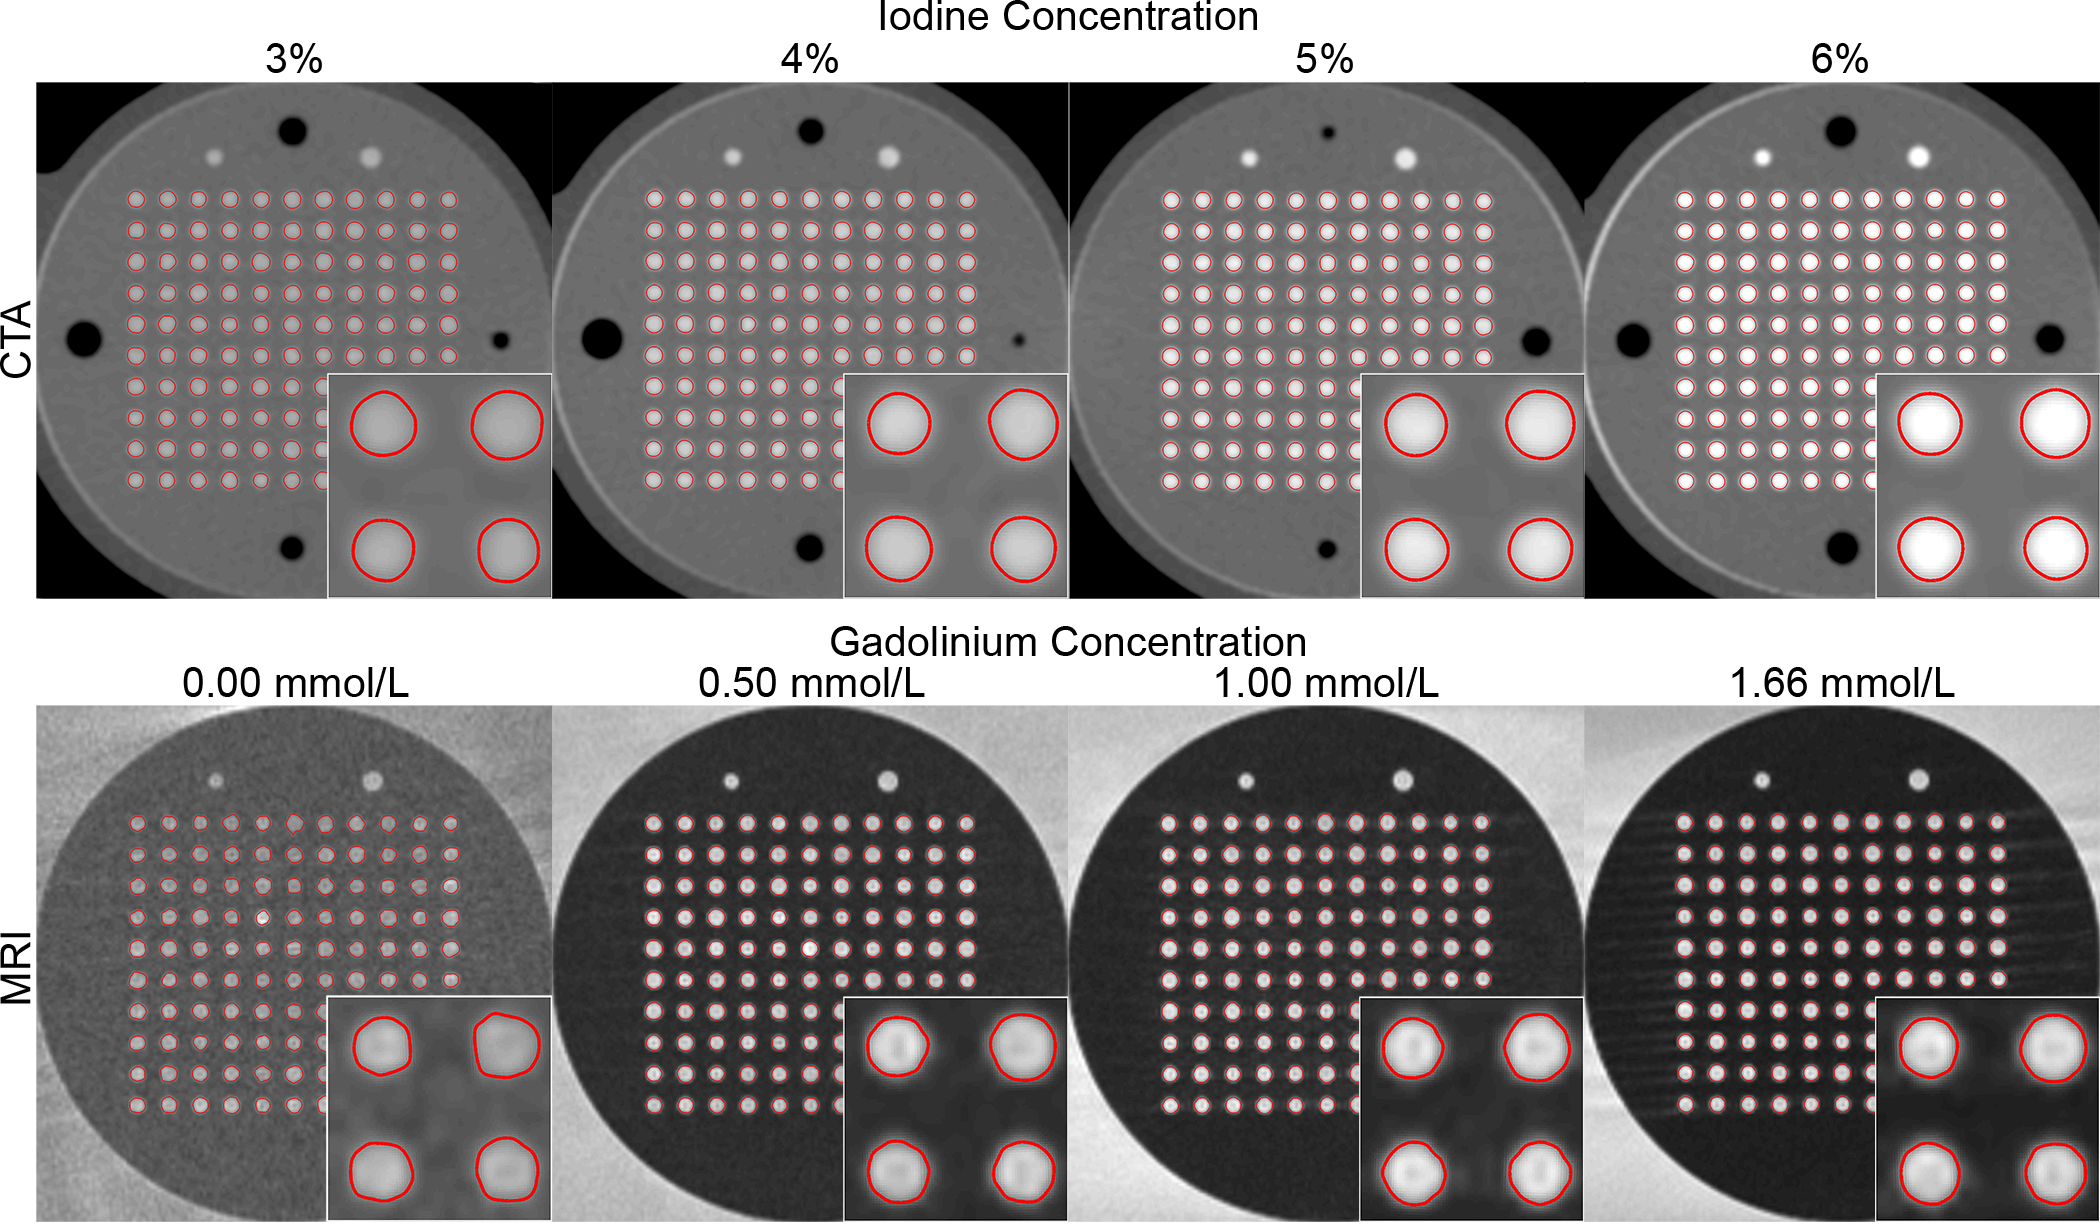
Phantom setup: To test our hypothesis, a polymethyl methacrylate (PMMA) resolution phantom was designed to simulate various vasomotor responses ranging from 3.00mm to 3.42mm (Fig.1a). For CTA, the PMMA resolution phantom was inserted into a commercially available anthropomorphic thorax phantom (QRM, Moehrendorf) (Fig.1b) and immersed in water blended with iodinated contrast medium (Accupaque 350mg I/mL, GE Healthcare) at four different iodine concentrations: 3, 4, 5, and 6% (corresponding to 10.5, 14.0, 17.5, and 21.0 mg I/mL). For MRI, the resolution phantom was placed in a container filled with tap water, which was then doped with gadolinium-based contrast agent (Dotarem 0.5 mmol Gd/mL, Guerbet) at eight different gadolinium concentrations: 0.00, 0.17, 0.33, 0.50, 0.67, 1.00, 1.33, and 1.66mmol/L.
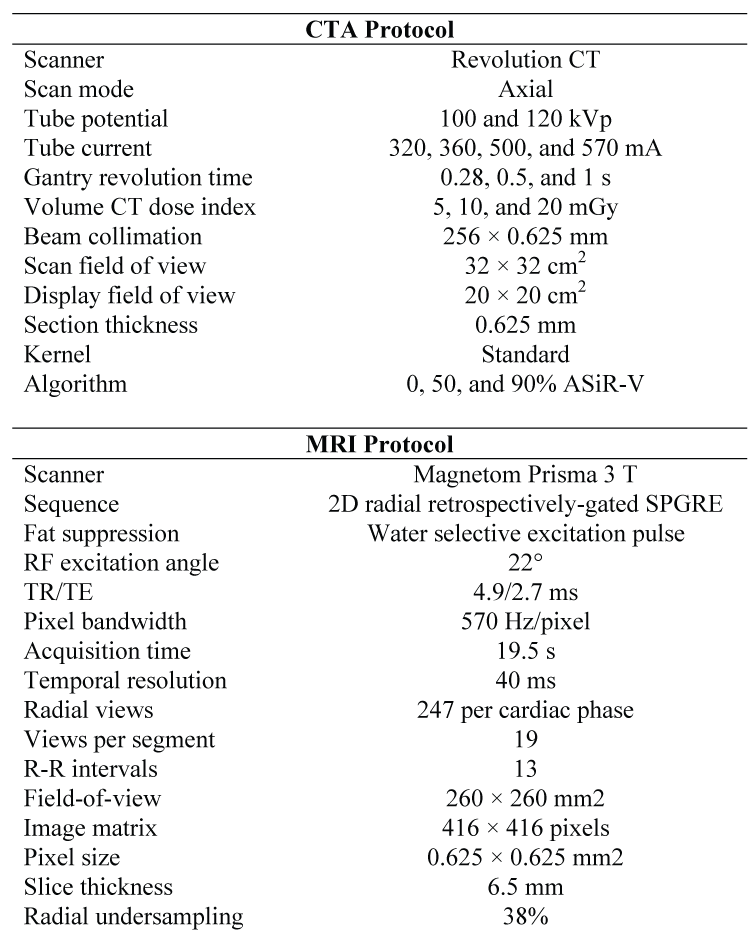
Data Acquisition: Parameters for the CTA and MRI scans are detailed in Fig.2. For CTA, three radiation dose levels (5, 10, and 20mGy), two tube potentials (100 and 120kVp), and three levels of partly model-based adaptive statistical iterative reconstruction-V (ASiR-V 0%, 50%, and 90%) were investigated. Including the four iodine concentrations, a total of 72 stacks of CTA images were processed and analyzed. MRI scans were performed on a clinical 3.0T MR system (Prisma, Siemens) with 18-channel-chest and 32-channel-spine coil arrays. MR images were acquired using a previously described 2D radial, retrospectively-gated, spoiled gradient-recalled echo cine sequence.10 The acquisition was repeated 10 times for each investigated gadolinium concentration.
Data Analysis: CSAs were automatically measured and compared to known nominal values to determine the accuracy, precision, signal-to-noise ratio (SNR), and circularity of CSA measurements, as well as the limit of detection (LOD) of CSA differences.11 Linear regression analyses were used to evaluate the correlation and agreement between the measured and known drilled CSAs. Analysis of variance (ANOVA) was used to test whether the investigated parameters had a significant effect on the accuracy, precision, LOD, SNR, and circularity
Results
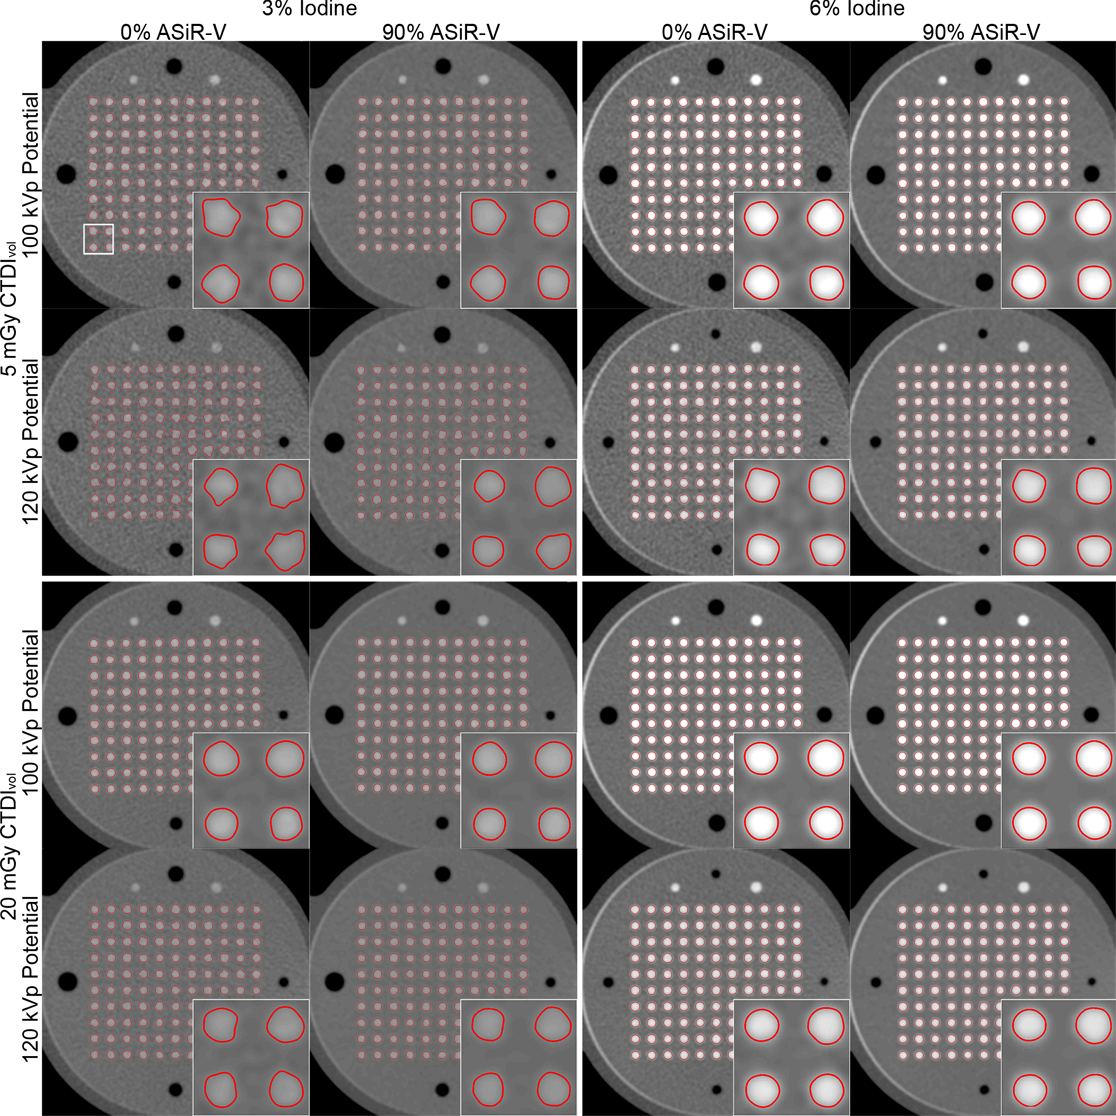
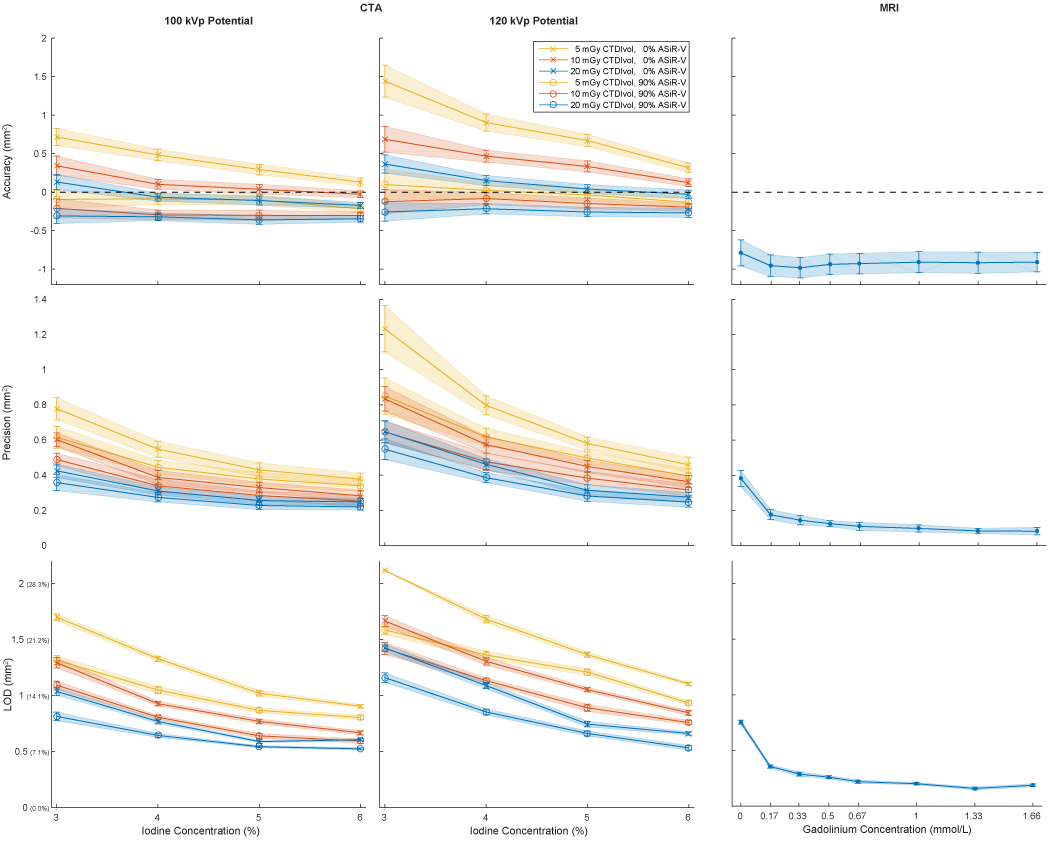
The iodine concentration, dose level, tube potential, and reconstruction algorithm all had significant effects (all p<0.0001) on the accuracy, precision, LOD, SNR, and circularity of CSA measurements with CTA. The best precision, LOD, SNR, and circularity with CTA were achieved with 6% iodine, 20mGy, 100kVp, and 90% ASiR-V (Fig.3-4). Compared to the optimized CTA protocol, radial MRI was significantly less accurate (-0.91±0.13mm2 vs. -0.35±0.04mm2; p<0.0001), but more precise (0.08±0.02mm2 vs. 0.21±0.02 mm2; p<0.0001), and enabled the detection of significantly smaller CSA differences (0.16±0.06 mm2 vs. 0.52±0.04mm2; p<0.0001; corresponding to CSA percentage differences of 2.25±0.80% vs. 7.42±0.63% for a 3-mm baseline diameter) (Fig.4-5).Discussion
While well supported by the results presented in this study, the poor precision and discrimination performance of CTA compared to MRI is counter-intuitive and leads to the rejection of our initial hypothesis. From the data presented here, it is unclear why MRI significantly outperformed CTA, and further investigations are necessary to address this question in greater detail. It is possible that different multidetector CT systems could outperform the one investigated here, since a recent study showed that the detectability indexes of different diameter structures can vary significantly (as much as 283%) across different CT systems and manufacturers.12 Furthermore, the effect of the image reconstruction kernels was not investigated: the use of edge-enhancing sharper kernels may further improve the performance of CTA, although they are not yet routinely used in clinical practice.Conclusion
Radial MRI outperformed CTA for the detection of small simulated CSA differences, and could be used to reliably detect changes that are well within the range of physiological vasomotor responses of proximal coronary arteries.Acknowledgements
Research funding for this project was provided by the Swiss National Science Foundation grants 320030_143923 and 326030_150828. We thank Christel Elandoy, Martine Bernasconi, and Frederic Pedron for help with CTA data acquisition and image reconstruction.References
1 Furchgott, R. F. & Zawadzki, J. V. The obligatory role of endothelial cells in the relaxation of arterial smooth muscle by acetylcholine. Nature 288, 373-376 (1980).
2 Ludmer, P. L. et al. Paradoxical vasoconstriction induced by acetylcholine in atherosclerotic coronary arteries. N Engl J Med 315, 1046-1051, doi:10.1056/NEJM198610233151702 (1986).
3 Davignon, J. & Ganz, P. Role of endothelial dysfunction in atherosclerosis. Circulation 109, III27-32, doi:10.1161/01.CIR.0000131515.03336.f8 (2004).
4 Deanfield, J. E., Halcox, J. P. & Rabelink, T. J. Endothelial function and dysfunction: testing and clinical relevance. Circulation 115, 1285-1295, doi:10.1161/CIRCULATIONAHA.106.652859 (2007).
5 Hays, A. G. et al. Noninvasive visualization of coronary artery endothelial function in healthy subjects and in patients with coronary artery disease. J Am Coll Cardiol 56, 1657-1665, doi:10.1016/j.jacc.2010.06.036 (2010).
6 Hays, A. G. et al. Regional coronary endothelial function is closely related to local early coronary atherosclerosis in patients with mild coronary artery disease: pilot study. Circulation. Cardiovascular imaging 5, 341-348, doi:10.1161/CIRCIMAGING.111.969691 (2012).
7 Kelle, S. et al. Coronary artery distensibility assessed by 3.0 Tesla coronary magnetic resonance imaging in subjects with and without coronary artery disease. Am J Cardiol 108, 491-497, doi:10.1016/j.amjcard.2011.03.078 (2011).
8 Hays, A. G. et al. Non-invasive detection of coronary endothelial response to sequential handgrip exercise in coronary artery disease patients and healthy adults. PloS one 8, e58047, doi:10.1371/journal.pone.0058047 (2013).
9 Dunet, V. et al. Assessment of coronary vasoreactivity by multidetector computed tomography: feasibility study with rubidium-82 cardiac positron emission tomography. Circulation journal : official journal of the Japanese Circulation Society 76, 160-167 (2012).
10 Yerly, J. et al. Coronary endothelial function assessment using self-gated cardiac cine MRI and k-t sparse SENSE. Magn Reson Med 76, 1443-1454, doi:10.1002/mrm.26050 (2016).
11 Yerly, J. et al. A phantom study to determine the theoretical accuracy and precision of radial MRI to measure cross-sectional area differences for the application of coronary endothelial function assessment. Magn Reson Med, doi:10.1002/mrm.26646 (2017).
12 Racine, D. et al. Objective comparison of high-contrast spatial resolution and low-contrast detectability for various clinical protocols on multiple CT scanners. Med Phys 44, e153-e163, doi:10.1002/mp.12224 (2017).
Figures