3471
Quantification of Wall Shear Stress in the Carotid Arteries of Naïve and Dyslipidemic Non-Human Primates1Translational Biomarkers, MRL, MSD, Singapore, Singapore, 2Bioinformatics, MRL IT, MSD, Singapore, Singapore, 3National Taiwan University, Taipei, Taiwan, 4Translational Biomarkers, MRL, Merck & Co., Inc., West Point, PA, United States, 5Imaging, Maccine Pte. Ltd., Singapore, Singapore, 6MoSAIC, Biomedical MRI, Department of Imaging and Pathology, KU Leuven, Leuven, Belgium, 7Early Discovery Pharmacology, MRL, MSD, Singapore, Singapore
Synopsis
Herein, we quantified regional carotid
wall shear stress (WSS) in 9 naïve NHPs on a normal diet and 4 dyslipidemic
NHPs on a high fat diet. A custom-built
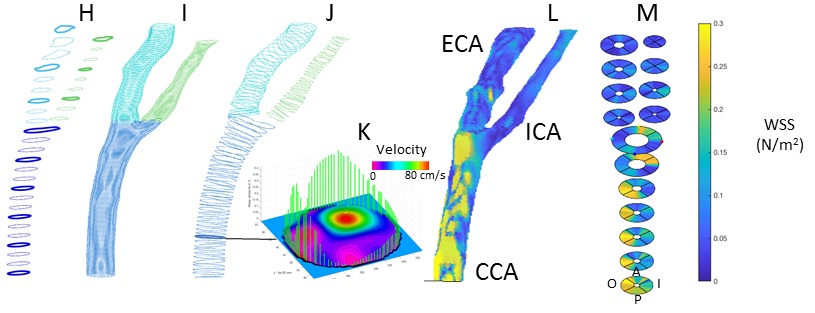
carotid coil was used to achieve high-resolution imaging. Image analysis was performed including 3D structural
and velocity interpolation, contour extraction and through-plane velocity
projection. Velocity gradients at the contours were computed to quantify
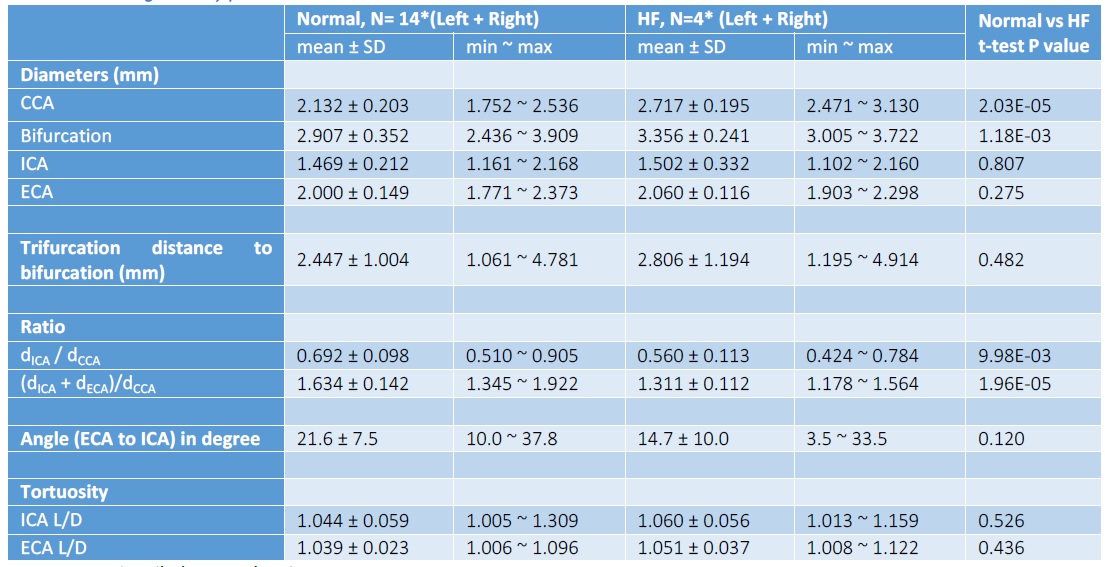
WSS. Animals on high fat diet showed
enlarged common carotid arteries (diameter: 2.717 ± 0.195 mm) and lower WSS (0.1478
± 0.0522 N/m2) compared to animals on a normal diet (diameter: 2.132
± 0.203 mm, 0.2209 ± 0.0817 N/m2).
Authorship
Smita Sampath and Weiwei Luo have contributed equally to this work.
Introduction
Atherosclerosis is a degenerative condition associated with morbidity and a high risk of death from heart attack or stroke [1]. Diet-induced NHP animal models closely mimic human atherosclerosis due to their phylogenetic similarity [2], and potentially play a significant role in the understanding of the pathogenesis of vascular remodeling. More importantly, these models can afford pre-clinical investigations of early interventions, including novel experimental compounds. However, similar to humans, structural vascular changes in atherosclerotic NHP disease models are typically observed a few years following diet initiation [2], considerably increasing the overall cost and time investment. Thus, quantitative biomarkers that are predictive of atherosclerosis and allow early evaluation of NHP atherosclerotic models and treatment strategies are critically in need. It is noted that alterations in the fluid biomechanical environment and specifically in vessel wall shear stress (WSS) are associated with endothelial dysfunction and are demonstrated early predictors of atherosclerosis [3-5]. Herein, we present the quantification of regional carotid artery WSS in healthy NHPs and NHPs on a high fat (HF) diet, achieved through the combination of a specialized NHP carotid RF coil, optimized MR imaging protocols, and a novel image analysis pipeline.
Methods
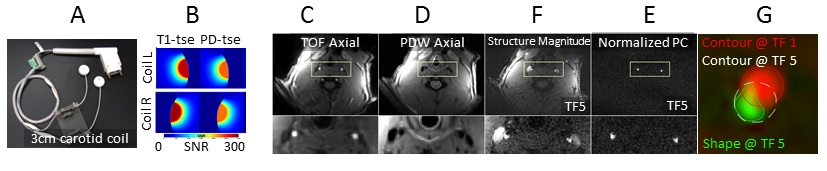
Animals and Equipment: 9 healthy cynomolgus macaques (cynos) on a normal diet (weight: 5.8±0.2 kg (mean±SD), age: 9±2 years,) and 4 dyslipidemic cynos (weight: 6.4kg±0.2 kg (mean±SD), age: 9±2 years, Total Cholesterol/HDL=1.97±0.37) on a HF diet (cholesterol content of 0.5mg/kcal, over 9 months) were imaged using the 3-T Trio MR imaging scanner (Siemens Medical Solutions, Germany) housed at Maccine’s facility (Maccine Pte Ltd., Singapore). Images were obtained using a 3-cm carotid coil (TrueImage Biomedical Inc., Taiwan) custom-built for NHP imaging.
Vascular Structural-Functional MRI: A multi-slab Time of Flight (ToF) acquisition (FOV: 85´85 mm2, imaging matrix: 256´256, slice thickness: 1 mm, averages: 3, bandwidth: ±10 KHz, TR/TE: 35 ms/7.8 ms, flip angle: 25°, parallel imaging mode: GRAPPA, acceleration factor: 2, reference lines: 24) was employed to obtain a 3D high-resolution structural bilateral carotid angiogram. Phase contrast (PC) MR imaging (FOV: 85 ´85 mm2, imaging matrix: 192´192, slice thickness: 2 mm, bandwidth: ±48 KHz, TR/TE: 24.7 ms/8.73 ms, flip angle: 15°, parallel imaging: same as ToF, VENC: TP 70-150cm/s, in-plane 20-40cm/s) was used to encode the 3D blood velocity in nine imaged transverse planes centered at the carotid bifurcation. Matched nine proton density weighted (PD-W) images were also acquired with identical imaging parameters as the PC scans, and used for registration of ToF structural images with PC functional images.
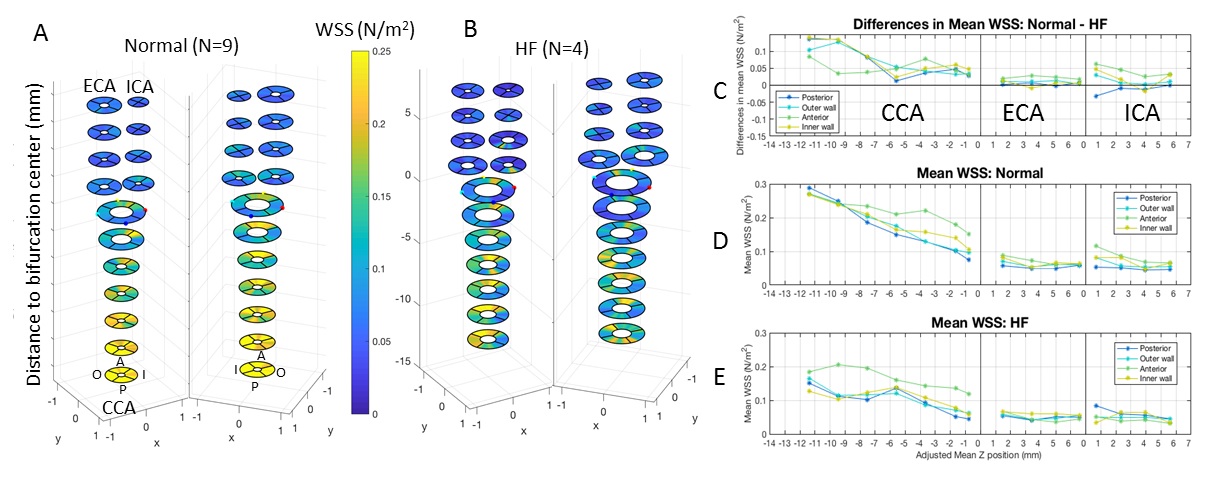
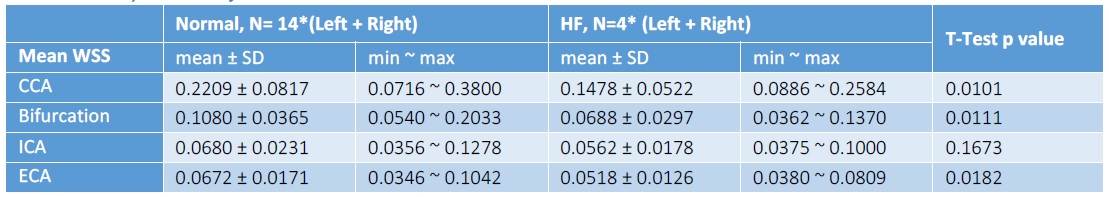
Data Analysis: All data analyses were conducted using in-house MATLAB programs. The image analysis methodology is described in detail in Figs. 1 & 2. Vessel WSS at the end-systolic time frame was computed, averaged and displayed as a multi-segment model (Fig. 3) with slices 2mm apart for the right and left common (CCA), internal (ICA) and external (ECA) carotid arteries. Mean WSS of animals with normal (Fig.3D) and HF diet (Fig.3E) and their differences (Fig.3C) were plotted in 4 segments (posterior, anterior, outer wall and inner wall) along the carotid arteries.
Results and Discussion
We have shown the feasibility of NHP high resolution structural and functional carotid artery imaging using a specialized carotid coil and optimized imaging protocols for vessel WSS quantification (Fig. 1&2). The multi-segment model seen in Fig. 3A and 3B demonstrate a decrease in WSS from CCA to ECA/ICA similar to that observed in humans [5] and asymmetry in WSS at the bifurcation, with higher WSS in the anterior regions for all NHPs dissimilar to humans where lower WSS is observed in the posterior region. This discrepancy is likely due to differential morphology between humans and NHPs. Fig. 3,4 and 5 also shows smaller WSS and larger vessels in HF diet animals, and these values and trends are similar to those observed in published human data[5]. The WSS between normal and HF diet animals are significantly different in the CCA, bifurcation region and ECA (P<0.05, student unpaired t-test) while not significant in the ICA due to larger fluctuations (P=0.167, student unpaired t-test). Note that the NHPs have smaller ICA than ECA. We observe a maximum drop in WSS between normal and high fat diet animals of the order of 33%, which compares closely to previously published data in humans, where a maximum drop in WSS of around 40% has been observed between healthy volunteers and patients with vascular disease [5].Conclusion
We have successfully demonstrated NHP carotid WSS quantification. Our data indicated that dyslipidemic animals on the HF diet had larger carotid arteries and smaller WSS, which may afford translatable non-invasive early biomarkers of vascular remodeling and longitudinal investigation of therapeutic responses.
Acknowledgements
No acknowledgement found.References
[1] McDermott et. al., Circ., 117:2484-2491, 2008. [2] Gresham et. al., Br J Exp Pathol, 46(1): 94:103, 1965. [3] Malek et. al., JAMA, 29: 158-161, 1999 [4] Irace et. al., Stroke, 35: 464-468, 2004. [5] Markl et. al., Circ Imaging, 3:647-655, 2010. [6] Cheng-Chung Liang et.al., SPIE 1445: 456 – 463, 1991.Figures