3464
Quantitatively monitoring therapeutic response in patients with symptomatic intracranial atherosclerotic disease using 3D MR plaque imaging1Cedars-Sinai Medical Center, Los Angeles, CA, United States, 2University of California, Los Angeles, CA, United States, 3Xuanwu Hospital, Beijing, China
Synopsis
Intracranial atherosclerotic disease (ICAD) is one of the most common causes of ischemic stroke worldwide. Despite intensive medical management, which is the current standard of care, the rate of recurrent stroke is 13% in the first year and as high as 35% in certain populations by 2 years. Initial and follow-up evaluations of these patients rely exclusively on assessments of clinical risk factors and, in some circumstances, the degree of luminal stenosis on imaging, which may overlook subtle non-luminal changes within ICAD lesions. In the present work, we sought to assess the feasibility of quantitatively monitoring regression or progression of intracranial atherosclerotic plaques using 3D VWI.
Introduction
Intracranial atherosclerotic disease (ICAD) is one of the most common causes of ischemic stroke worldwide1. Despite intensive medical management, which is the current standard of care, the rate of recurrent stroke is 13% in the first year and as high as 35% in certain populations by 2 years2. Initial and follow-up evaluations of these patients rely exclusively on assessments of clinical risk factors and, in some circumstances, the degree of luminal stenosis on imaging, which may overlook subtle non-luminal changes within ICAD lesions. A tool that can directly probe atherosclerotic plaques and accurately quantify longitudinal changes of plaque features may help early identify poorly or non-responsive patients in whom an alternative therapy can be initiated. Intracranial vessel wall imaging (VWI) has shown abilities to characterize the geometric and signal features of ICAD lesions. In the present work, we sought to assess the feasibility of quantitatively monitoring regression or progression of intracranial atherosclerotic plaques using 3D VWI.Methods
Eight patients (1F, 7M; age 27-66 years) with ischemic stroke secondary to ICAD were treated with intensive medical therapy and underwent initial (4 days – 4 months of onset) and follow-up 3D VWI (6-13 months), respectively, on the same 3T MR system (Siemens Verio). A recently developed cerebrospinal fluid-suppressed whole-brain VWI technique was used to acquire pre- and post-contrast 3D VWI images with 0.5-mm isotropic spatial resolution3.
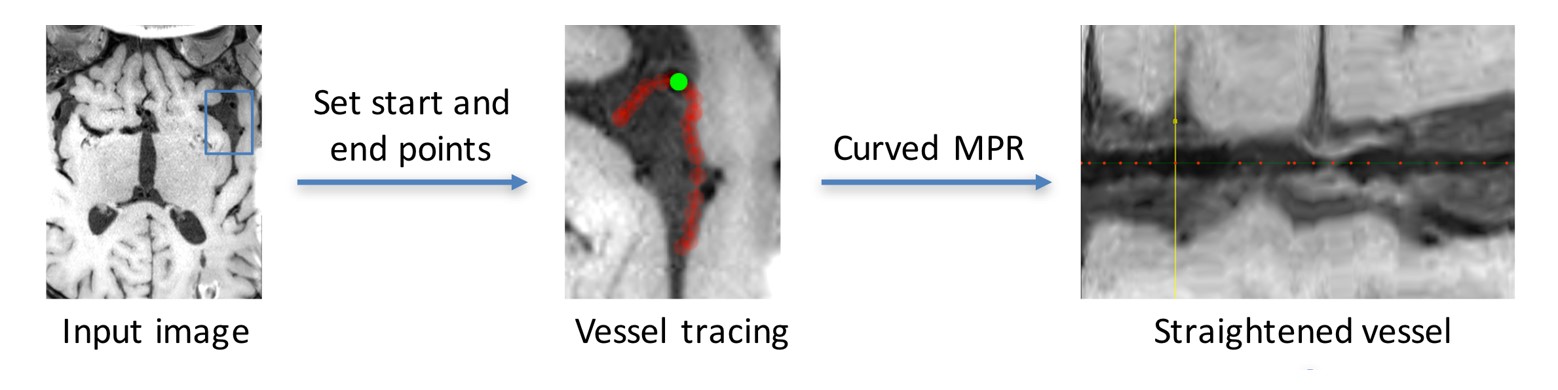
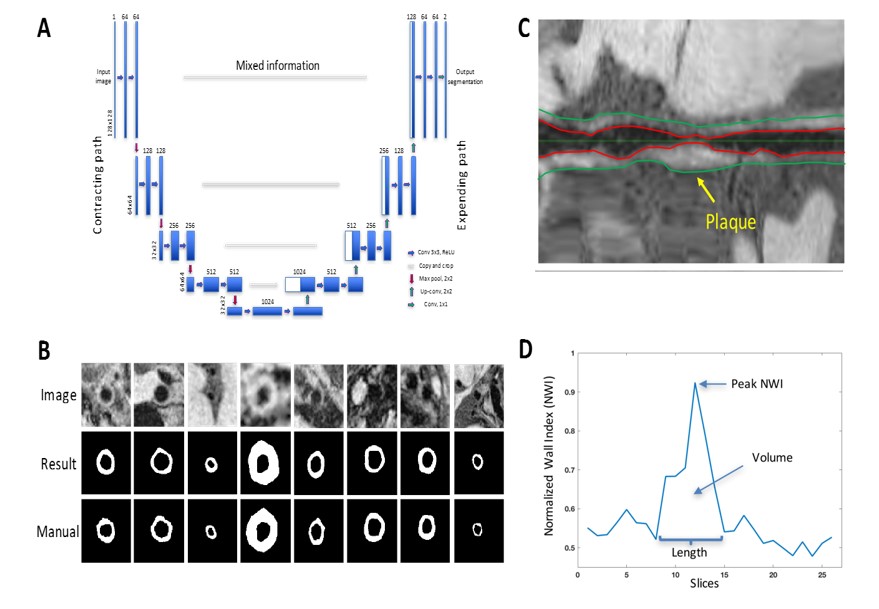
The images from the initial evaluation were reviewed in consensus by a neuroradiologist and a neurologist, who had access to all other MR brain images, to determine the culprit lesion. A custom-designed intracranial vessel analysis software package was used to 1) reconstruct contiguous cross-sectional slices from culprit lesions using semi-automatic centerline tracking (Figure 1) and 2) segment vessel wall and quantify total vessel and wall area using recently proposed deep-learning-based algorithm (Figure 2)4. Additionally, mean signal intensity (SI) was measured in the hyper-intense region of the lesion, entire lesion, gray matter, and adjacent normal vessel wall on pre-contrast images; SI was also measured in the entire lesion and gray matter on post-contrast images. The images from the follow-up evaluation were spatially registered to those from the initial evaluation and the same centerline path was applied to reconstructed lesions’ cross-sections. Area and signal measurement were performed using the methods described above.
Geometric and signal features of the culprit lesion, including peak normalized wall index (NWI), plaque volume, pre-contrast plaque-wall contrast ratio (CR) (defined as SIplaque/SIwall), and post-contrast plaque enhancement ratio (ER) (defined as [SIplaque/SIgraymatter]post/[SIplaque/SIgraymatter]pre), were derived from both initial and follow-up VWI scans.
Results
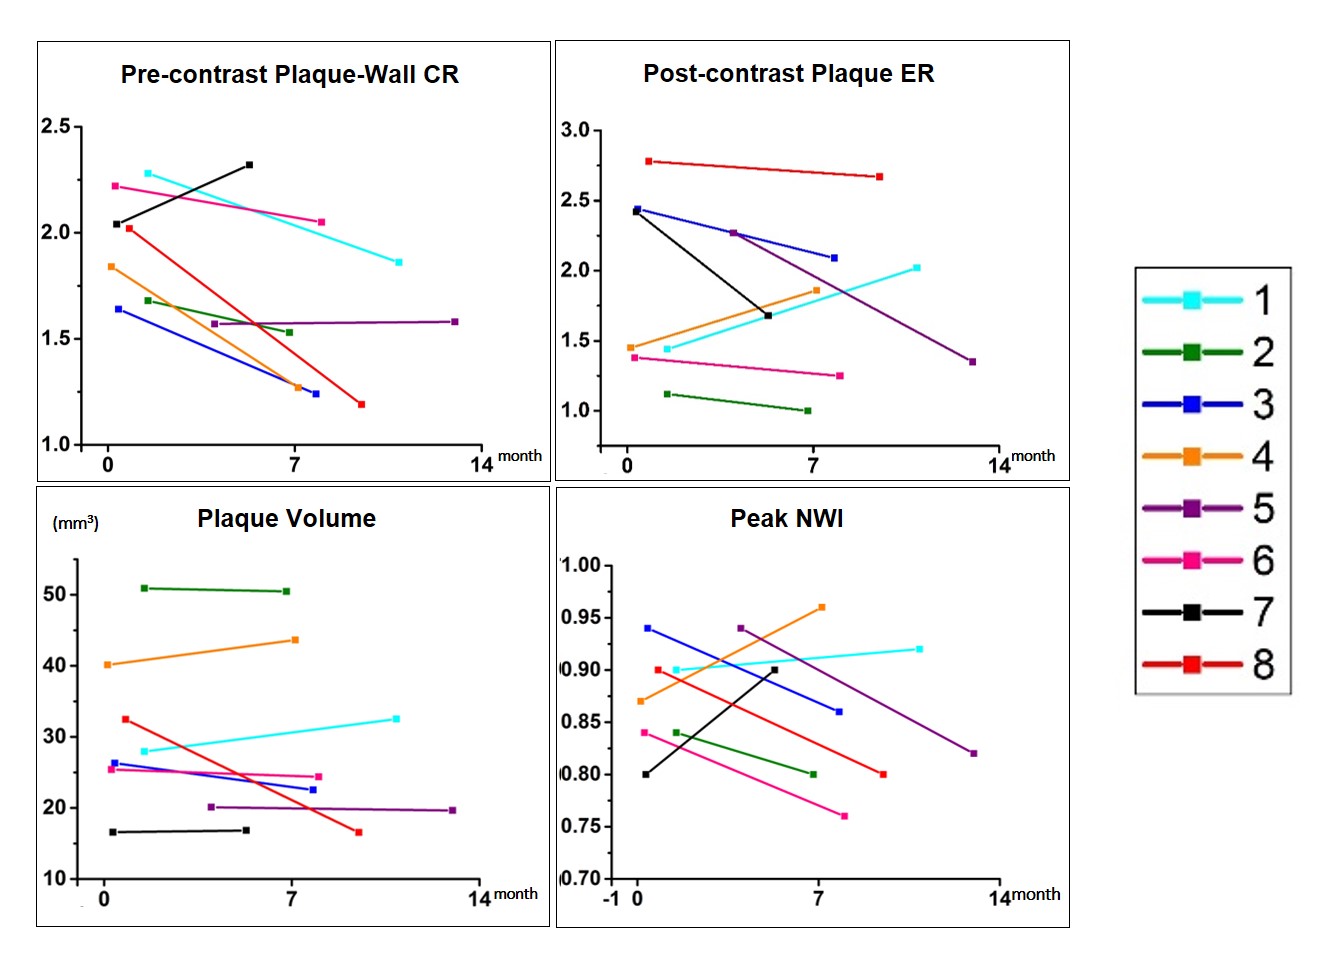
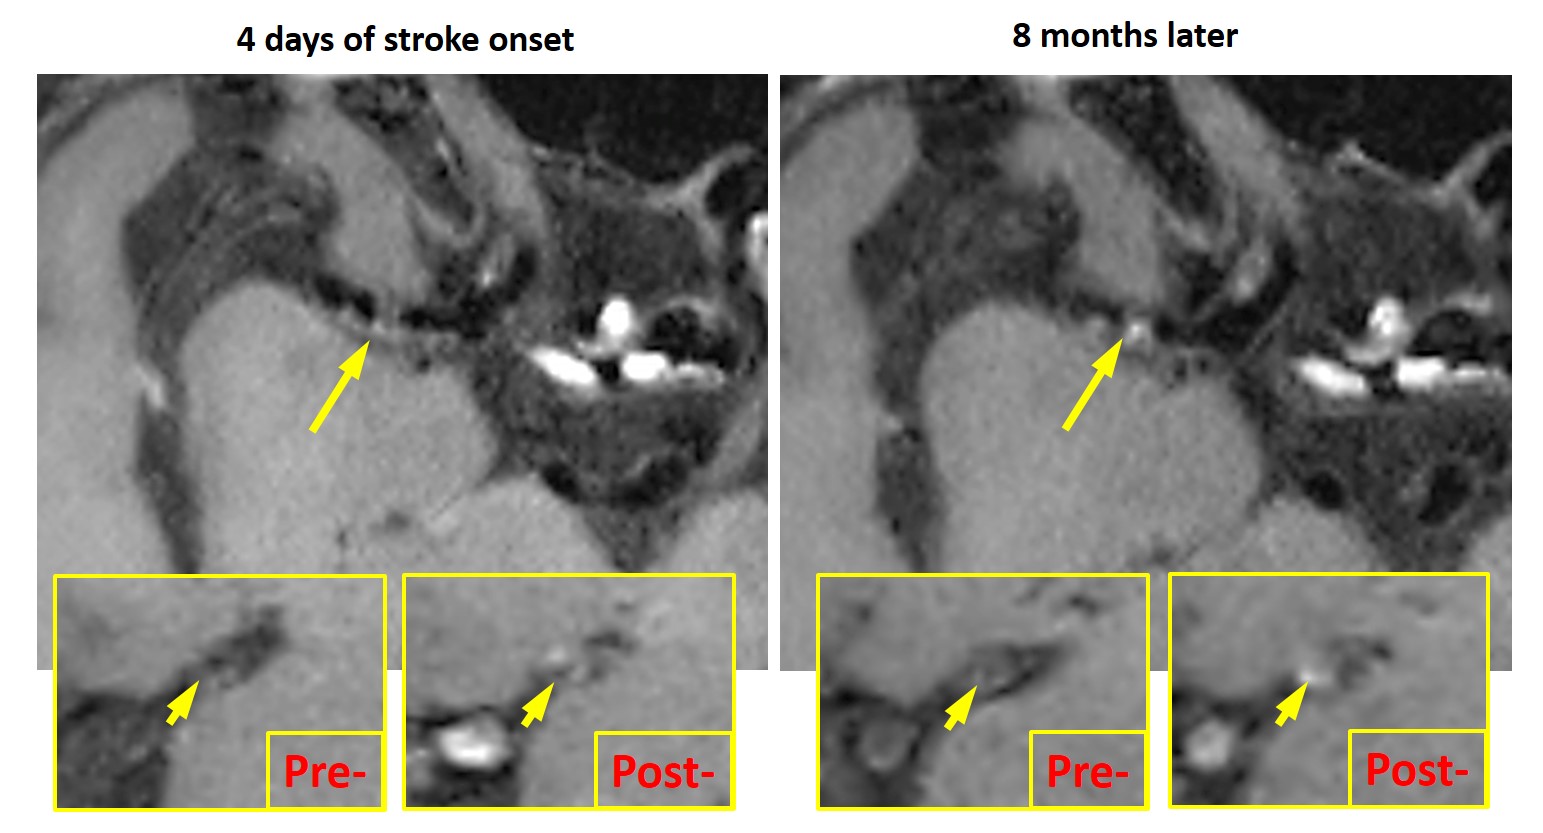
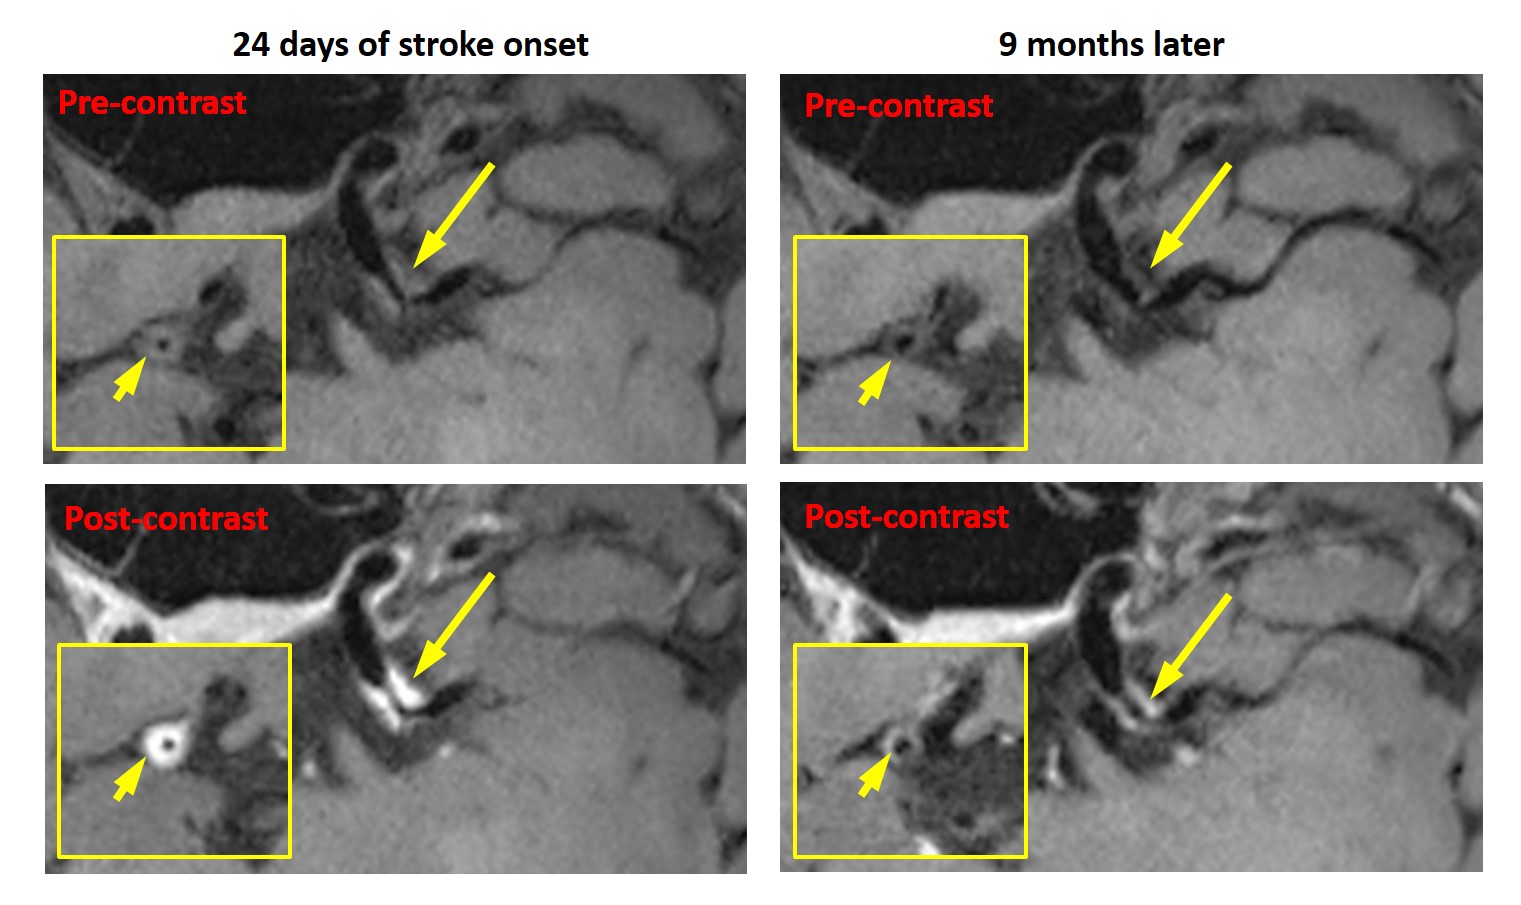
No subjects except for subject #4 had a recurrent stroke during the follow-up period. The quantitative plaque features exhibited different change patterns over the treatment period as shown in Figure 3. Subject #1 and #4 demonstrated an increase in plaque ER, plaque volume, and peak NWI; subject #7 also demonstrated an increase in plaque volume and peak NWI. Figure 4 shows the VWI images from subject 4 in whom the lumen was still visible and vessel wall shows a little contrast enhancement at the first scan but was barely seen due to increased plaque burden and shows strong contrast enhancement at the follow-up. Other patients had a decrease or no change in these features. Plaque regression was readily appreciated from the visual comparison between initial and follow-up VWI scans. A typical example was shown in Figure 5, whereby the patient (subject 8) demonstrated reduced plaque burden and contrast enhancement after 9-month medical therapy.Discussion
Previous studies focused on stenosis imaging have suggested that ICAD is a dynamic lesion and stroke recurrence is associated with stenosis change instead of the stenosis grade at a specific time point5,6. Individual patients, despite their similar plaque features at the commencement of treatment, may demonstrate disparate response outcome due to differential pharmacodynamics and treatment compliance. Hence, we anticipate that serial imaging and associated changes in quantitative plaque features would more likely capture disease regression or progression. In this work, an increase in plaque ER, volume, and peak NWI of culprit lesions appeared positively correlated with stroke recurrence. Plaque ER has been shown to be associated with culprit lesions. Enhanced plaque ER may suggest a more active inflammatory status. Enlarged plaque volume and peak NWI are clearly markers of a growing plaque. Hence, our results suggest that temporal changes in these features may have a strong indication on culprit lesions’ response to medical therapy. A large-scale clinical validation is warranted.Acknowledgements
No acknowledgement found.References
[1] Gorelick PB et al. Stroke 2008;39:2396-2399.
[2] Derdeyn CP Lancet 2014;383:333-341.
[3] Fan et al. MRM 2017;77:1142-1150.
[4] Shi F et al. ISMRM 2017; 4706.
[5] Wong K et al. Stroke 2002;33:532-536
[6] Kwon SU et al. Stroke 2005;36:782-786
Figures