3462
Precision and Accuracy of Coronary Cross-Sectional Area MRI Measurements Used to Measure Coronary Endothelial Function1Division of MR Research, Department of Radiology, Johns Hopkins University School of Medicine, Baltimore, MD, United States, 2Division of Cardiology, Department of Medicine, Johns Hopkins University School of Medicine, Baltimore, MD, United States, 3Department of Radiology, University Hospital (CHUV) and University of Lausanne (UNIL), Lausanne, Switzerland, 4Center for Biomedical Imaging (CIBM), Lausanne, Switzerland
Synopsis
Coronary endothelial function (CEF) can be measured noninvasively with MRI by quantifying changes in
Introduction
Coronary endothelial function (CEF) reflects vascular health and invasive CEF measures performed in the catheterization laboratory predict cardiovascular events1–3. MRI can now measure CEF noninvasively by quantifying changes in coronary artery cross-sectional area (CSA) in response to isometric handgrip exercise4–7, an endothelial-dependent stressor8. But the CSA-change is only a few imaging pixels because of MRI’s limited spatial resolution. Fourier interpolation (zero filling) is routinely used in MRI to display images at higher than acquired resolutions9. We hypothesize that Fourier interpolation enables sub-pixel CSA-precision and test this with both numerical simulations and phantom measurements. Prior phantom studies showed that radial MRI is capable of distinguishing CSA changes of 3-4% on images with high SNR (~50) and 6-8% on images with low SNR (~25-30) for a 3-mm vessel10. The same study showed that the dependence of the smallest detectable area change on the voxel size was negligible when keeping the acquisition time identical10. We did not anticipate the latter and performed additional simulations to understand the relative importance of image interpolation, acquisition voxel size and signal-to-noise ratio (SNR). Additionally, because most MRI CEF studies to date have been performed with spiral rather than radial MRI,4–8,11,12 another goal of this work was to determine the precision and accuracy of CSA measurements, and the smallest area-change that can be detected using spiral MRI.Methods
In-vivo SNR: To have an estimate of the SNR for the subsequent in vitro work, right and left coronary arteries were imaged with the current CEF protocol4 in 10 subjects at 3T. The SNR was determined by averaging and subtracting 2 cardiac phases with minimal motion13.
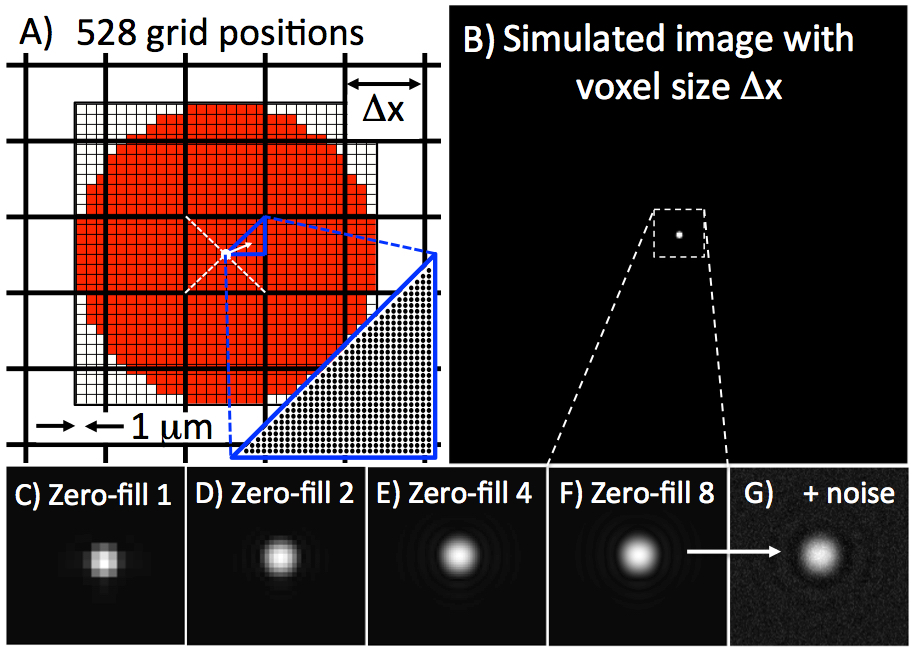
Simulations: Area measurements of circular vessels were simulated by varying partial volume (528 steps, Figure 1A), vessel diameter (2.5-5mm), imaging voxel size Δx (0.4-1mm), SNR (10-150), and Fourier interpolation (factors 1, 2, 4, 8). Areas were measured with full-width at half-maximum (FWHM) and used to determine precision (standard deviation) and accuracy (mean of the difference from the true value).
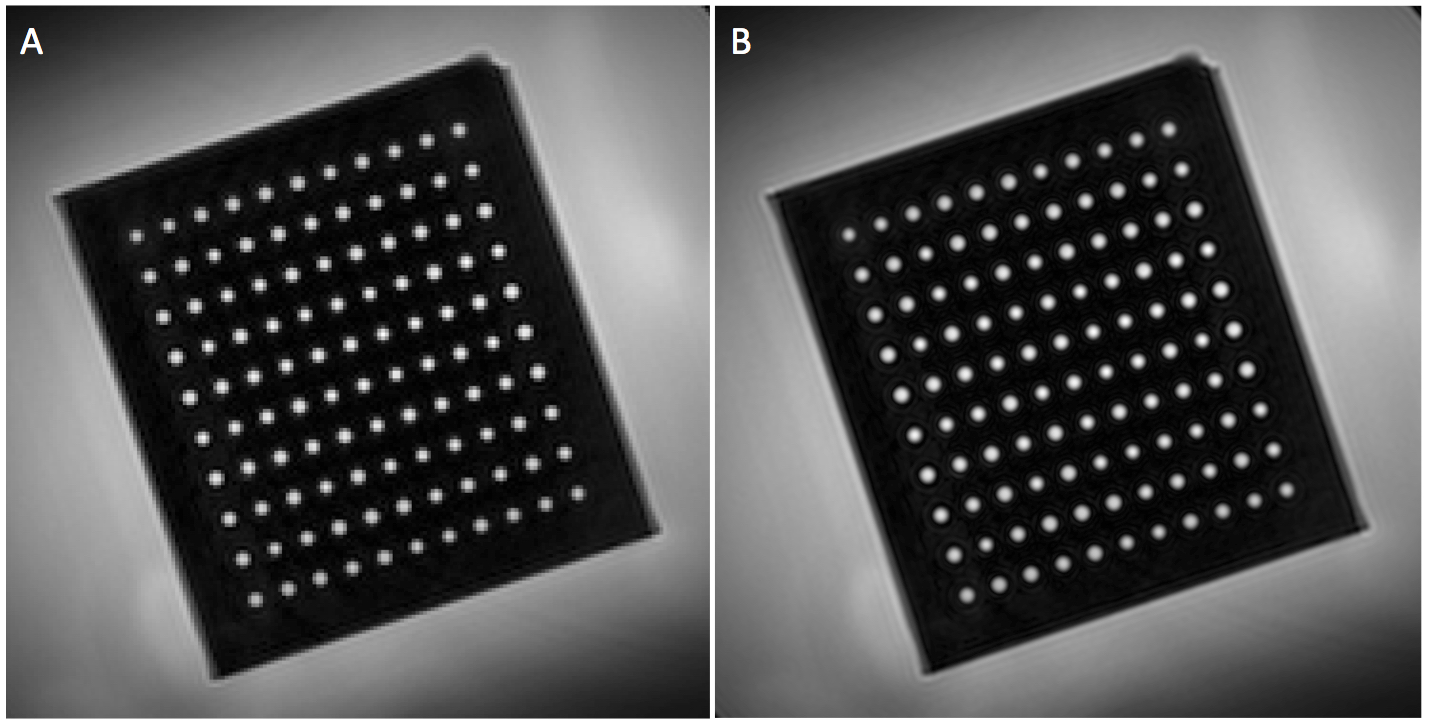
Phantom: A phantom with precision-drilled holes (diameters 3-3.42mm in steps of 0.02mm, each 5 times10) was placed in a container filled with gadolinium-doped water (T1~200ms). Spiral cine MRI was acquired 10 times orthogonal to the drilled holes with the current standard CEF protocol (Δx=0.89mm, 20 interleaves, 18s breath-hold) and a high-resolution protocol (Δx=0.6mm, 26 interleaves, 23s). Images were deblurred locally14. CSA was measured with FWHM, and CSA precision and accuracy were determined as above. To determine the limit of CSA change that is detectable, a statistical test based on the area under the curve (AUC) of the receiver operating characteristic curve (ROC) was used as proposed by Yerly et al.10 A nonparametric ROC curve was computed from the measured areas of two different diameters for each combination of diameters. The CSA change between two diameters was considered statistically detectable if the AUC ≥ 0.95, and the smallest area difference that consistently passed this test was determined for every diameter.
Results
In-vivo SNR: Mean in vivo coronary SNR with the standard CEF protocol was 53±19 (mean±standard deviation); and 70±6 (n=5, ranging from 62-76) and 35±8 (30-50) at the level of the RCA and LAD, respectively.
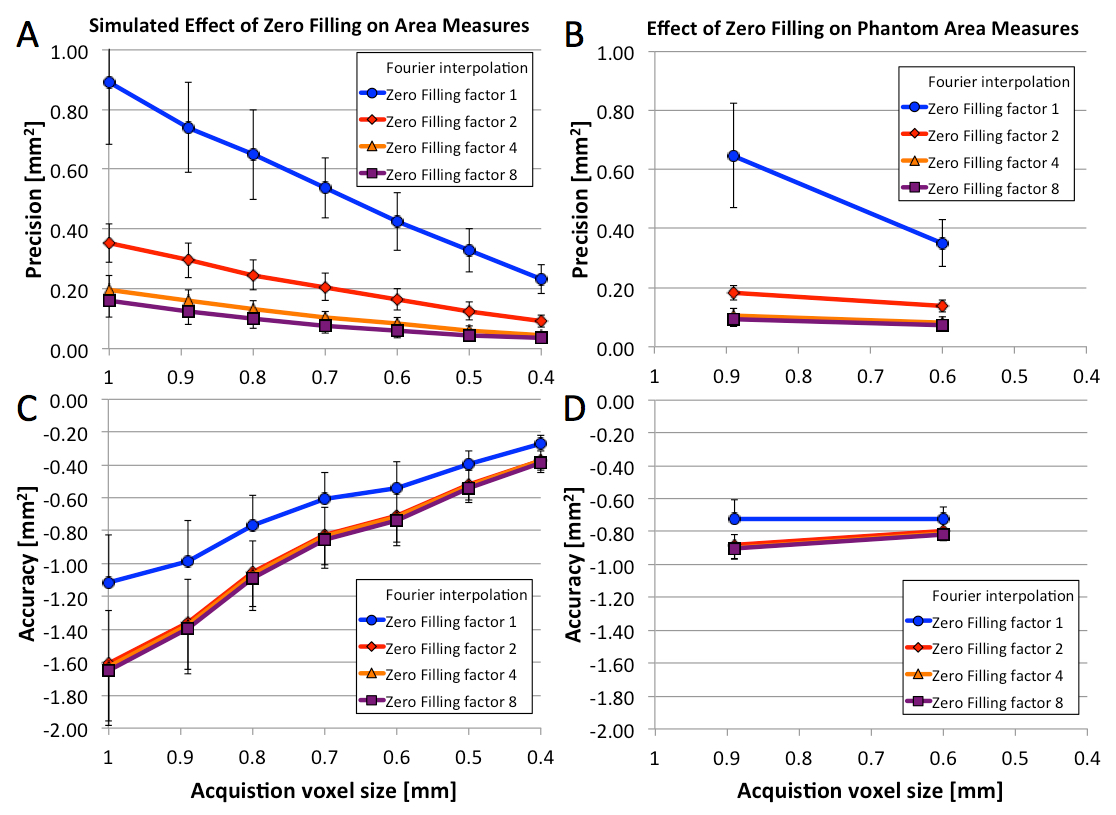
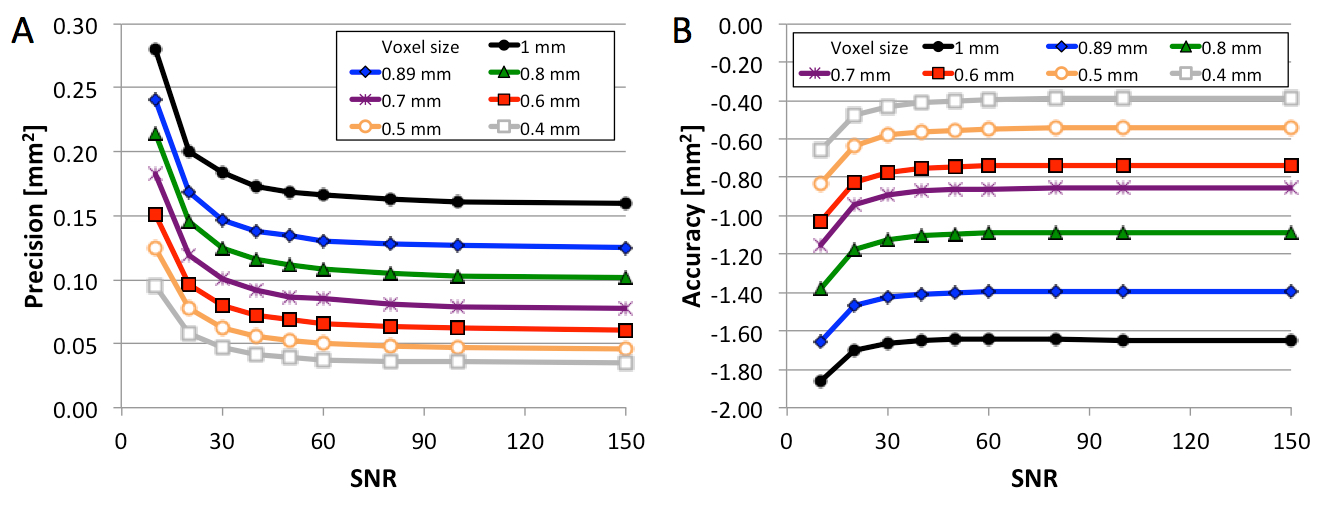
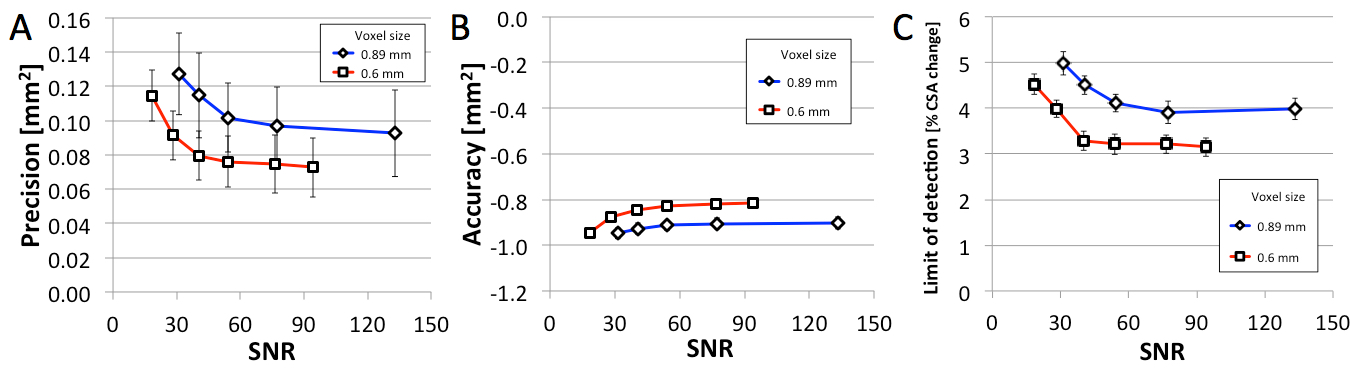
Simulations and Phantom: Figure 1 shows example simulated vessel images with different zero-filling factors and added noise. Example phantom images with zero filling factors 1 and 8 are shown in Figure 2. Figure 3 shows that 8-fold Fourier interpolation improves area measurement precision by a factor of 6.5 and 4.9 in the simulations and phantoms scans, respectively, while slightly reducing accuracy (increased underestimation). The simulations show that both precision and accuracy can be improved with increased spatial resolution as long as the SNR stays above 20 (Figure 4). Phantom measurements (Figure 5A-B) confirm those simulations and show that both precision and accuracy can be improved with smaller voxel sizes as long as SNR ≥ 30. The limit of area-change detection is <4% for SNR > 60, and <5% for SNR > 30 with the current protocol, and <3.5% for SNR > 40 with the high-resolution protocol (Figure 5C).
Discussion
Both simulations and phantom studies demonstrate that 8-fold Fourier interpolation enables sub-pixel area measurement precision, and that current CEF spiral MRI can detect CSA-changes of less than 5% even at low SNR of ~30, the lowest SNR measured in 10 subjects in this study. A 5% area change corresponds to about a quarter of the difference between a healthy (10-20%) and impaired (-12-2%) response,4–8,11,12 enabling CEF studies predicting atherosclerotic disease progression or testing whether medical or lifestyle interventions improve CEF.Acknowledgements
Work supported by NIH HL120905, NIH HL125059, NIH HL61912, AHA 17SDG33671007 and the District of Columbia Women’s Board (DCWB).References
1. Suwaidi JA, Hamasaki S, Higano ST, Nishimura RA, Holmes DR, Lerman A. Long-term follow-up of patients with mild coronary artery disease and endothelial dysfunction. Circulation. 2000;101:948–954.
2. Schächinger V, Britten MB, Zeiher AM. Prognostic impact of coronary vasodilator dysfunction on adverse long-term outcome of coronary heart disease. Circulation. 2000;101:1899–1906.
3. Halcox JPJ, Schenke WH, Zalos G, Mincemoyer R, Prasad A, Waclawiw MA, Nour KRA, Quyyumi AA. Prognostic Value of Coronary Vascular Endothelial Dysfunction. Circulation. 2002;106:653–658.
4. Hays AG, Hirsch GA, Kelle S, Gerstenblith G, Weiss RG, Stuber M. Noninvasive visualization of coronary artery endothelial function in healthy subjects and in patients with coronary artery disease. J Am Coll Cardiol. 2010;56:1657–1665.
5. Hays AG, Kelle S, Hirsch GA, Soleimanifard S, Yu J, Agarwal HK, Gerstenblith G, Schar M, Stuber M, Weiss RG. Regional Coronary Endothelial Function Is Closely Related to Local Early Coronary Atherosclerosis in Patients With Mild Coronary Artery Disease: Pilot Study. Circ Cardiovasc Imaging. 2012;5:341–348.
6. Hays AG, Stuber M, Hirsch GA, Yu J, Schär M, Weiss RG, Gerstenblith G, Kelle S. Non-Invasive Detection of Coronary Endothelial Response to Sequential Handgrip Exercise in Coronary Artery Disease Patients and Healthy Adults. PLoS ONE. 2013;8:e58047.
7. Iantorno M, Schär M, Soleimanifard S, Brown TT, Moore R, Barditch-Crovo P, Stuber M, Lai S, Gerstenblith G, Weiss RG, Hays AG. Coronary artery endothelial dysfunction is present in HIV-positive individuals without significant coronary artery disease: AIDS. 2017;31:1281–1289.
8. Hays AG, Iantorno M, Soleimanifard S, Steinberg A, Schär M, Gerstenblith G, Stuber M, Weiss RG. Coronary vasomotor responses to isometric handgrip exercise are primarily mediated by nitric oxide: a noninvasive MRI test of coronary endothelial function. Am J Physiol Heart Circ Physiol. 2015;308:H1343-1350.
9. Zhu X, Tomanek B, Sharp J. A pixel is an artifact: On the necessity of zero-filling in fourier imaging. Concepts Magn Reson Part A. 2013;42A:32–44.
10. Yerly J, Gubian D, Knebel J-F, Schenk A, Chaptinel J, Ginami G, Stuber M. A phantom study to determine the theoretical accuracy and precision of radial MRI to measure cross-sectional area differences for the application of coronary endothelial function assessment: Precision of in vitro Coronary Area Measurements. Magn Reson Med [Internet]. 2017 [cited 2017 Aug 23];Available from: http://doi.wiley.com/10.1002/mrm.26646
11. Iantorno M, Hays AG, Schär M, Krishnaswamy R, Soleimanifard S, Steinberg A, Stuber M, Gerstenblith G, Weiss RG. Simultaneous Noninvasive Assessment of Systemic and Coronary Endothelial FunctionCLINICAL PERSPECTIVE. Circ Cardiovasc Imaging. 2016;9:e003954.
12. Hays AG, Iantorno M, Schär M, Mukherjee M, Stuber M, Gerstenblith G, Weiss RG. Local coronary wall eccentricity and endothelial function are closely related in patients with atherosclerotic coronary artery disease. J Cardiovasc Magn Reson. 2017;19:51.
13. National Electrical Manufacturers Association. Determination of signal-to-noise ratio (SNR) in diagnostic magnetic resonance imaging. Rosslyn: National Electrical Manufacturers Association; 2008.
14. Noll DC, Pauly JM, Meyer CH, Nishimura DG, Macovski A. Deblurring for non-2D Fourier transform magnetic resonance imaging. Magn Reson Med. 1992;25:319–333.
Figures