3461
Investigating the estimated intracranial wall thickness on MRI vessel wall images: what voxel size do we need?1Center for Image Sciences, UMC Utrecht, Utrecht, Netherlands, 2Department of Radiology, UMC Utrecht, Utrecht, Netherlands, 3Image Sciences Institute, UMC Utrecht, Utrecht, Netherlands
Synopsis
We investigated the influence of voxel size on the accuracy and precision of intracranial vessel wall thickness measurements on MR images. Circle of Willis specimens were scanned at ultra-high resolution (0.11mm). Downsampling these images showed that distinguishing thin (0.35-0.45mm), medium (0.65-0.75mm) and thick (0.95-1.05mm) vessel walls requires voxel sizes below 0.55-0.66mm, although thickness measurements showed considerable bias at those resolutions. Unbiased measurements required a voxel size of 0.2mm or less. A clinically used MRI protocol (0.8mm), could only correctly measure vessel walls thicker than 0.9mm. In summary, current intracranial vessel wall MRI protocols provide limited quantification of vessel wall thickness.
Purpose
Rupture of intracranial atherosclerotic plaques is one of the main causes of stroke worldwide1. Commonly, the degree of stenosis is used as indicator for rupture risk and plaque presence, but this may be a poor predictor for early wall thickening2,3. In this case, plaque/vessel wall thickness would be a more appropriate marker for plaque presence. Accurate thickness measurements on MR images are challenged by the resolution of MRI with respect to the actual vessel wall thickness. And correctness of manual/automatic measurement methods is usually not validated4-9. The purpose of this study was to determine the influence of voxel size on vessel wall thickness estimation and accuracy of vessel wall thickness estimation on clinical acquisitions.Materials and methods
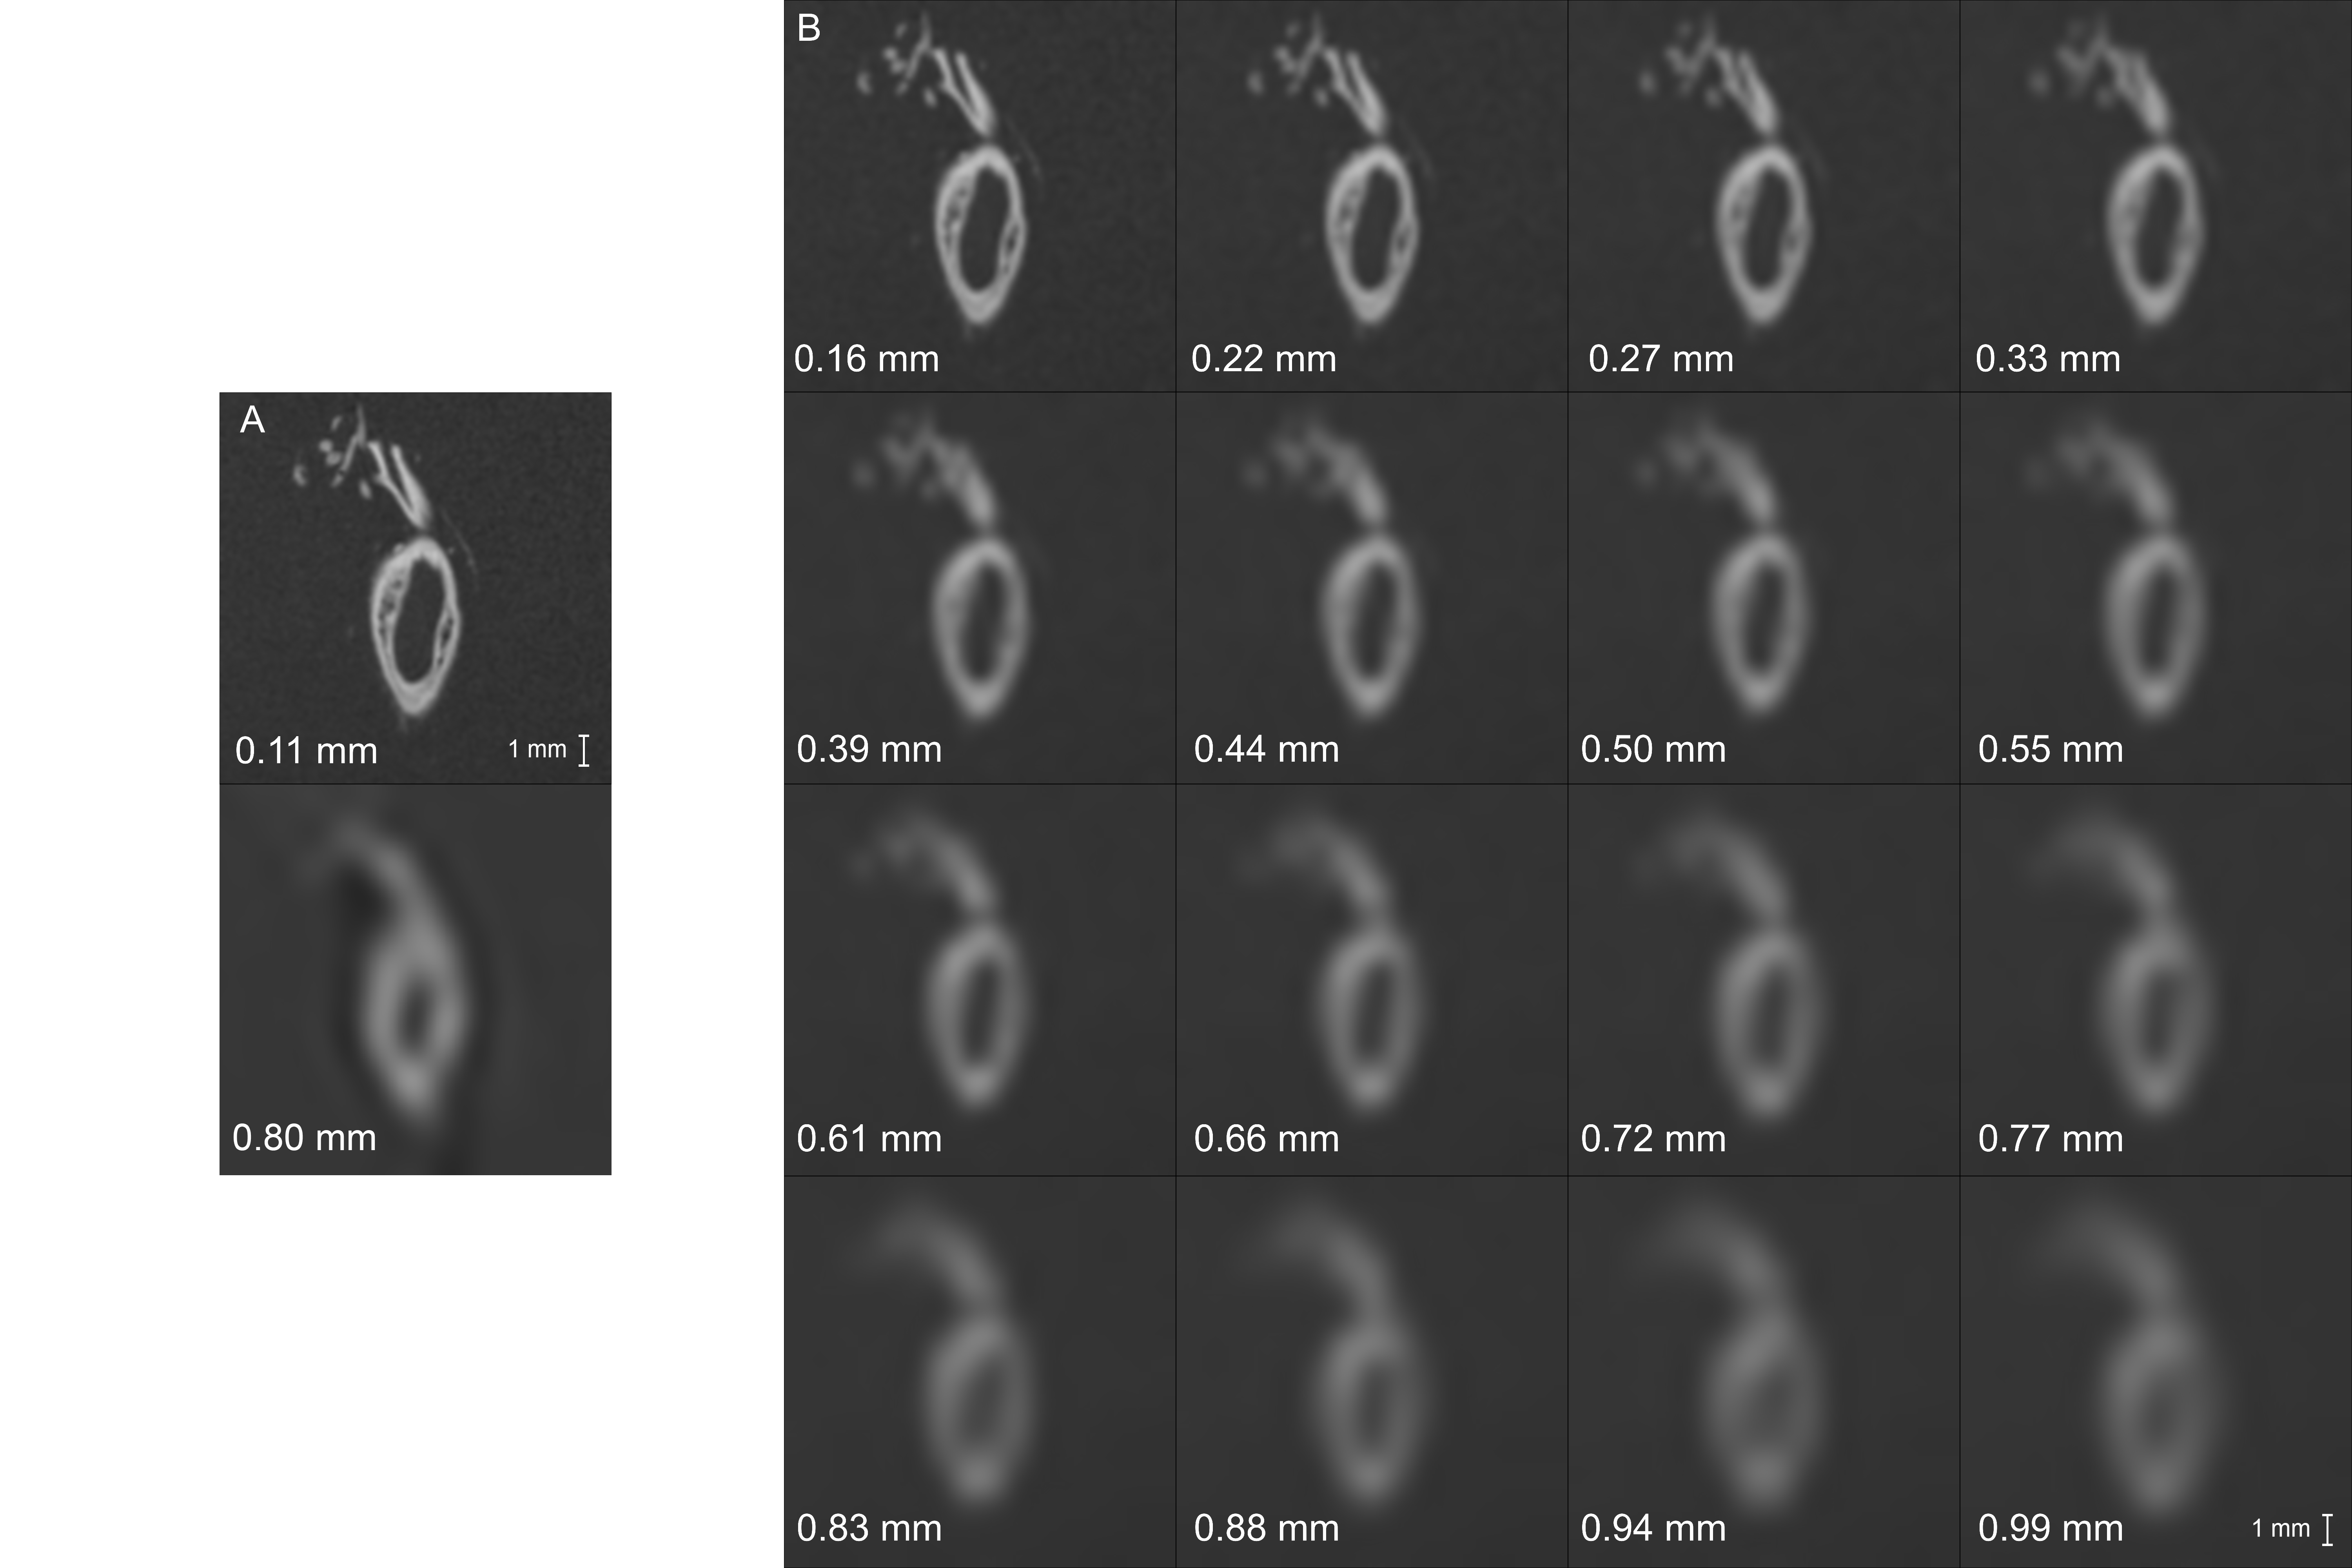
In this study, 12 human specimens of the circle of Willis, (mean age, 75 years; range, 66-84 years), obtained between 2008-2015 and examined in 2016, were used. An ultra-high resolution sequence (3D gradient echo, isotropic acquired voxel size: 0.11mm) and a clinically used low resolution sequence (MPIR-TSE10, isotropic acquired voxel size: 0.8mm) were performed. A skeletonization of the vessel wall was performed on the ultra-high and low resolution images. At each skeleton point, the vessel wall thickness was automatically estimated as the full width at half maximum of the intensity profile, perpendicular to the vessel wall.
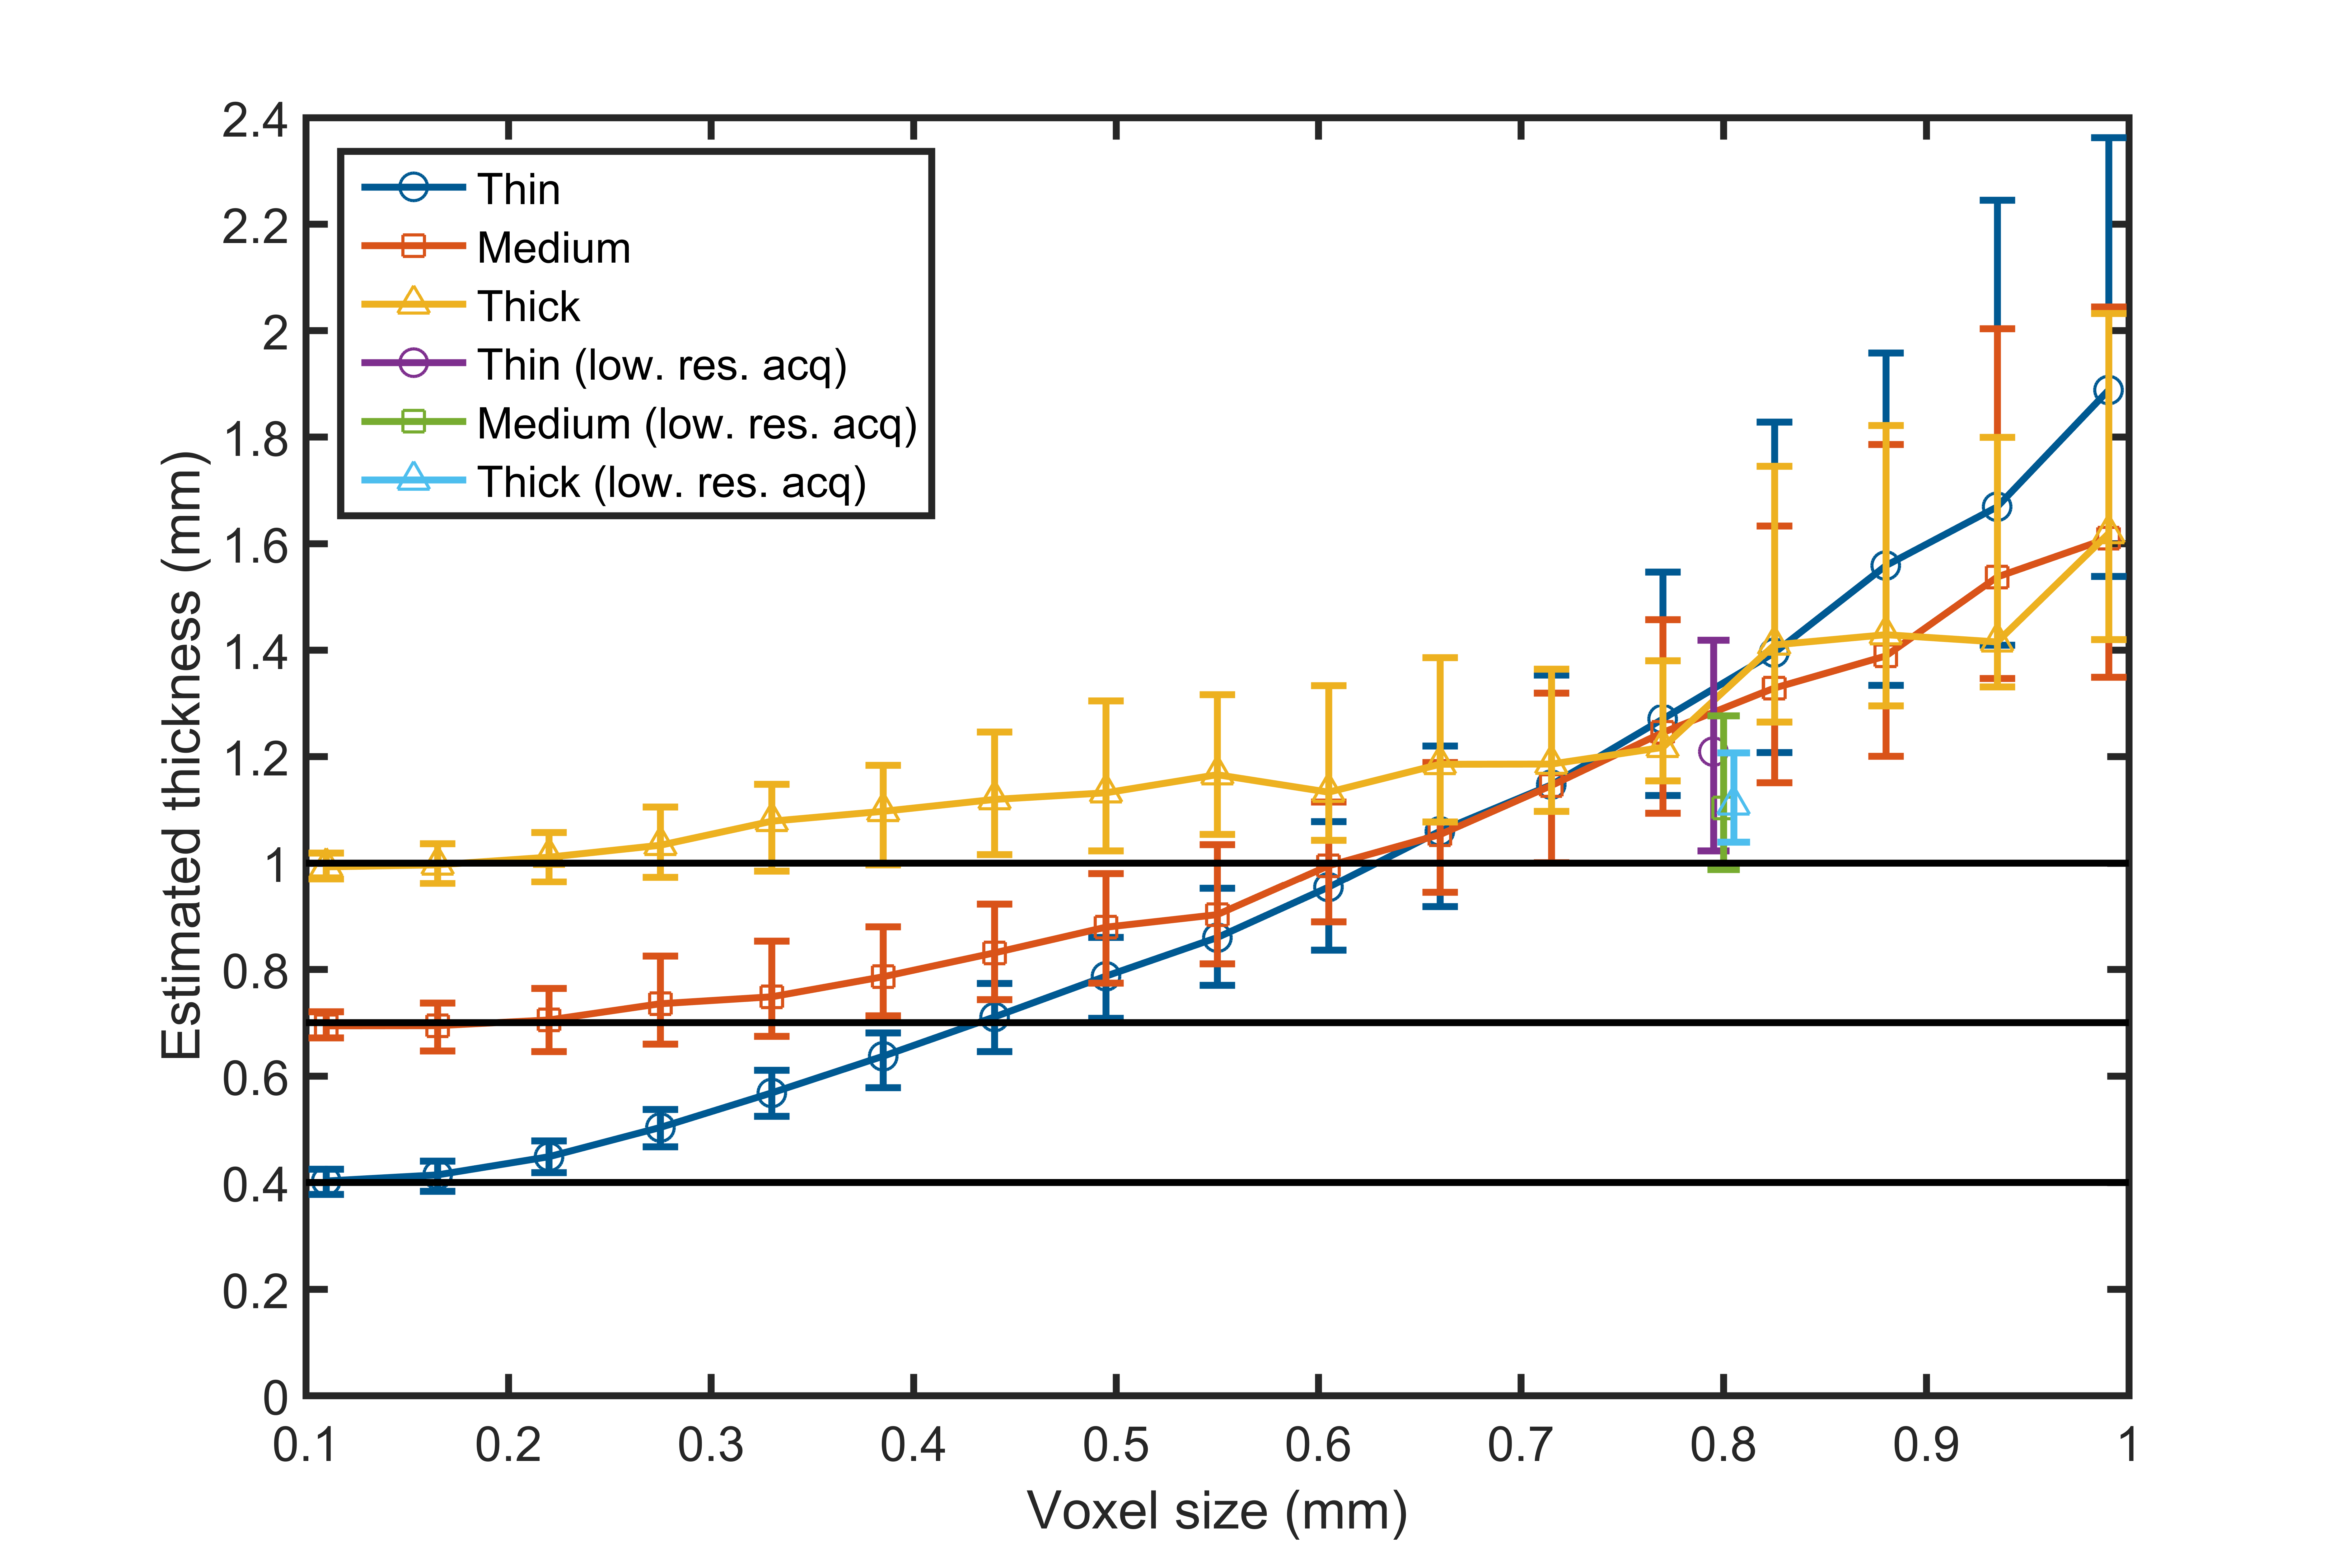
Three analyses were performed on the middle cerebral artery. First, the automatically determined reference thickness, the vessel wall thickness measured on the ultra-high resolution images, was validated to manual measurements from previous work11. Second, we compared the vessel wall thickness estimated on low resolution images to the reference thickness. Last, we investigated the correctness of vessel wall thickness measurements for three vessel wall thickness ranges (thin (0.35-0.45mm), medium (0.65-0.75mm) and thick (0.95-1.05mm)), on downsampled ultra-high resolution images (Figure 1). Additionally, we determined the maximum voxel size required to distinguish between the three thickness ranges.
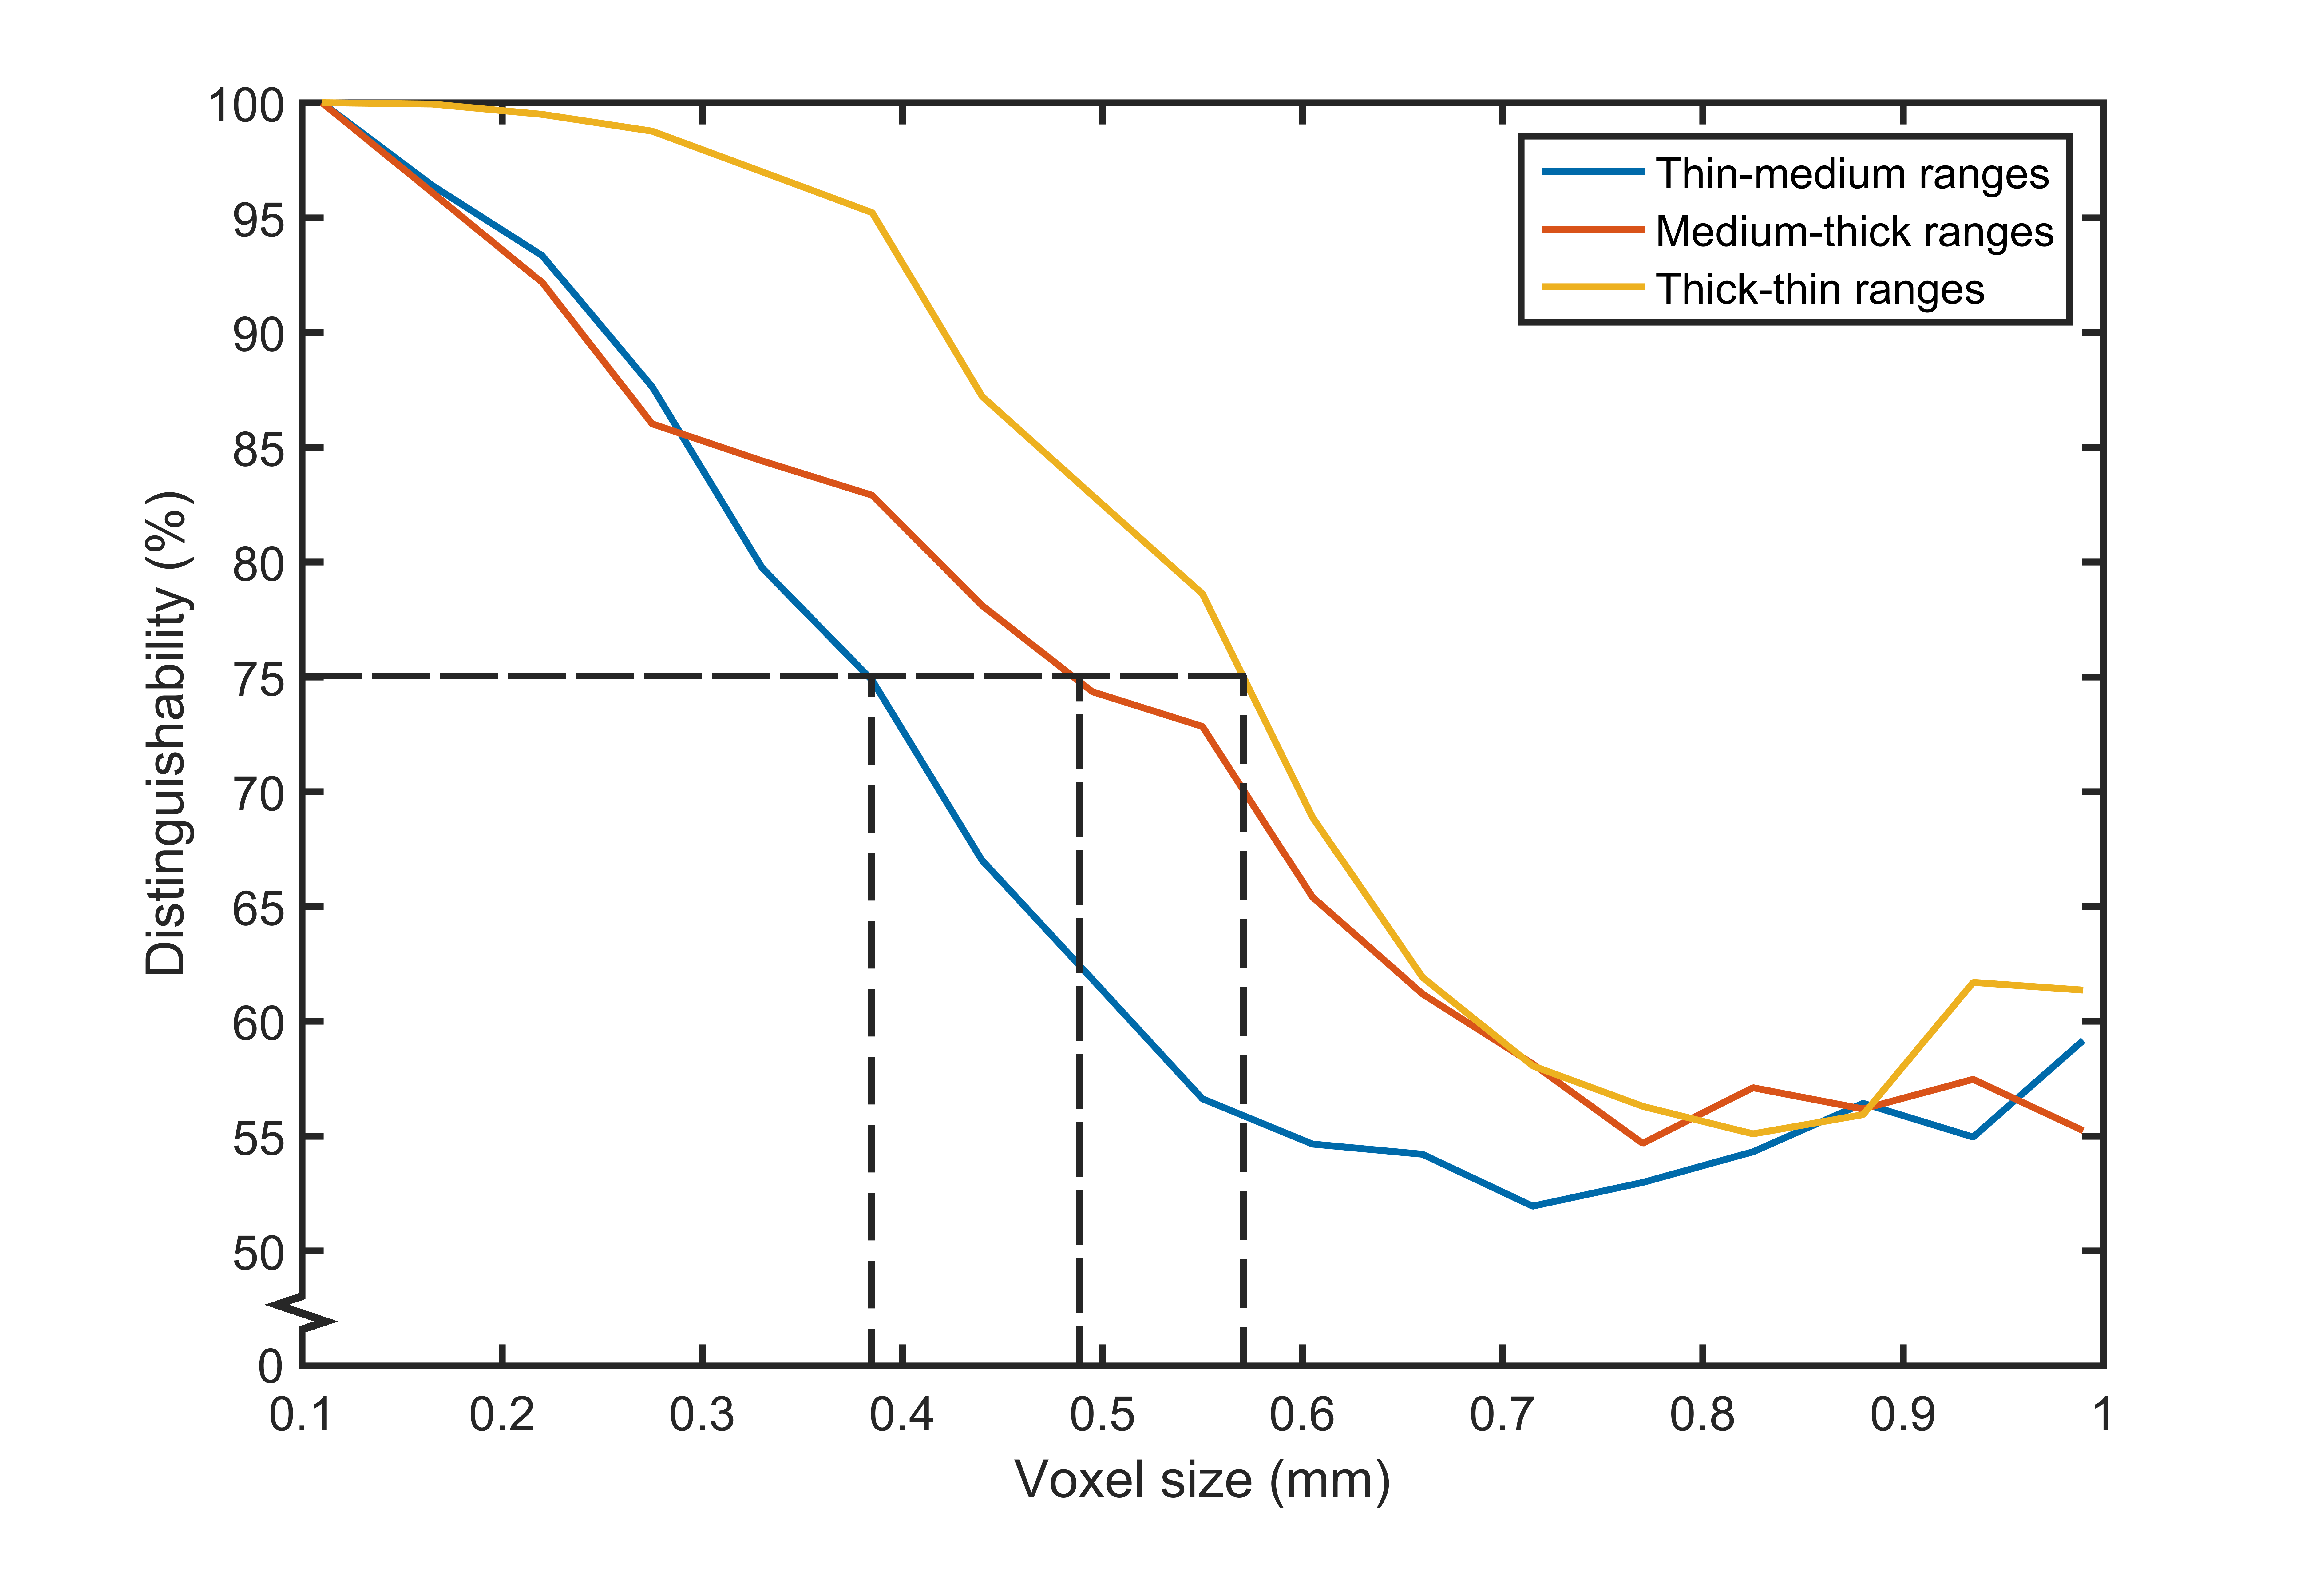
For the distinguishability estimation, a bootstrapping method was employed for sample generation. The distinguishability between two thickness ranges, Y and Z, at a given voxel size, was defined as the certainty that a new sample x, an element of unified sets Y and Z, was labeled in one of the thickness ranges over the other. The value of x was compared to that of randomly sampled values y and z, elements from Y and Z, respectively. If the value of x was closer to y than z, we assumed that x originated from Y, and vice versa. In total, 10,000 bootstrapped y-z pairs were compared to the value of x, yielding a percentage of labeling x into Y and Z. The highest percentage was taken as the certainty that sample x came from one set. By averaging over the highest percentages estimated for 10,000 samples x, the distinguishability was determined.
Results
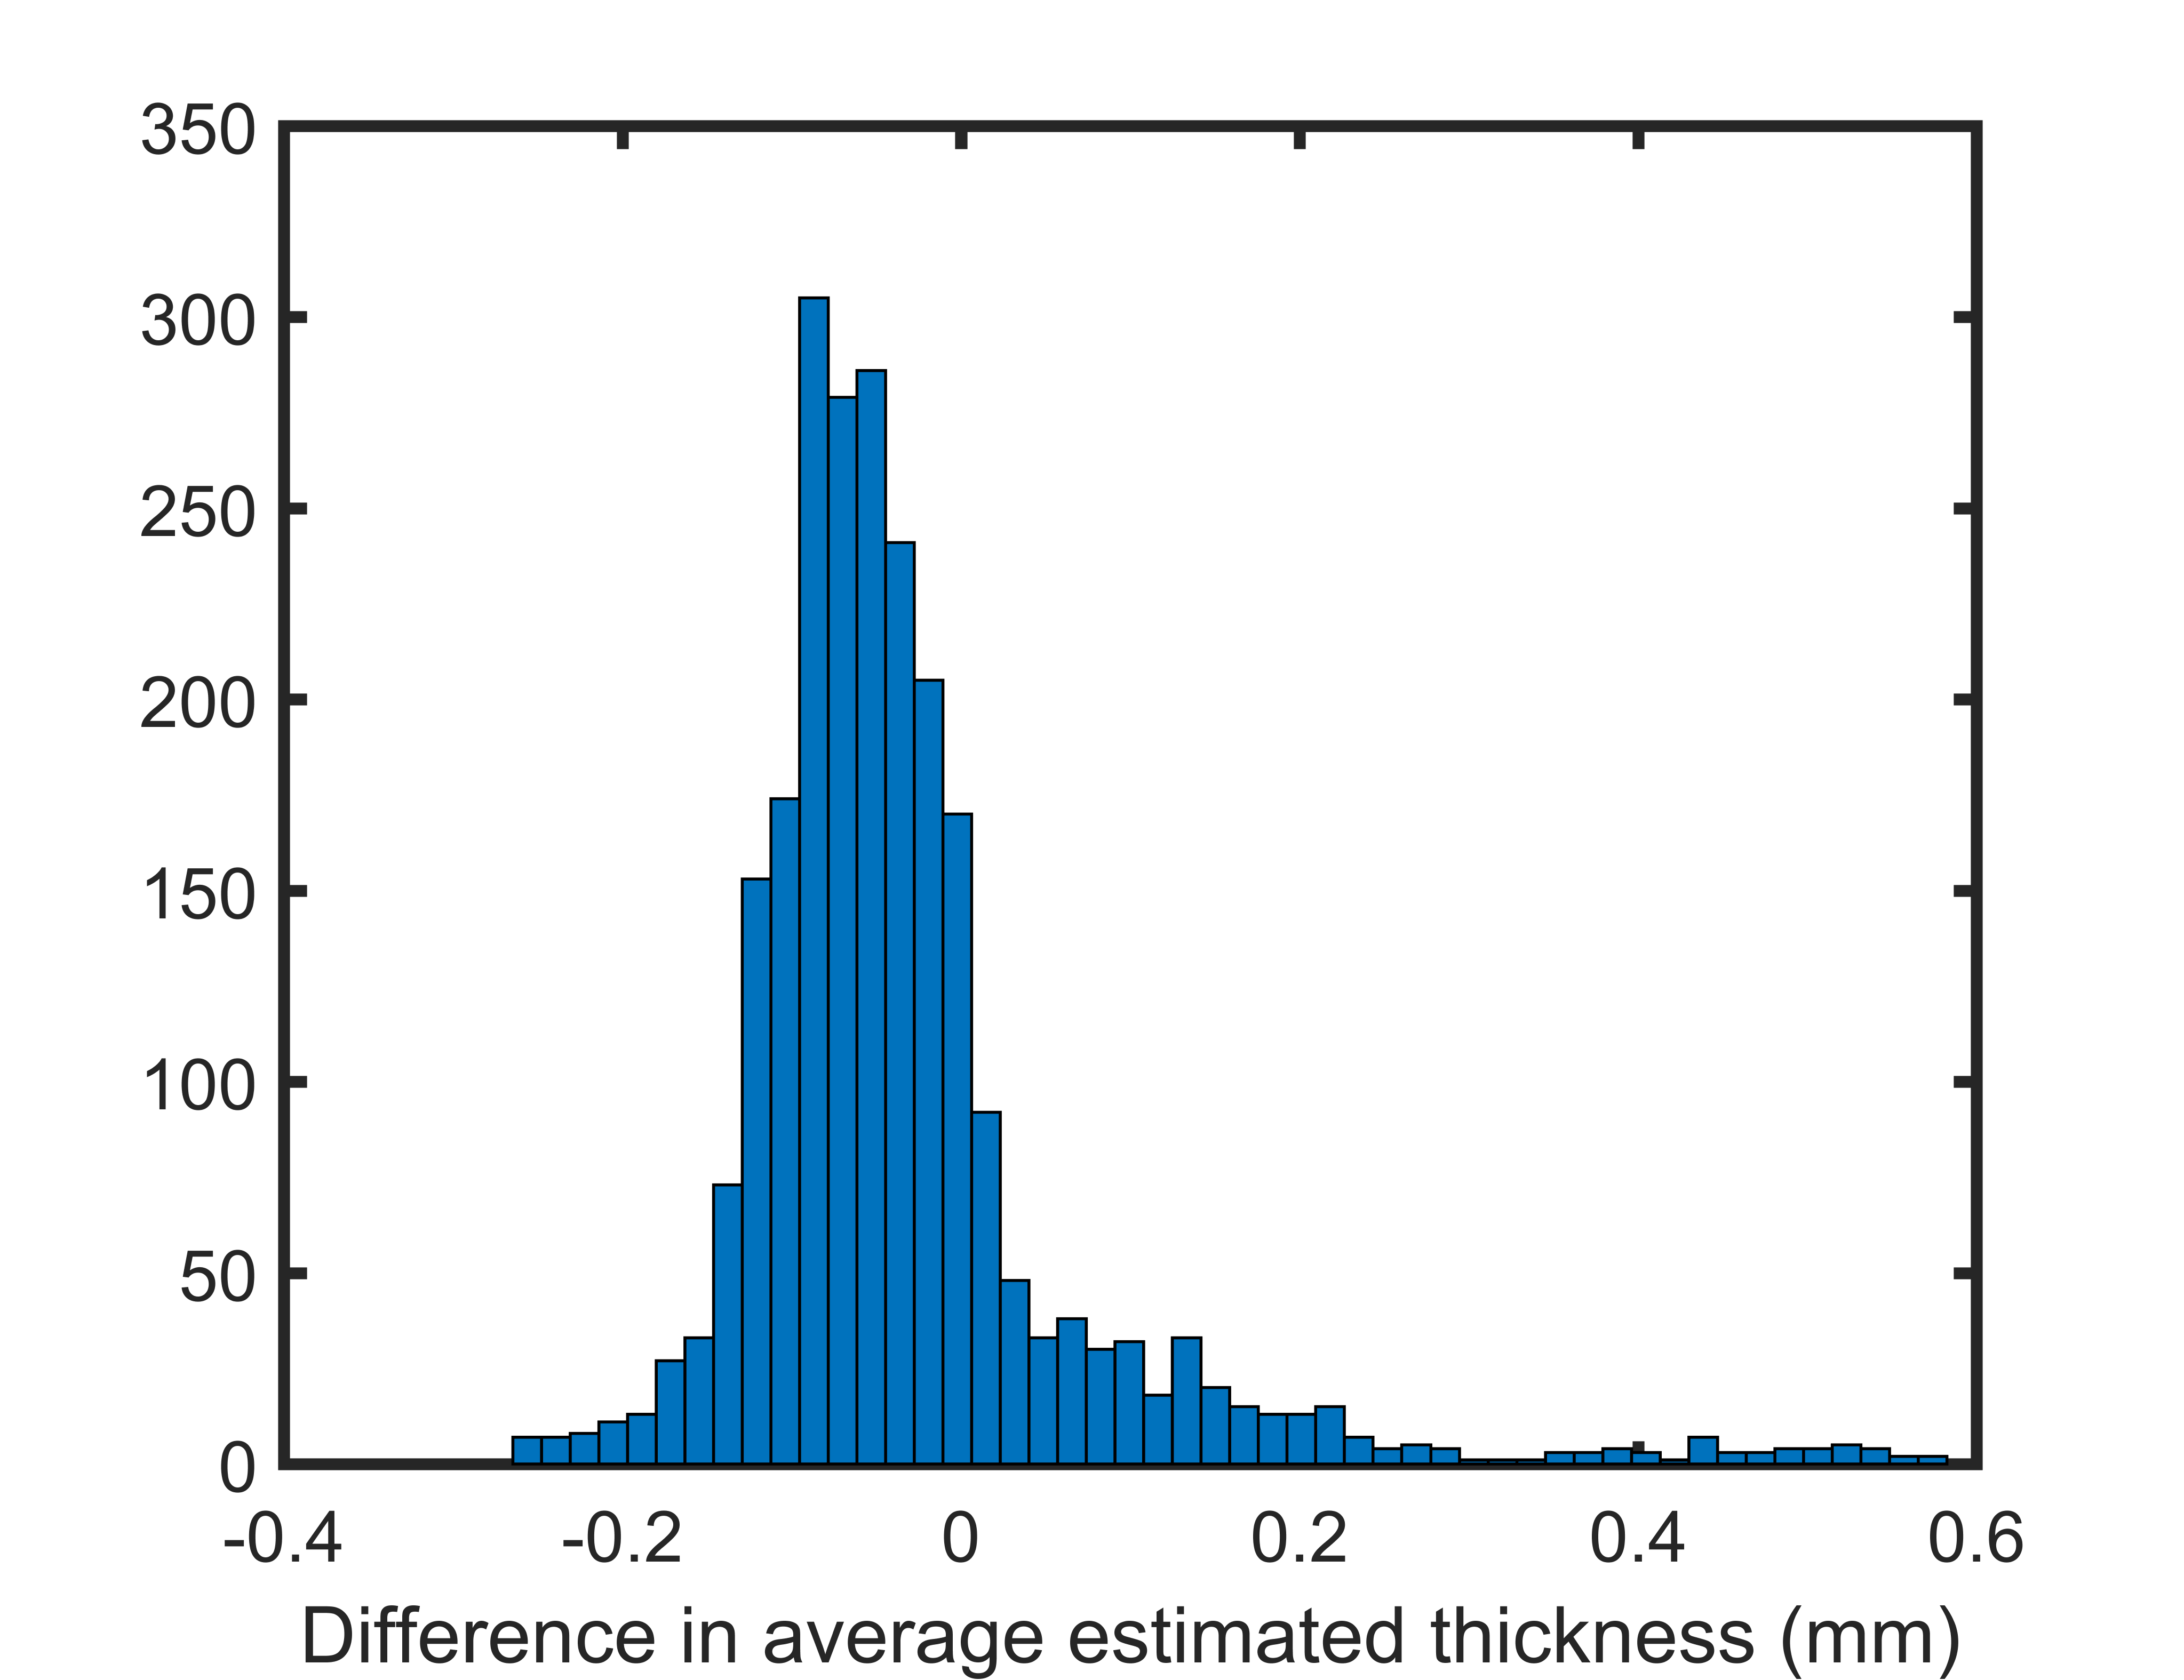
The reference thickness showed excellent agreement with previously validated manual measurements11, see Figure 2 (median and interquartile range difference: -0.052±0.08mm).
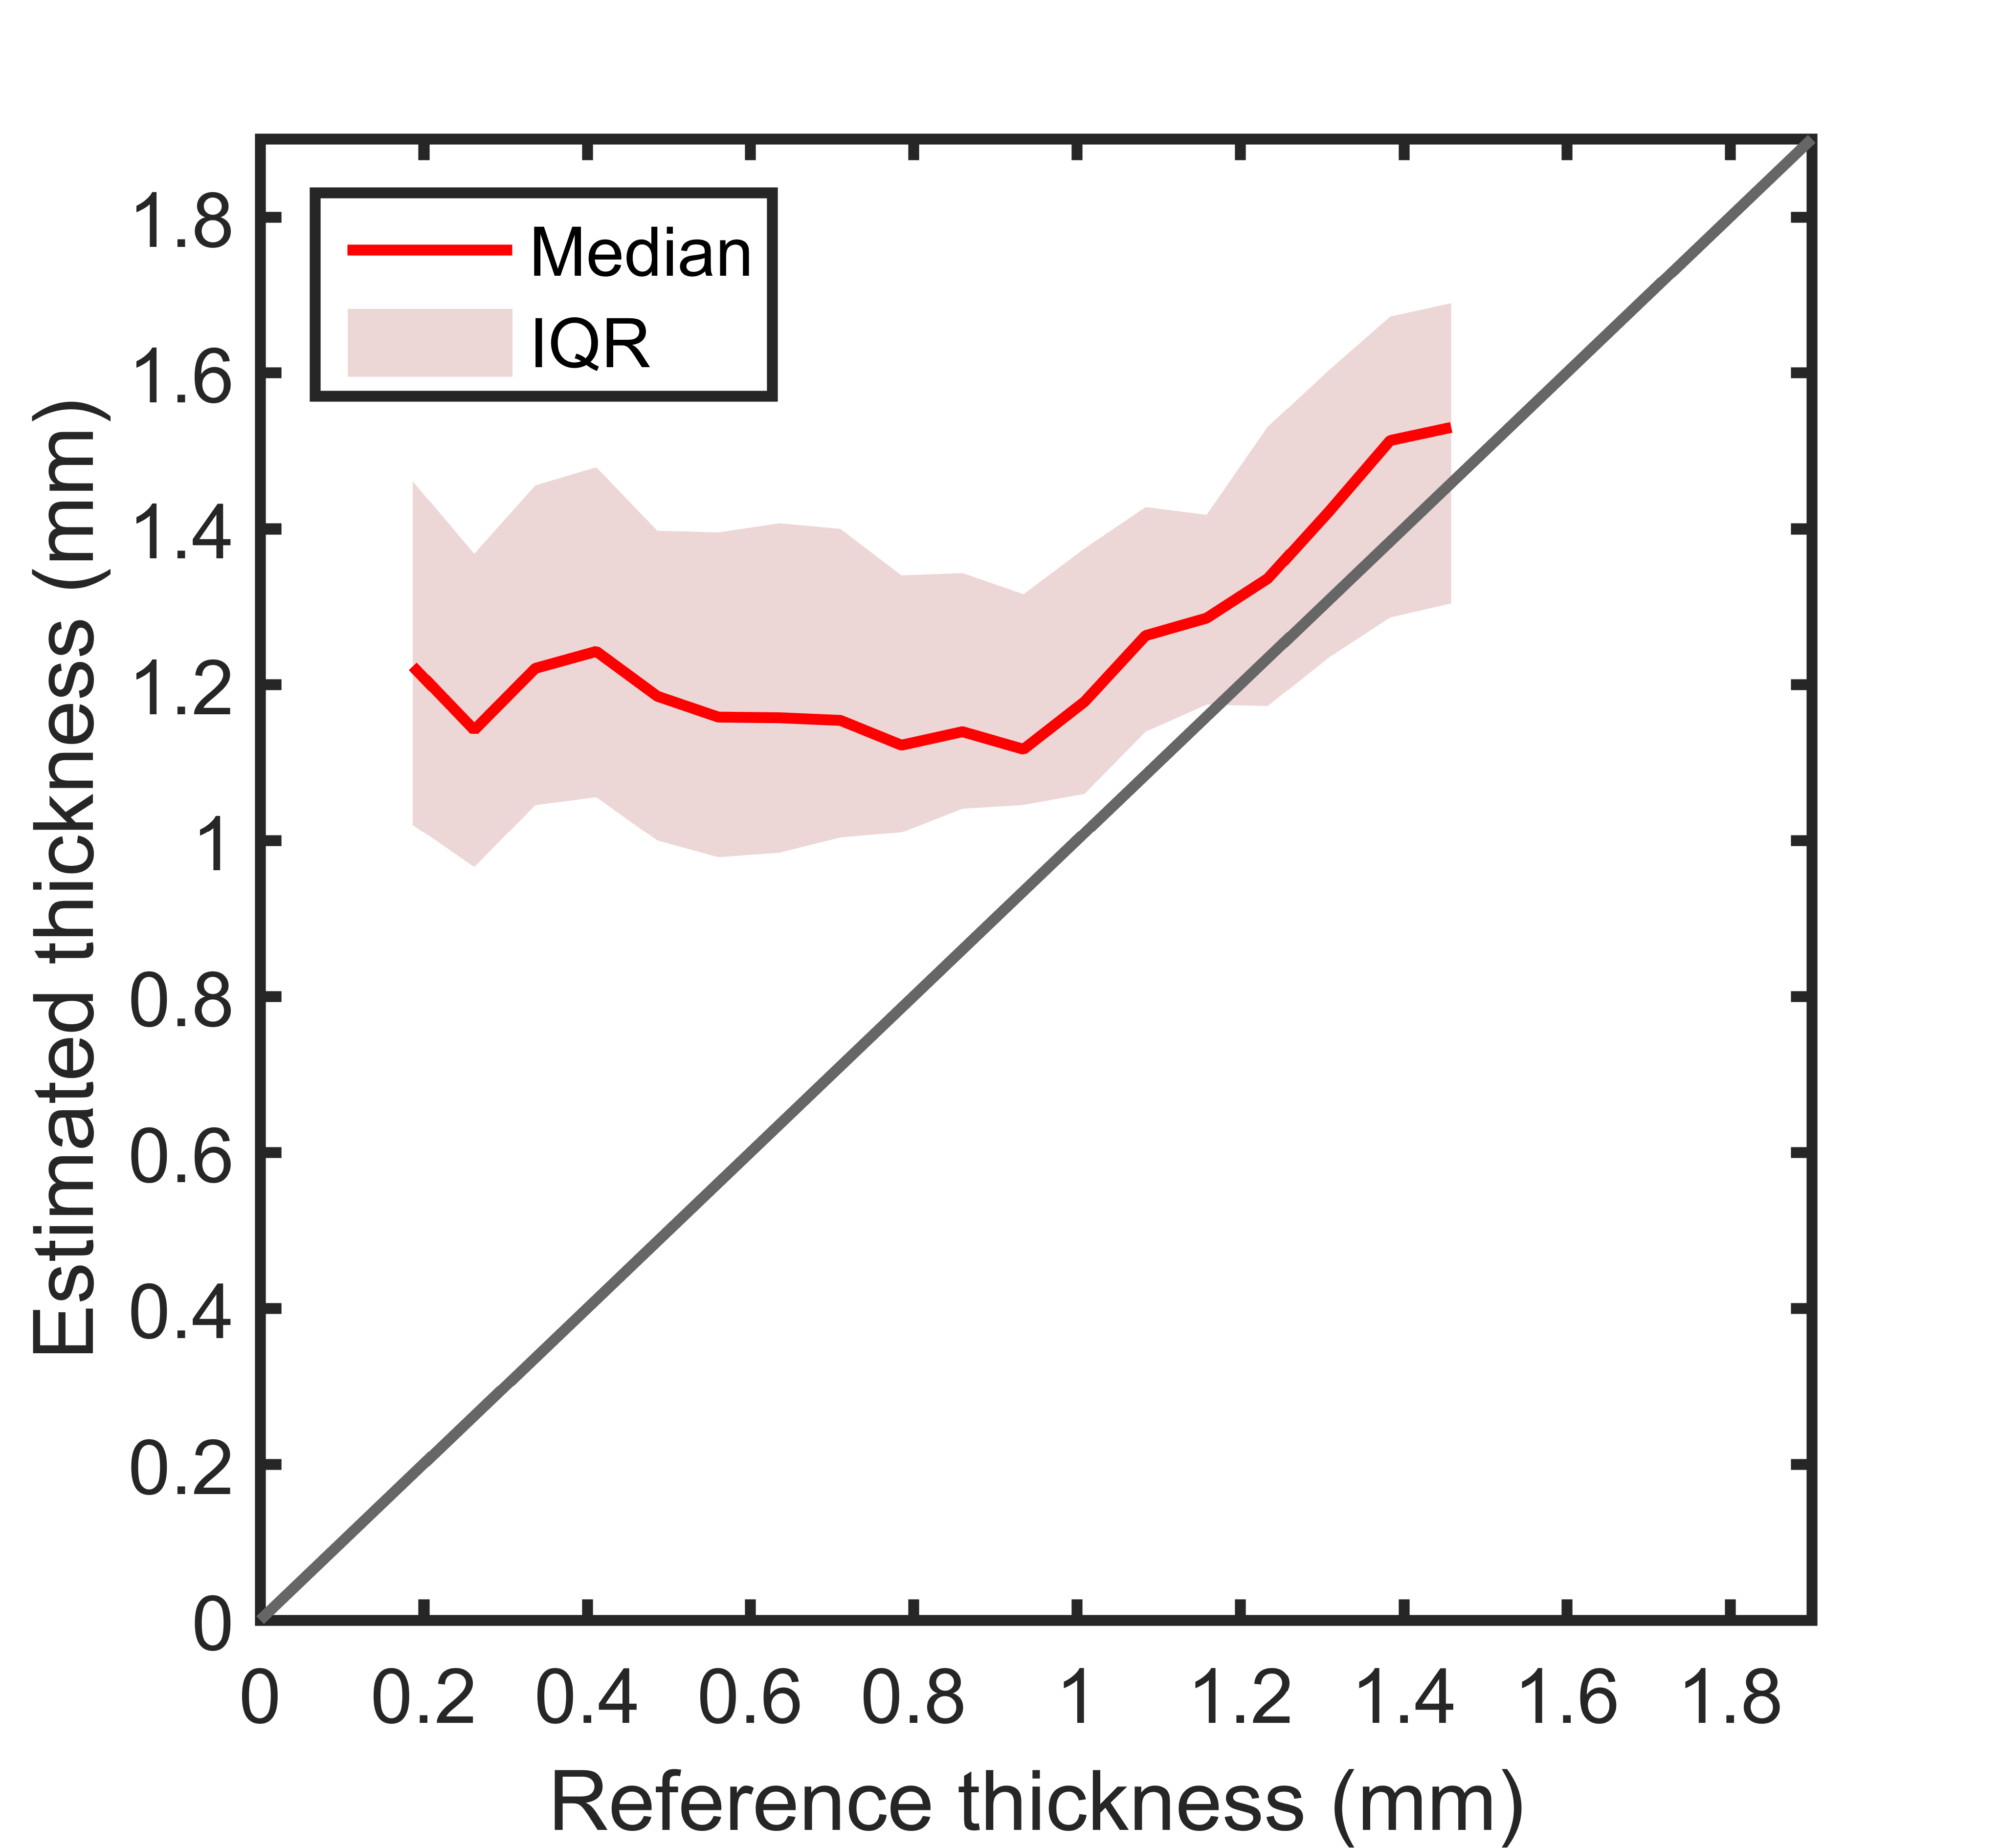
The second analysis showed that up to a reference thickness of 0.9mm, no differences in estimated thickness were measured from the low resolution images, see Figure 3. For thicker walls, the estimated thickness increased almost linearly with the reference thickness.
The downsampled images, in the last analysis, showed that when the voxel size increases, the spread and median estimated thickness increases as well (Figure 4). Up to a voxel size of 0.22mm, the median vessel wall thickness could be accurately estimated. Hereafter, the median thickness started to deviate from the reference thickness. At a voxel size of 0.55mm, the distinguishability between the thin and medium thickness ranges (Figure 5, blue line) was almost 50%, indicating that a new sample is labelled as thin or medium with equal chance. From a voxel size of 0.66mm, the estimated thickness is similar for the medium and thick ranges, given the low distinguishability at this voxel size.
Discussion and conclusion
With a clinically used low resolution protocol, we were unable to distinguish a diseased (thickened) vessel wall from a healthy (thin/medium) vessel wall based on conventional thickness measurements. For accurate thickness measurements, an increase in resolution is required. To distinguish thinner from thicker walls a voxel size smaller than 0.2mm and 0.66mm is required for unbiased and biased thickness measurements, respectively. More advanced image analysis methods can also increase the accuracy. Neural networks could potentially be trained to estimate the vessel wall thickness. In conclusion, with currently used techniques, measurements are prone to bias and inaccuracy when the true vessel wall thickness is around or below the voxel size, and should therefore be interpreted with caution.Acknowledgements
We thank Anna Kruseman, MSc, from the department of Radiology, UMC Utrecht, for discussions on statistical method for distinguishability analysis.References
1. Arenillas JF. Intracranial atherosclerosis: current concepts. Stroke. 2011;42(1 Suppl):S20-3.
2. Hingwala D, Kesavadas C, Sylaja PN, Thomas B, Kapilamoorthy TR. Multimodality imaging of carotid atherosclerotic plaque: Going beyond stenosis. The Indian journal of radiology & imaging. 2013;23(1):26-34.
3. Glagov S, Weisenberg E, Zarins CK, Stankunavicius R, Kolettis GJ. Compensatory enlargement of human atherosclerotic coronary arteries. The New England journal of medicine. 1987;316(22):1371-5.
4. Park JK, Kim SH, Kim BS, Choi G, Jeong SY, Choi JC. Imaging of intracranial plaques with black-blood double inversion recovery MR imaging and CT. Journal of neuroimaging : official journal of the American Society of Neuroimaging. 2011;21(2):e64-8.
5. Park JK, Lee CS, Sim KB, Huh JS, Park JC. Imaging of the walls of saccular cerebral aneurysms with double inversion recovery black-blood sequence. Journal of magnetic resonance imaging : JMRI. 2009;30(5):1179-83.
6. Sherif C, Kleinpeter G, Loyoddin M, Mach G, Plasenzotti R, Haider T, et al. Aneurysm wall thickness measurements of experimental aneurysms: in vivo high-field MR imaging versus direct microscopy. Acta neurochirurgica Supplement. 2015;120:17-20.
7. Underhill HR, Kerwin WS, Hatsukami TS, Yuan C. Automated measurement of mean wall thickness in the common carotid artery by MRI: a comparison to intima-media thickness by B-mode ultrasound. Journal of magnetic resonance imaging : JMRI. 2006;24(2):379-87.
8. Yuan M, Liu ZQ, Wang ZQ, Li B, Xu LJ, Xiao XL. High-resolution MR imaging of the arterial wall in moyamoya disease. Neuroscience letters. 2015;584:77-82.
9. Qiao Y, Guallar E, Suri FK, Liu L, Zhang Y, Anwar Z, et al. MR Imaging Measures of Intracranial Atherosclerosis in a Population-based Study. Radiology. 2016;280(3):860-8.
10. Zwanenburg JJ, van der Kolk AG, Hendrikse J, Luijten PR, Intracranial vessel wall imaging at 7 Tesla, ISMRM 2010, abstract number 1269
11. Harteveld AA, Denswil NP, van Hecke W, Kuijf HJ, Vink A, Spliet WGM, et al. Vessel wall thickness measurements of the circle of Willis using 7T MRI. Submitted for publication.
Figures