3454
4D flow MRI: Preliminary in vivo results comparing two commercially available analysis software platforms1Radiology, University of Wisconsin-Madison, Madison, WI, United States, 2Cardiovascular Medicine, University of Wisconsin-Madison, Madison, WI, United States
Synopsis
Main pulmonary artery (MPA) and ascending aorta flow was quantified from 4D flow MRI using two commercially available software programs. Flow measurements made in three locations in each of these vessels were internally consistent with negligible bias for both programs. Furthermore, differences in mean MPA and aorta flow between programs were also negligible. These preliminary results are encouraging in affirming the reproducibility and reliability of flow measurements from clinical 4D flow MRI acquisitions.
Purpose
Four-dimensional (4D) flow magnetic resonance imaging (MRI) is increasingly used in clinical cardiac MRI (CMR). As 4D flow MRI becomes part of routine clinical practice, it is critical to assess the reproducibility of measurements across platforms for acquisition and analysis. Barker, et al.1 reported consistent results for main pulmonary artery (MPA) flow and wall shear stress in healthy volunteers and subjects with pulmonary hypertension using two different manufacturers’ scanners and the same pre-clinical analysis software2. The purpose of this study was to measure the variability in MPA and ascending aorta (AAo) flow (Q) in healthy and clinical volunteers using a commercially available 4D flow MRI sequence analyzed using two commercially available 4D flow MRI analysis packages.Methods
MR Imaging: This was an IRB approved and HIPAA compliant retrospective study. Data from 13 subjects (8F/5M, 40.5±18.9 years, 7 healthy volunteers and 6 clinical subjects) was included in the analysis. 4D flow MRI was performed with a commercially available sequence with Cartesian sampling on 1.5T and 3.0T scanners (GE Healthcare, Waukesha, USA) with the following parameters: field-of-view = 360-440 x 360-440 mm, matrix = 180 x 180, acquired resolution = 2-2.44 x 2-2.44 mm, acquired slice thickness = 2.4-3.0 mm, reconstructed resolution = 1.20-1.50 x 1.41-1.72 x 1.41-1.72 mm, flip angle = 8-15 degrees, TR/TE = 4.54-5.65/2.02-2.93, Hyperkat acceleration = 6-8x, and velocity encoding = 160-200 cm/s. 4D flow MRI was set up in the sagittal orientation with the number of slices adjusted to cover the entire heart (38-80 slices). Scan time was 3.4-7.3 minutes. 4D flow MRI was performed after the administration of 0.15mmol/kg gadobenate dimeglumine (Multihance, Bracco Diagnostics, Monroe Township, USA) in the six clinical subjects. 4D flow MRI in all healthy volunteers was performed without IV contrast.
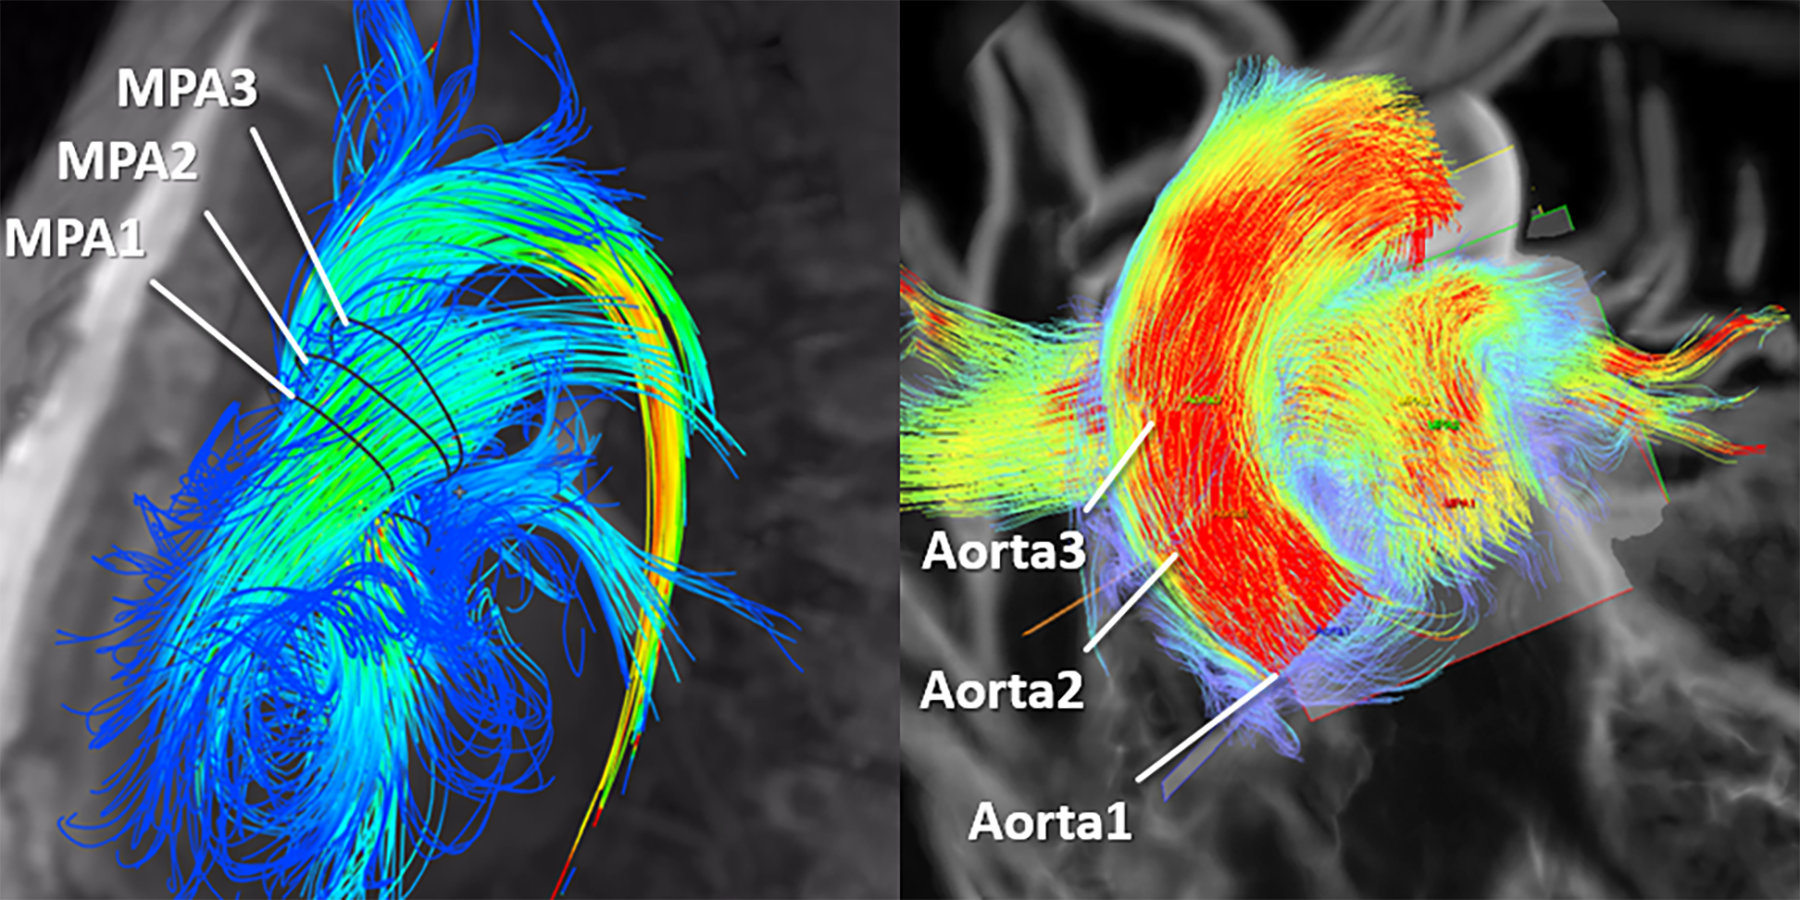
Flow Analysis: Anonymized 4D flow MRI data were loaded into two commercially available software packages, software 1 (Arterys, v. 2.4.0, Arterys, San Francisco, USA) and software 2 (cmr42, v. 5.6.3, Circle Cardiovascular Imaging, Inc. Calgary, Canada). Background and eddy current correction was performed prior to analysis. Three analysis planes were placed in the MPA (MPA1-3) and Aorta (AAo1-3) (Figure 1). The vessels were segmented with contours automatically propagated to all phases. Contours were manually adjusted on each phase, as needed, to include all of the flow. The net forward flow for each plane was recorded for both software programs.
Statistical Analysis: The consistency of three measurements of MPA1-3 and AAo1-3 was assessed by measuring the differences in those measurements (MPA1-MPA2, MPA1-MPA3, MPA2-MPA3, AAo1-AAo2, AAo1-AAo3, AAo2-AAo3). To compare the differences in measurements using each of the different software programs, differences in average MPA flow (QMPA), aorta flow (QAAo), and the ratio of QMPA/QAAo were analyzed using Bland-Altman analysis. Statistical comparisons were made with two-tailed t-test, a = 0.05.
Results
QMPA was 76.9±14.1 (39.6-99.0) mL with software 1 and 76.0±10.9 (46.7-95.9) mL with software 2 (p>0.05). QAAo was 75.0±13.3 (44.3-104.1) mL with software 1 and 76.9±13.0 (53.9-105.1) mL with software 2 (p>0.05). QMPA/QAAo was 1.02±0.09 (0.84-1.22) with software 1 and 1.00±0.10 (0.87-1.20) with software 2 (p>0.05). With respect to internal consistency of the flow measurements, the mean differences in MPA1-3 and AAo1-3 flow measurements were 0.38±5.50 mL and 4.31±6.18 mL with software 1, respectively, and 0.42±4.59 mL and 0.28±5.75 mL with software 2, respectively. With respect to measurements made by each software, the mean differences in QMPA, QAAo and QMPA/QAAo between the two programs were 0.92±5.78 mL, -1.81±5.06 mL, and 0.03±0.10, respectively (Figure 2).Conclusions
Quantification of QMPA, QAAo and QMPA/QAAo from 4D flow MRI using two commercially available software programs yields consistent internal and cross-vendor results. These preliminary results are encouraging in affirming the reproducibility and reliability of flow measurements from clinical 4D flow MRI acquisitions.Acknowledgements
The University of Wisconsin-Madison, Department of Radiology receives research support from GE Healthcare.References
1. Barker, AJ et al. Four-dimensional flow assessment of pulmonary artery flow and wall shear stress in adult pulmonary arterial hypertension: results from two institutions. Magn Reson Med 2015;73: 1904.
2. Stalder, A et al. Quantitative 2D and 3D phase contrast MRI: optimized analysis of blood flow and vessel wall parameters. Magn Reson Med 2008;60: 1218.
Figures