3453
Experimental Validation of 4D Flow MRI for the Assessment of Recirculation and Acceleration using Tomographic Particle Image Velocimetry1Mechanical Engineering, University of Wisconsin-Madison, Madison, WI, United States, 2Biomedical Engineering, University of Wisconsin-Madison, Madison, WI, United States, 3Radiology, University of Wisconsin-Madison, Madison, WI, United States
Synopsis
4D flow MRI has shown to be a feasible tool for the assessment of hemodynamics in different vascular territories, however reliable validation using gold standard fluid dynamics experiments is needed for improvement of its accuracy and precision. Particle image velocimetry (PIV) is an experimental technique widely used in engineering analysis of fluids. PIV measures flow velocity by optically tracking the movement of laser-illuminated particles. The purpose of this study was to validate 4D Flow MRI for the assessment of flow recirculation and acceleration using tomographic PIV.
Introduction
Four-dimensional (4D) flow magnetic resonance imaging (Flow MRI) can capture three-directional (3D) velocity throughout the cardiac cycle non-invasively, allowing accurate blood velocity and flow rate measurements at any location in the body.1,2 However, this technique is still an ongoing development, with some limitations that include insufficient spatial resolution and high sensitivity to velocity encoding settings. Therefore, analysis of areas where high and low velocities are both present (arterial stenosis and aneurysms) is difficult and requires reliable validation to further expand its clinical use. Recent studies have used particle image velocimetry (PIV) to validate MRI by optically measure flow velocity using cameras to capture movement of particles illuminated by a laser.3,4,5,6 Among the techniques available for PIV, tomographic PIV (tomo-PIV) uses 3D cross-correlation to determine the corresponding velocity field, allowing for the visualization and quantification of all three velocity components in three-dimensional flow domains (3D3C).7,8 The purpose of this study was to validate 4D Flow MRI for the assessment of flow recirculation (aneurysm) and acceleration (stenosis) using tomo-PIV.Methods
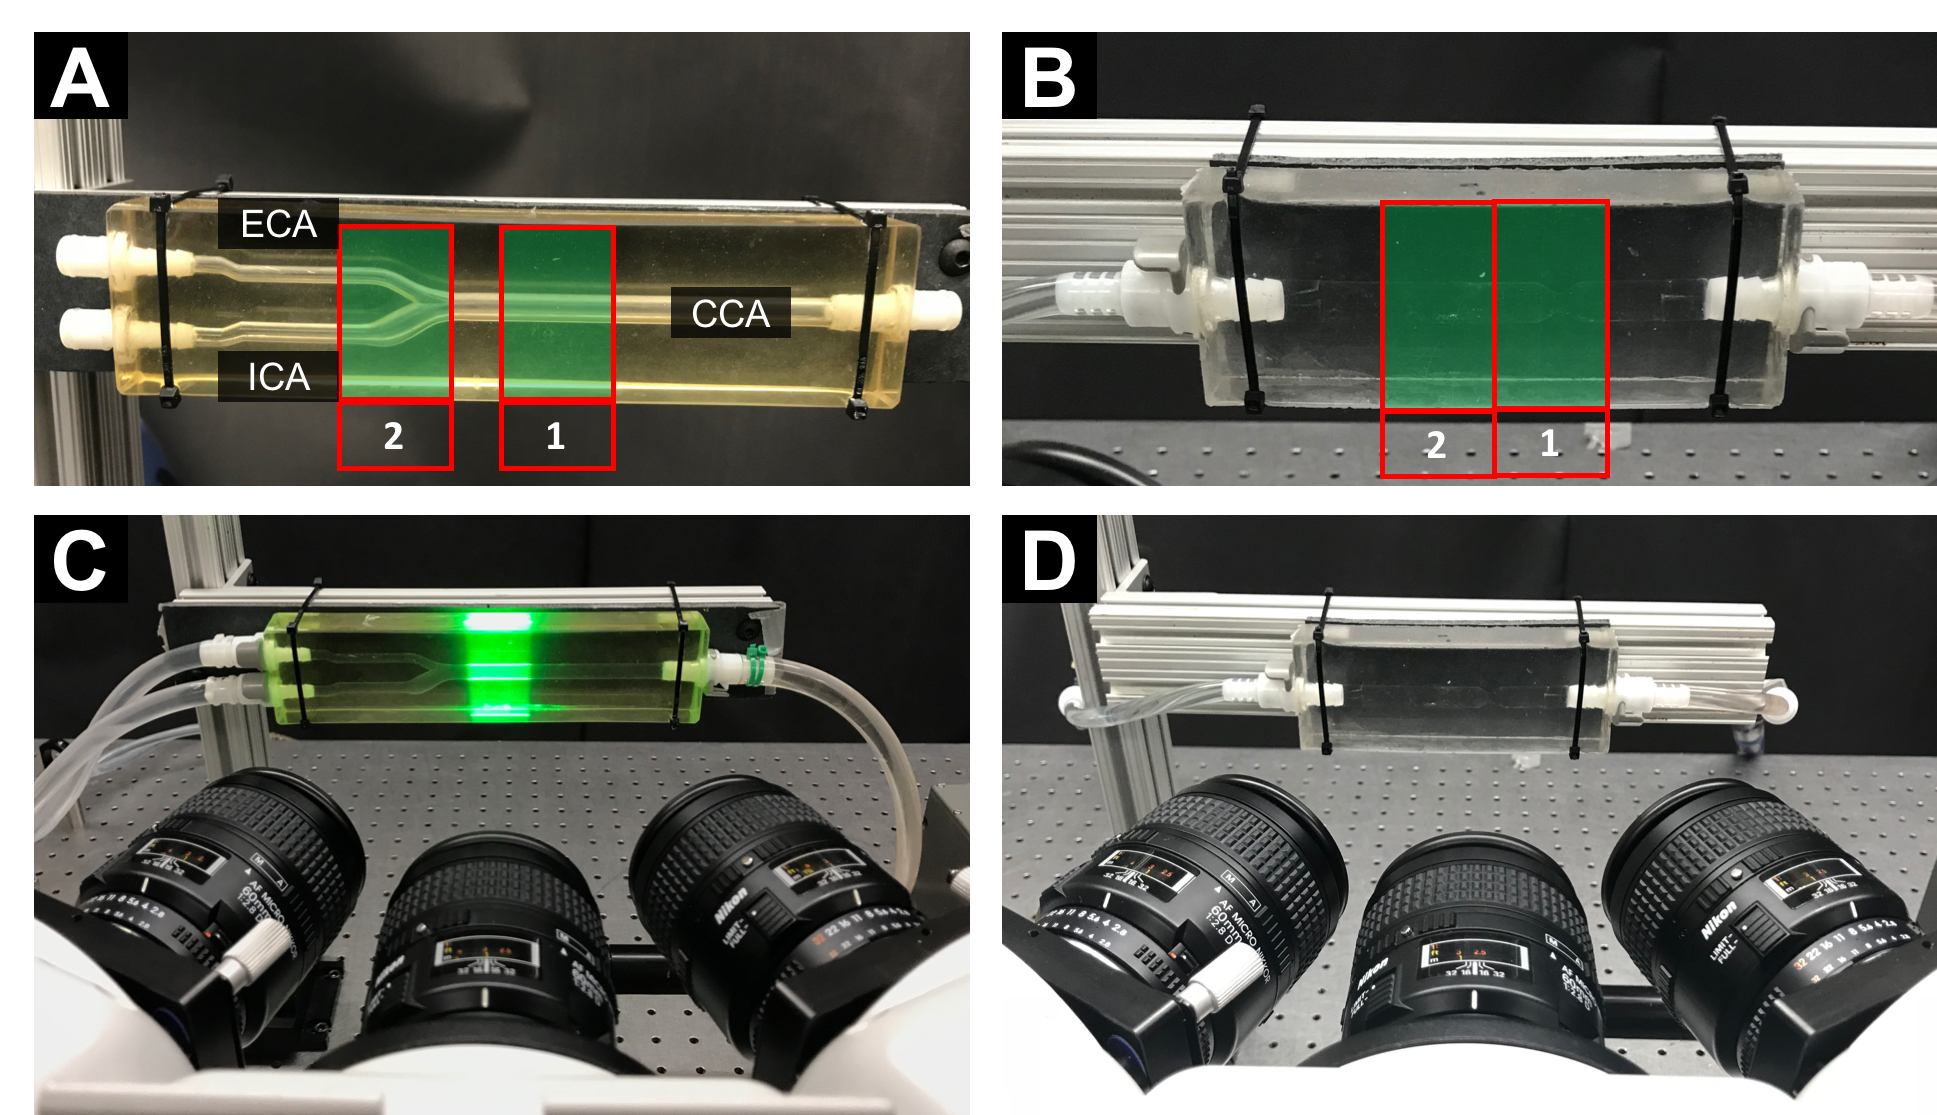
MR Imaging: Two silicone phantoms: a carotid artery bifurcation (Fig. 1A) and an idealized stenosis (Fig. 1B) were used. The phantoms were perfused with pulsatile flow using a positive displacement pulsatile pump in line with a hemodynamic conditioning head (BDC PD-1100, BDC Laboratories, Wheat Ridge, CO). The phantoms were scanned on a clinical 3T scanner (Discovery MR 750, GE Healthcare, Waukesha, WI), using a wrist coil. 4D flow MRI was performed with a 5-pt radial-undersampled technique, PC-VIPR.9 Imaging parameters were as follows: imaging volume: 24 x 24 x 24 cm; 0.625 mm acquired isotropic spatial resolution; TR/TE = 6.4/1.8 ms. The velocity encoding (Venc) was specified to 80 cm/s (carotid artery) and 150 cm/s (stenosis). MRI was performed while a solution of water and glycerol circulated through the model at 1 L/min simulating a heart rate of 60 beats per minute. The MRI scans were gated to the pulse frequency of the pump.
Tomographic PIV: Tomo-PIV was performed on the phantoms using a Flowmaster PIV system (LaVision, Göttingen, Germany) consisting of a laser beam projected in the direction perpendicular to three high-speed cameras (Phantom v341) (Fig. 1C-D). A solution, seeded with polyamide particles (mean diameter = 20 mm), of 60% glycerol and 40% water was pumped at 1 L/min through the model. Double-frame images were recorded for one cardiac cycle at a frame rate of 400 Hz, with time separation of 180 ms and 90 ms for the bifurcation and the stenosis, respectively.
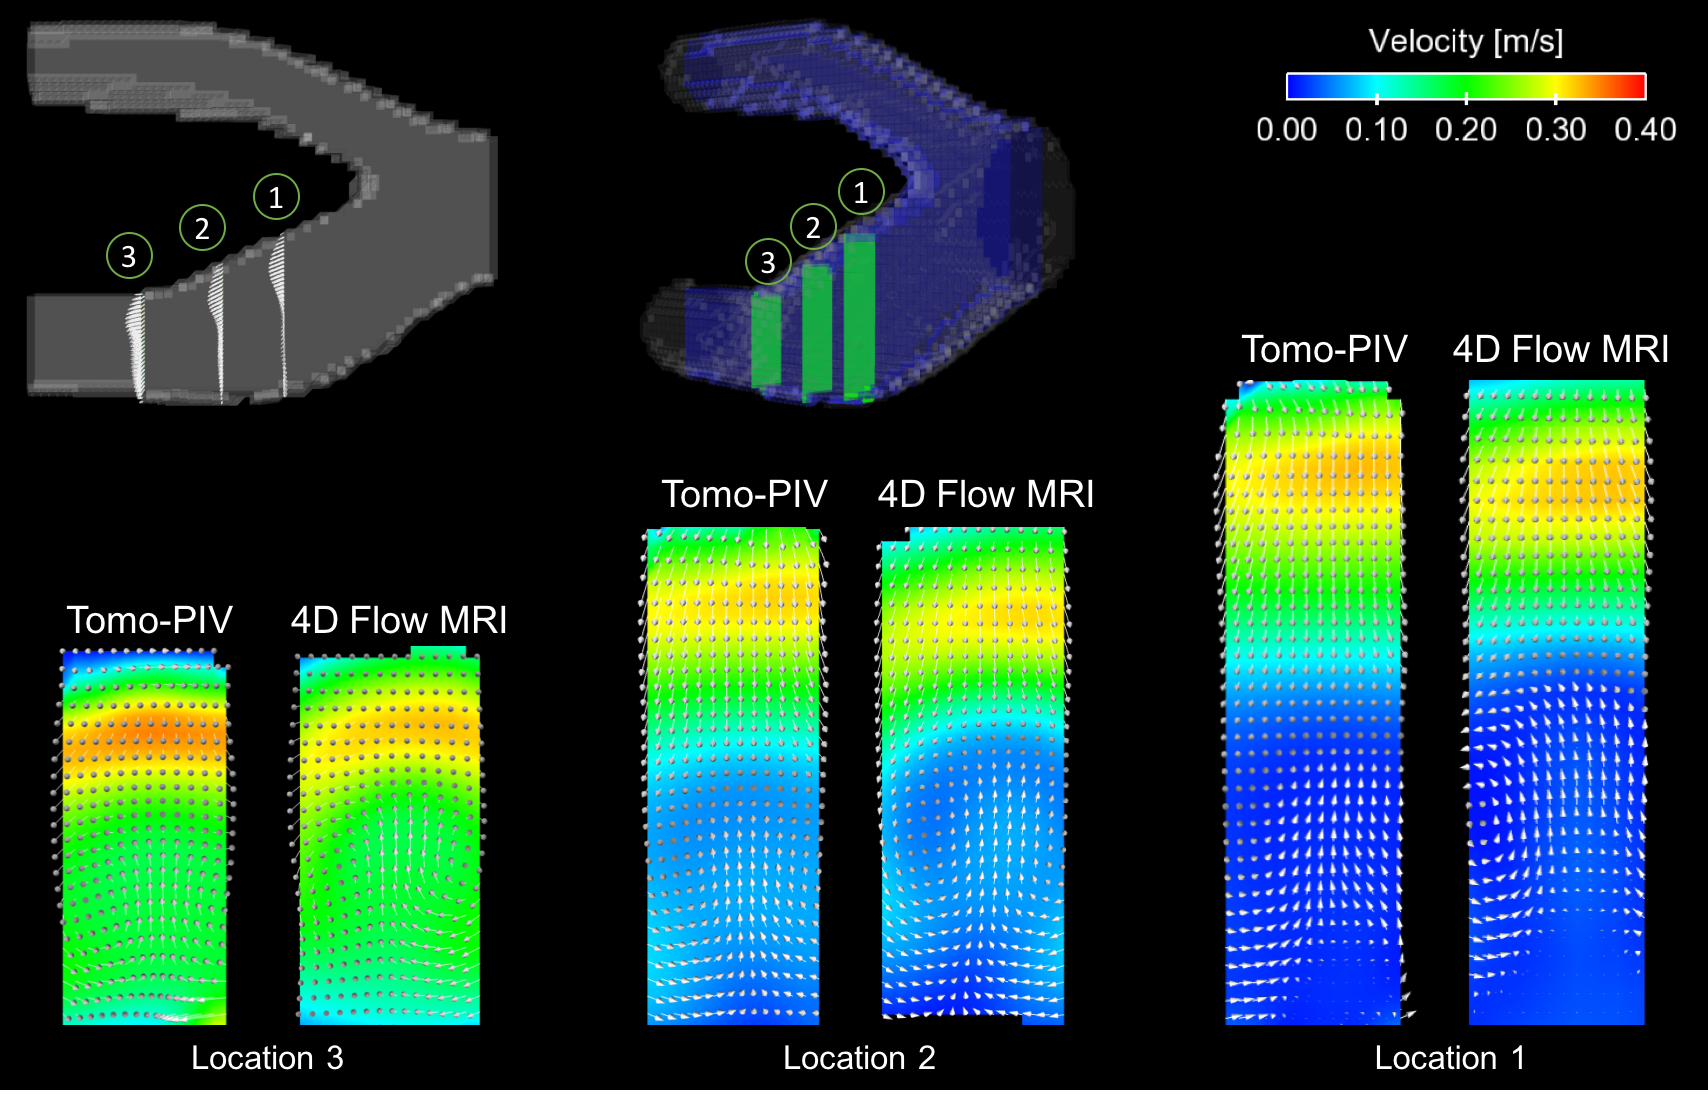
Data Analysis: Data from PIV and 4D Flow MRI was visualized and quantified in Ensight (CEI Inc., Apex, NC). Recirculation and acceleration were analyzed at a longitudinal plane located at the center of the vessel. In addition, 3 mm transverse planes were extracted from the 4D Flow MRI data, for direct comparison with tomo-PIV. This analysis was performed at the ICA of the bifurcation and through the stenosis to study the complex flow in different regions.
Results
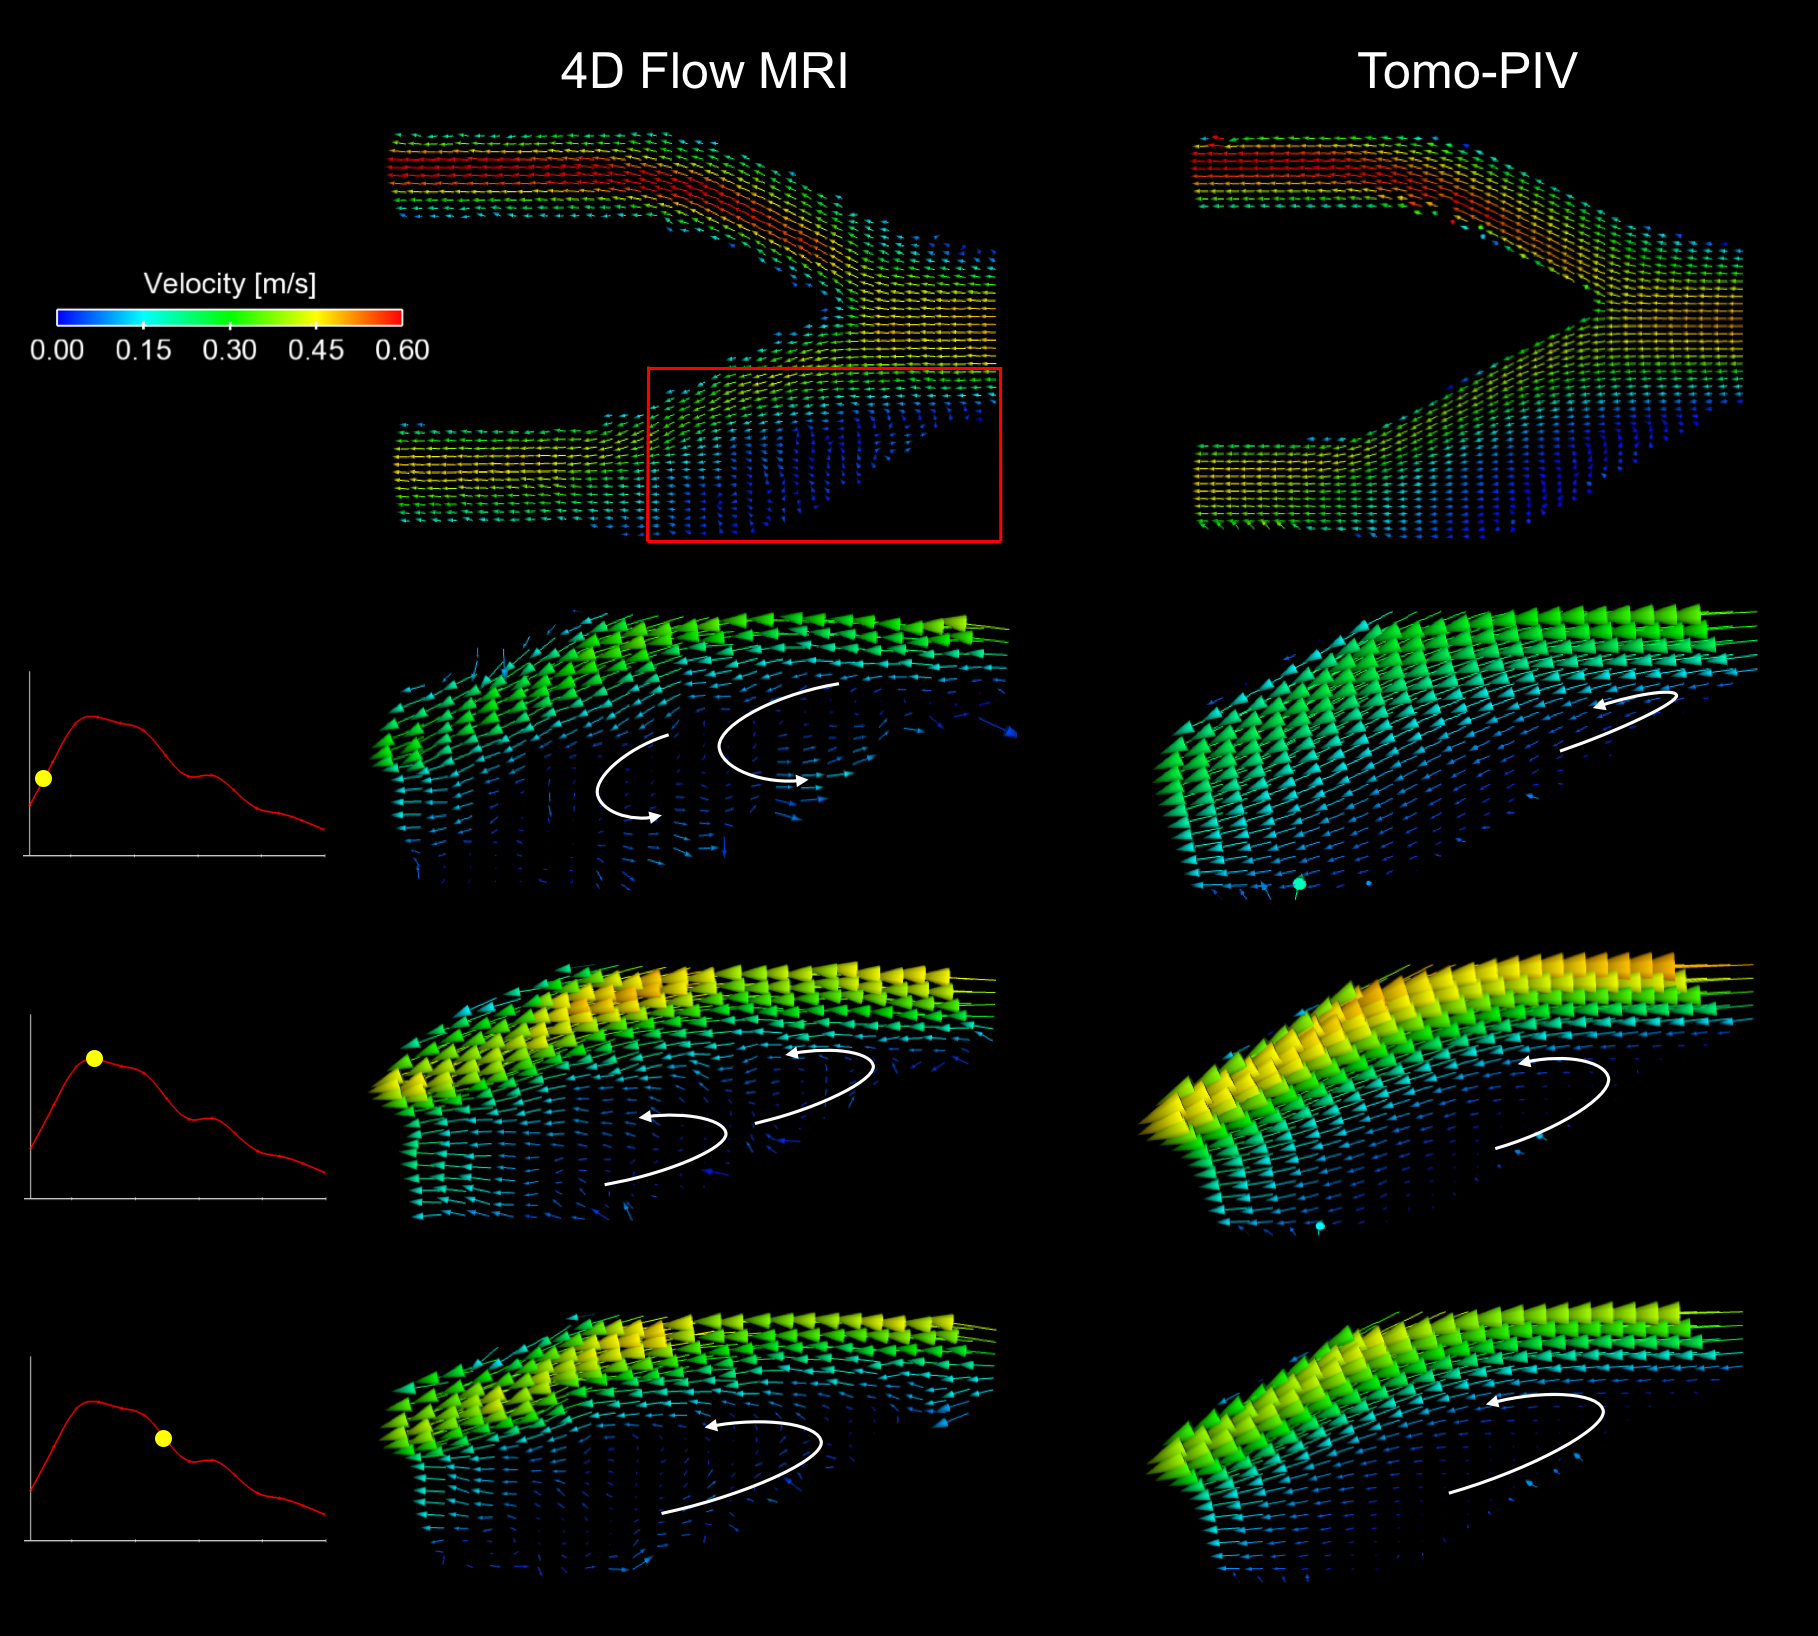
Satisfactory quantitative and qualitative agreement of the velocity measurements was observed between 4D flow MRI and tomo-PIV. Fig. 2 shows the recirculation regions found with both methods at the longitudinal plane, including a magnified area for a more detail analysis. The 3D comparison of the recirculating area at the ICA is presented in Fig. 3, where vectors show the directionality of the flow. Analysis of the stenosis model at the longitudinal plane shows great qualitative agreement in the acceleration of the flow (Fig. 4). A comparison of velocity measurements at transverse planes through the stenosis model is shown in Fig. 5.Discussion
Flow recirculation and acceleration were well represented by the in vitro setup used. Some regions within ICA recirculation were not well captured by 4D Flow MRI. It is hypothesized that this might be due to the low velocity in relation to the VENC or lower spatial and temporal resolution compared to tomo-PIV. Another evident difference was the velocity distribution at the stenosis, where the velocity jet from MRI showed a spatial delay with respect to that in tomo-PIV, however this spatial delay was expected.Conclusion
4D Flow MRI is a valuable medical imaging technique that has shown promising results assessing in vivo hemodynamics. PIV provides great insight into the velocity field within the model, using a superior acquisition rate and spatial resolution. Further analysis of PIV results will allow evaluation of different flow regimes such as turbulent flow and boundary layer effects, not possible with MRI due to the limited temporal and spatial resolution.Acknowledgements
We acknowledge support from the AHA (14SDG19690010), UW Radiology R&D and GE Healthcare.References
- Markl, M., A. Harloff, T. A. Bley, M. Zaitsev, B. Jung, E. Weigang, M. Langer, J. Hennig, and A. Frydrychowicz. Time-resolved 3D MR velocity mapping at 3T: improved navigator-gated assessment of vascular anatomy and blood flow. J. Magn. Reson. Imaging 25:824–31, 2007.
- Rebergen, S. A., E. E. Van Der Wall, and J. Doornbos. Magnetic resonance measurement of velocity and flow: Technique, validation, and cardiovascular applications. 1993.
- Khodarahmi, I. In vitro validation of flow measurement with phase contrast MRI at 3 tesla using stereoscopic particle image velocimetry and stereoscopic particle image velocimetry‐. J. Magn. … 1485:1477–1485, 2014.
- Hasler, D., A. Landolt, and D. Obrist. Tomographic PIV behind a prosthetic heart valve. Exp. Fluids 57:1–13, 2016.
- Im, S., G. E. Heo, Y. J. Jeon, H. J. Sung, and S. K. Kim. Tomographic PIV measurements of flow patterns in a nasal cavity with geometry acquisition. Exp. Fluids 55, 2014.
- Kitajima, H. D., K. S. Sundareswaran, T. Z. Teisseyre, G. W. Astary, W. J. Parks, O. Skrinjar, J. N. Oshinski, and A. P. Yoganathan. Comparison of particle image velocimetry and phase contrast MRI in a patient-specific extracardiac total cavopulmonary connection. J. Biomech. Eng. 130:41004, 2008.
- Elsinga, G. E., F. Scarano, B. Wieneke, and B. W. Van Oudheusden. Tomographic particle image velocimetry. Exp. Fluids 41:933–947, 2006.
- Buchmann, N. A., C. Atkinson, M. C. Jeremy, and J. Soria. Tomographic particle image velocimetry investigation of the flow in a modeled human carotid artery bifurcation. Exp. Fluids 50:1131–1151, 2011.
- Johnson, K.M., Markl, M. Improved SNR in phase contrast velocimetry with five-point balanced flow encoding. Magn. Reson. Med. 2010; 63, 349–355.
Figures