3451
Assessment of Pulmonary Artery Mean Pressure with MRI and 4D Flow Vortex Assessment.1Division of Radiology, Geneva University Hospitals, Geneva, Switzerland, 2Division of Pediatric Cardiology, Geneva University Hospitals, Geneva, Switzerland, 3Division of Pneumology, Geneva University Hospitals, Geneva, Switzerland
Synopsis
Flow vortices have been observed in patients with elevated pulmonary artery pressure. We investigated 4D flow MRI and software packages to quantify vortex duration. This parameter was assessed compared to other MRI derived measurements to provide a potential non-invasive alternative to right heart catheterization.
Background
A robust non-invasive method to estimate increased pulmonary artery mean pressure (mPAP) is needed. Recently, a 2D velocity encoding MRI study has shown that vortex duration in the pulmonary artery (PA) was related to mPAP1. This present study investigated the potential of 4D flow MRI to assess pulmonary artery hypertension.Methods
Eighteen patients with suspected Chronic Thromboembolic Pulmonary Hypertension (CTEPH) were assessed by right heart catheterization (RHC) and cardiac MRI, including a 4D phase contrast flow sequence on a Siemens 3T PRISMA. Parameters included a spatial resolution of approximately 2mm isotropic, temporal resolution 20-40ms (both depending on patient anatomy and physiology), 60 slices, and 3 directions of flow encoding with venc 150cm/s.
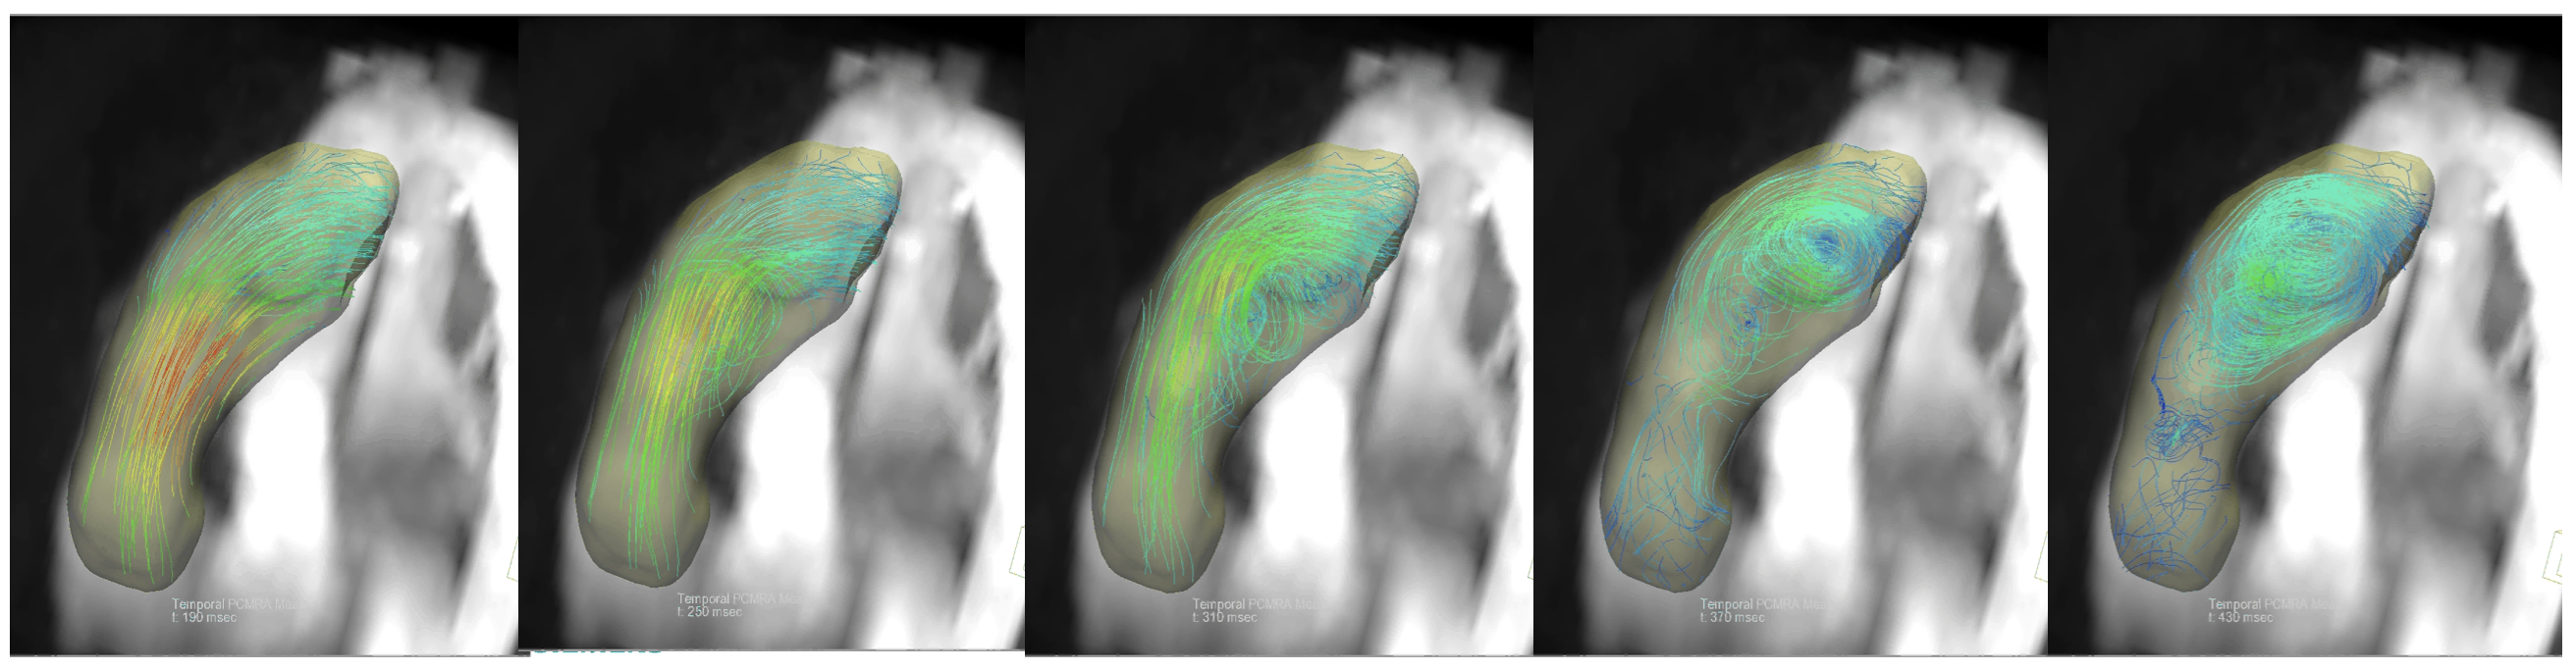
For the 4D Flow analysis, streamlines were reconstructed in the pulmonary artery and the duration of the vortical blood flow, defined as closed concentric ring-shaped curves parallel to the pulmonary artery (PA), was measured as a % of the cardiac cycle. This measurement was repeated with both Siemens 4DFlow and GyroTools GTFlow analysis software.
Regression analysis was used for other MRI-parameters from the standard clinical routine exam compared to mPAP. The vortex duration was also compared to the RHC mPAP, right ventricular volume (RVV), PA diameter and PA distensibility.
Results
CTEPH was confirmed in 11 / 18 patients. The mPAP was 28.7 ± 14.6 mmHg (10-66 mmHg). On the 4D flow data, a vortex was observed in most of the patients, to a greater or lesser extent. A long duration vortex is illustrated in figure 1.
Vortex duration measurement was reproducible, with intraobserver ICC = 0.94 and interobserver ICC = 0.88.
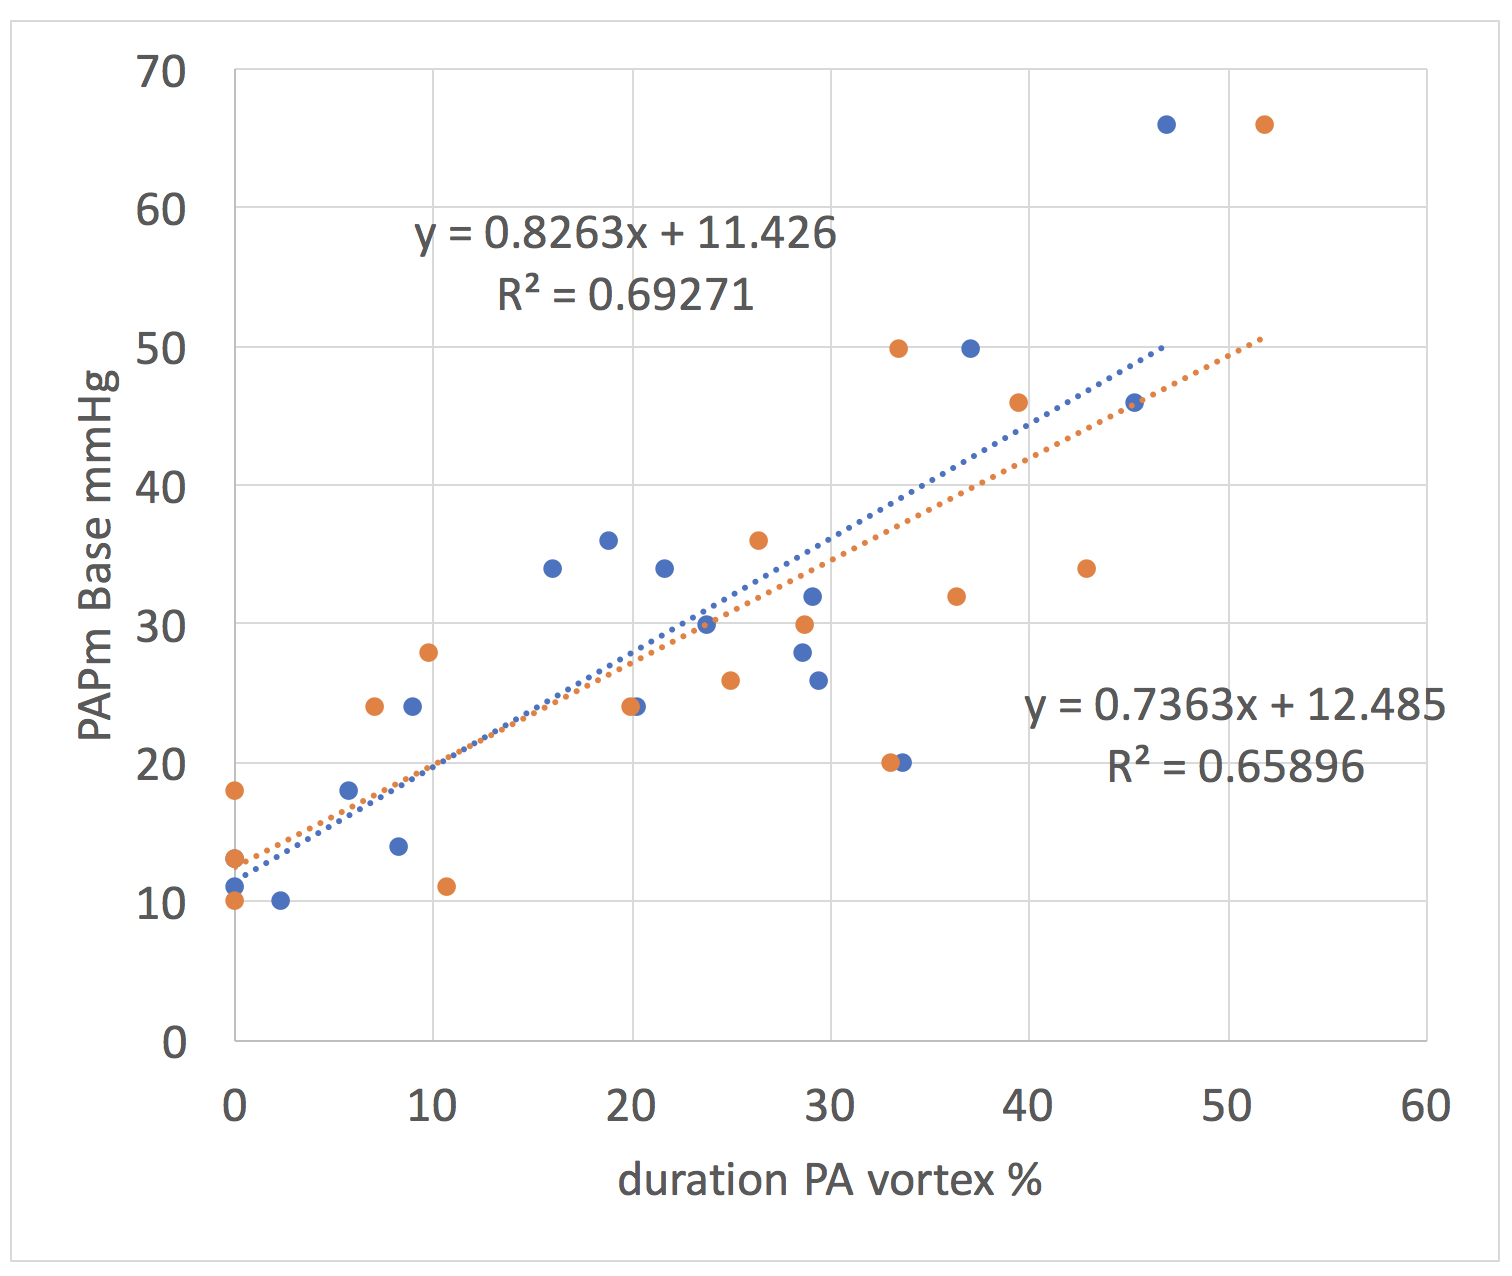
Vortex duration correlated excellently with mPAP with R2 = 0.69 p=0.000018 (figure 2) and outperformed all the other parameters (mPAP correlations with; RVV: R2 = 0.13, p=0.14; PA diameter: R2 = 0.409, p=0.008; PA distensibility: R2 = 0.17, p=0.09).
Vortex duration correlations with the other 2D derived MRI parameters were only moderate for PA diameter (RVV: R2 = 0.11, p=0.19; PA diameter: R2 = 0.47, p=0.003; PA distensibility: R2 = 0.14, p=0.13).
Using the second software package (GTFlow), no significant difference was found to the Siemens software (p=0.675) and the correlation between vortex duration and mPAP was maintained at R2 = 0.66, p=0.00015.
Discussion
The cause of vortex could be explained by two hypotheses: Computational Fluid Dynamics suggests that a change from narrow to wider vessel (PA dilatation) would cause a vortex. This could also explain the moderate correlations of mPAP and vortex duration with PA diameter. Alternatively, a pressure increase could cause an outflow obstruction.
The acquisition of the 3D volume and the complete velocity field in the 4D flow protocol is ideally adapted for analysis of complex vortical flow patterns.
We have shown the same results using two different analysis packages, an important criterion for introducing this parameter in clinical routine. Ideally, a more automated quantification would be desirable, and the results shown here justify further investigation.
Conclusion
Vortex duration derived from 4D flow MRI was the most promising MRI parameter to assess PA pressure and the effect observed by Reiter is confirmed.Acknowledgements
No acknowledgement found.References
[1] G. Reiter, U. Reiter, G. Kovacs, H. Olschewski, and M. Fuchsjager, "Blood flow vortices along the main pulmonary artery measured with MR imaging for diagnosis of pulmonary hypertension," Radiology, vol. 275, no. 1, pp. 71-9, Apr 2015.Figures