3448
Pseudo Spiral Compressed Sensing for Aortic 4D flow MRI: a Comparison with k-t Principal Component Analysis1Radiology, Academic Medical Center, Amsterdam, Netherlands, 2Biomedical Engineering & Physics, Academic Medical Center, Amsterdam, Netherlands
Synopsis
In this study, 8-fold pseudo spiral compressed sensing (CS) accelerated aortic 4D flow MRI was compared with 8-fold k-t principal component analysis (k-t PCA) acceleration. Scan times were approximately 7 minutes at 50% respiratory navigator efficiency. Image quality of the peak systolic phase contrast magnitude images was scored slightly higher for CS than for k-t PCA and time-resolved velocity pathline trajectories were similar. Quantitative hemodynamic differences in velocity and wall shear stress were found but these were small and can be attributed to a combination of acquisition strategy and physiological variation. CS can be used to accelerate 4D flow MRI.
Introduction
4D flow MRI is potentially extremely useful for the assessment of cardiovascular disease in the clinic. However, inherent to the time-resolved, three-dimensional nature of 4D flow MRI, scan times are clinically demanding. Recent efforts have focused on accelerating 4D flow MRI scans. In this study, we investigate the image quality and hemodynamic parameters of a pseudo spiral Cartesian undersampling scheme with a Compressed Sensing reconstruction (CS) approach for aortic 4D flow MRI. The results are compared with highly accelerated k-t principal component analysis 4D flow MRI (k-t PCA) [1]. We hypothesized that CS captured the anatomy of the aorta and the hemodynamic behavior as well as k-t PCA.Methods
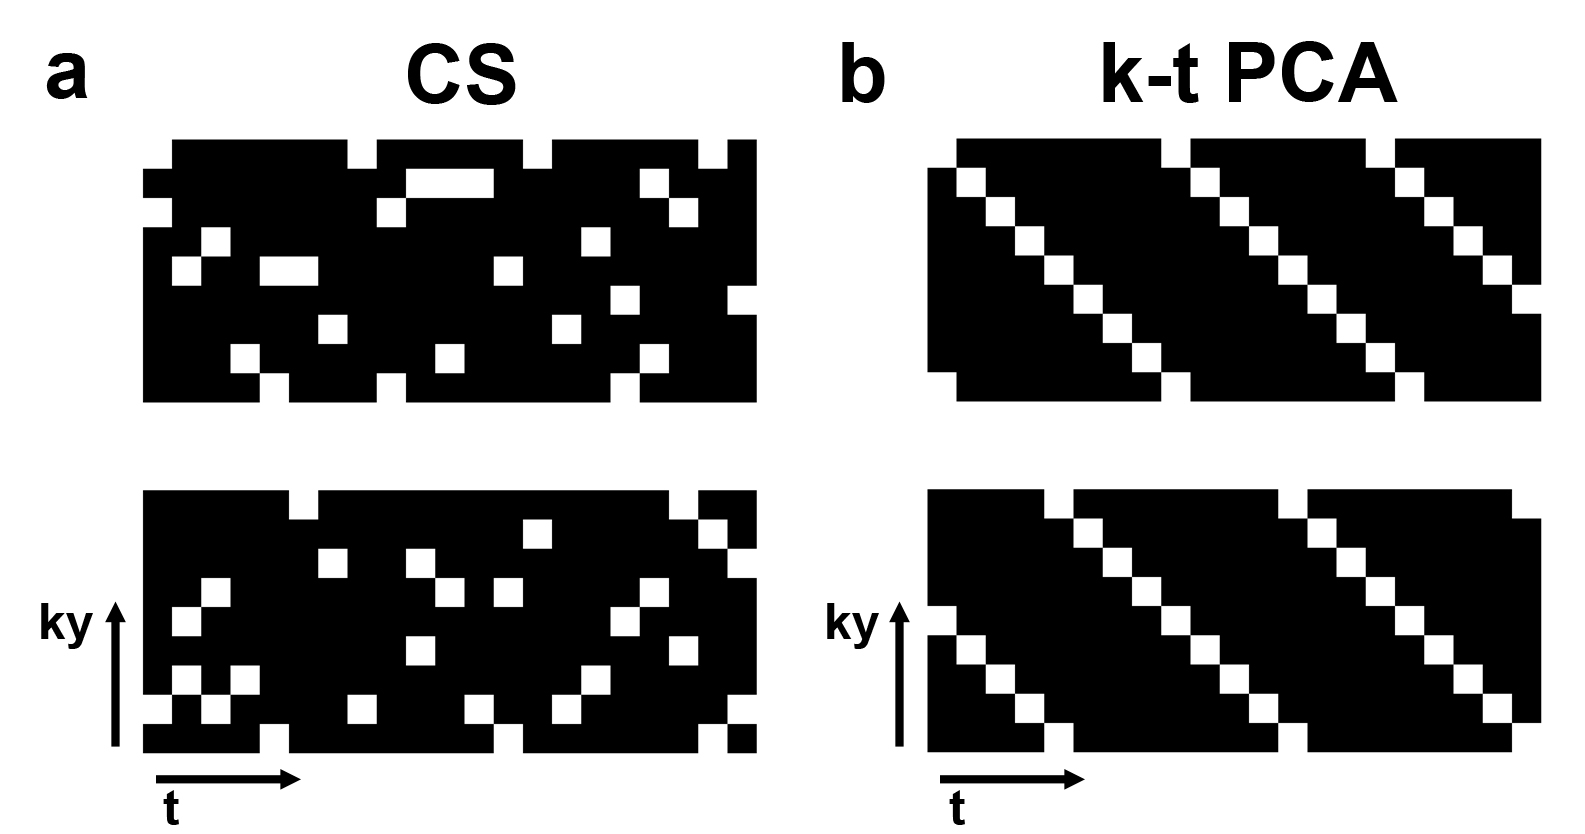
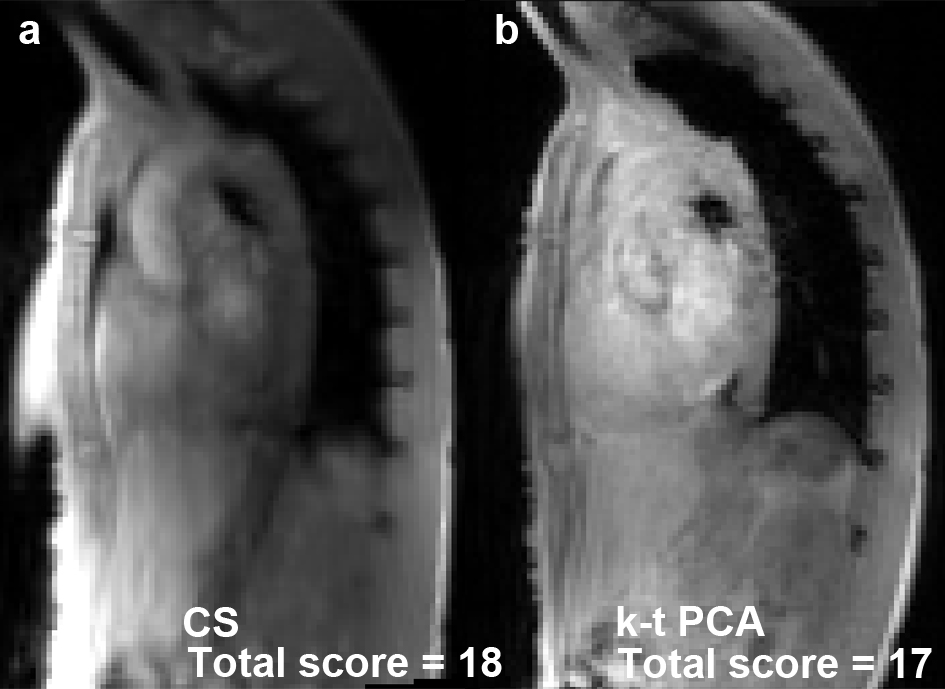
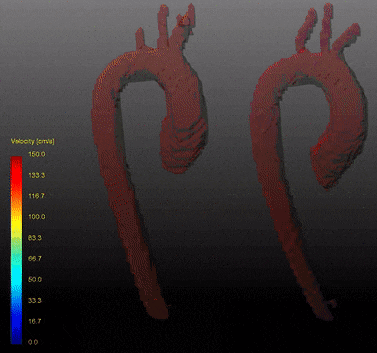
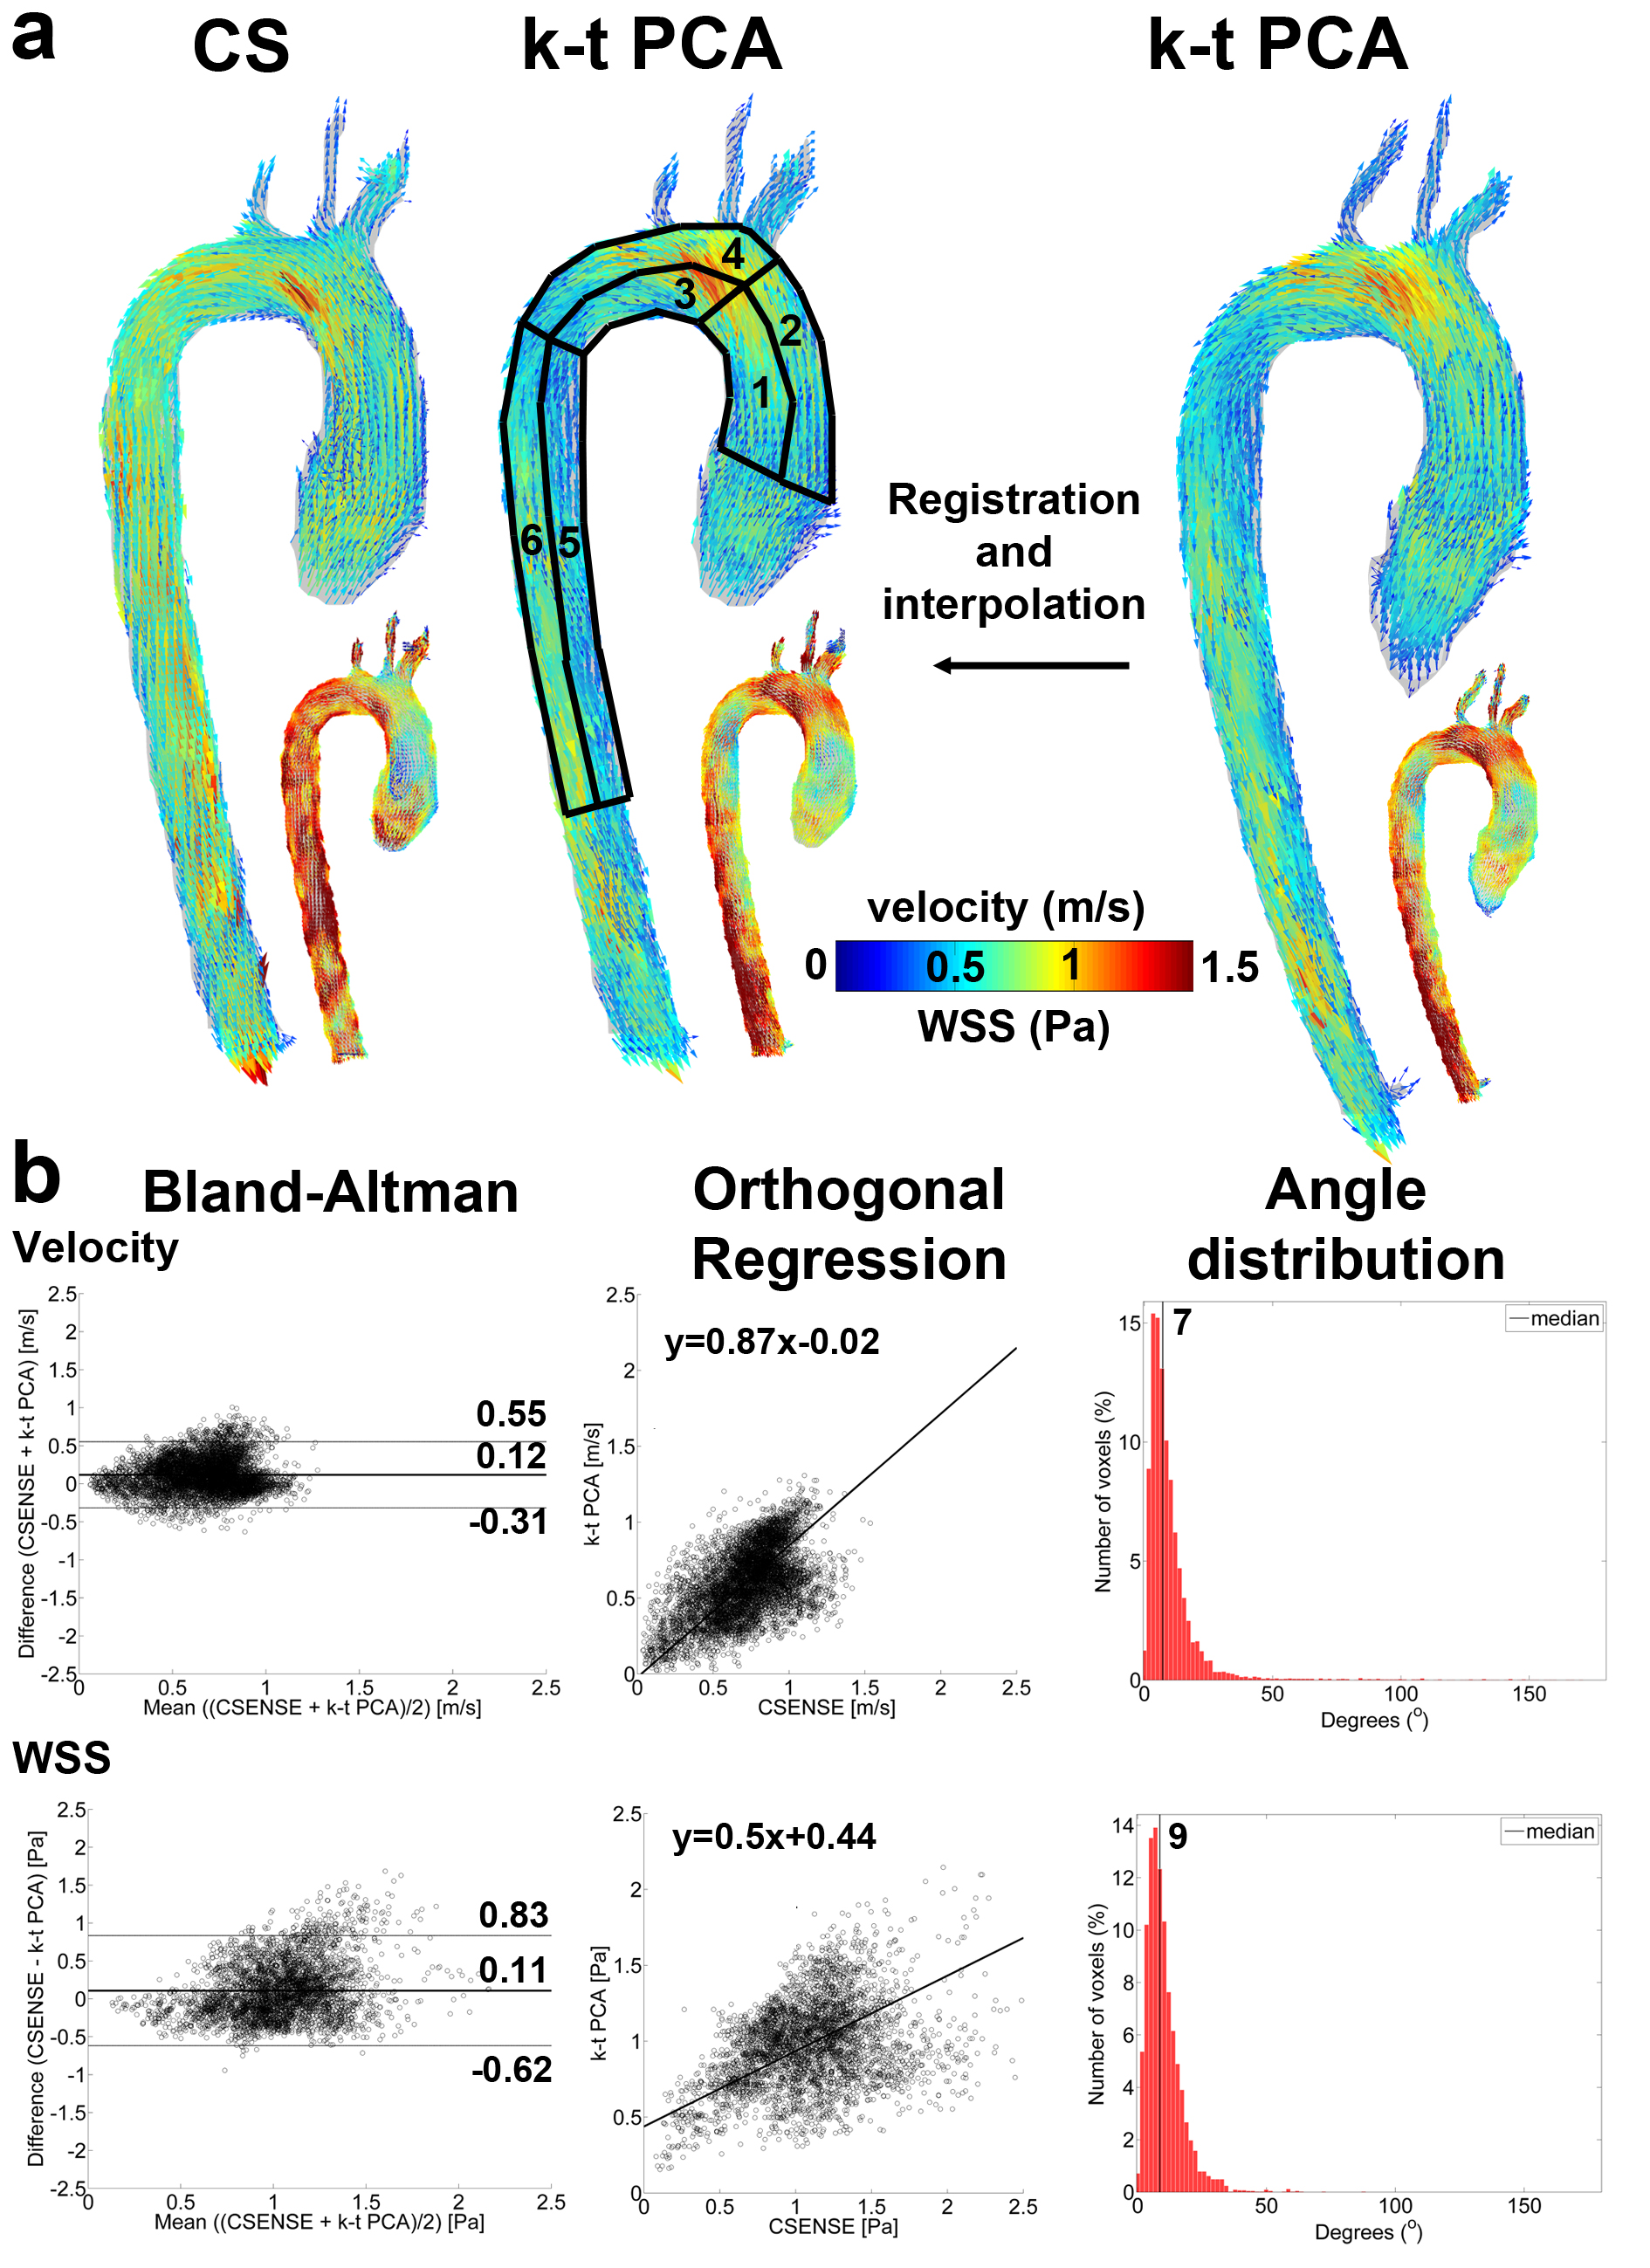
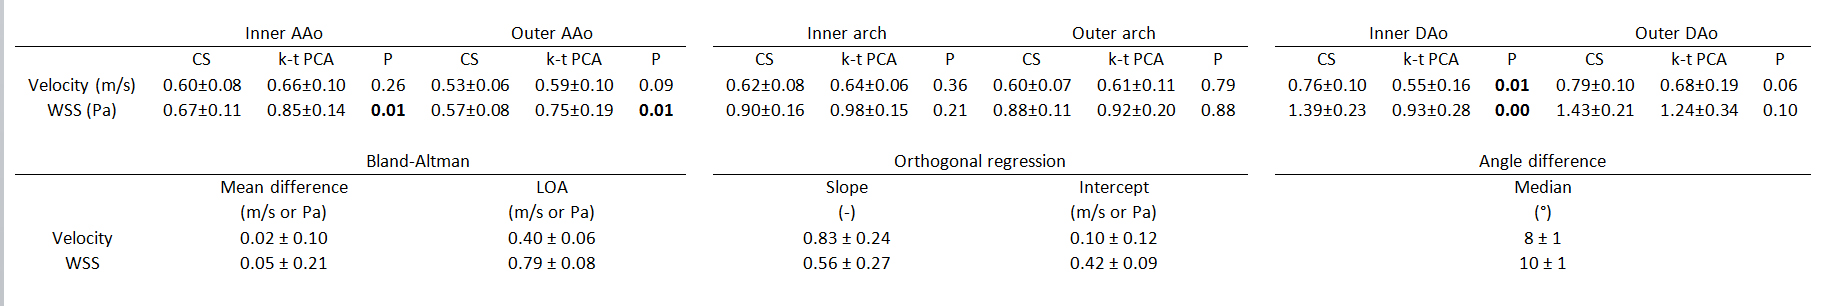
Eight times accelerated CS and k-t PCA 4D flow MRI was performed in 10 healthy volunteers (27±3 years, 4 women) without contrast agent [2]. Pulse sequence parameters: spatial resolution=2.5x2.5x2.5mm3, temporal resolution=34-53ms, echo time=2.1ms, repetition time=3.6-5.0ms, flip angle=8°. CS and k-t PCA were retrospectively and prospectively ECG-gated, respectively. For CS, the sampling profiles were generated as points of multiple spiral trajectories with variable density. ky/kz-profiles were consecutively altered during each heartbeat. Following the physiological variability in heart rate, retrospective binning according to trigger time created a unique sampling patterns for each cardiac frame (Figure 1). Reconstruction was performed using the Berkeley Advanced Reconstruction Toolbox [3] with a sparsifying time variation transform and a wavelet transform in space with regularization parameters of rTV= 0.01, rW= 0.01, and 50 iteration steps. The 3D aortic volume was semi-automatically segmented in Mimics (Materialise, Leuven, Belgium) from PC-MRA images [4]. Peak systole was determined as the timeframe with the highest velocity averaged over the segmentation. The segmentation defined the location of the aortic wall for shear stress (WSS) calculation [5]. Four analyses were performed for the assessment of differences between k-t PCA and CSENSE: 1) peak systolic phase contrast magnitude images for k-t PCA and CSENSE were scored blinded by an experienced radiologist in terms of edge sharpness, signal and noise in the ascending aorta (AAo), the arch and the descending aorta (DAo) (3=very good, 2=good, 1=bad, 0=very bad). A total score was calculated by addition of all regions, all categories and all subjects. 2) Pathline movies were created in GTFlow (Gyrotools, Zurich, Switzerland) and observed for qualitative differences in flow trajectories [6]. 3) Spatially averaged velocity and WSS was calculated in six aortic regions: the inner and outer AAo, arch and DAo. A Wilcoxon rank sum test with P<0.05 was applied to find significant differences. 4) After projection of the k-t PCA data to CSENSE, Bland-Altman, orthogonal regression and vector angle difference analyses were performed for velocity and WSS.Results
The scan time for both CS and k-t PCA was approximately 7 minutes at 50% respiratory navigator efficiency. In Figure 2, an example is shown for CS and k-t PCA peak systolic magnitude images. The total score was 192 and 157 for CS and k-t PCA, respectively. In Figure 3, a pathline movie is displayed for CS compared to k-t PCA. No difference in particle trajectories were found. In Figure 4, the quantitative analysis of velocity and WSS is demonstrated for the exemplary subject shown in Figure 3. Bland-Altman analysis revealed a mean difference of 0.12 m/s indicating that the CS velocities were higher than the k-t PCA velocities. In Table 1 the results of the quantitative analyses are given for all subjects. Except for the inner DAo, no significant differences were found for velocity. Differences were more pronounced for WSS, with the inner and outer AAo and the inner DAo showing significant differences. Furthermore, the limits of agreement of WSS were larger, the slope was lower, the intercept and median angle higher than for velocity, which shows that differences are exacerbated for WSS compared to velocity.Discussion
Although the pathline movies showed higher velocities for k-t PCA, the quantitative analyses did not confirm this finding. A possible explanation is that CS images contain less noise, thereby facilitating the visualization of pathline trajectories with low velocity near the wall that obscure the high velocities in the center of the lumen. Alongside the effect of different acceleration techniques on hemodynamic quantification, physiological variation could have caused differences as well. Future work will therefore focus on aortic phantom experiments. Furthermore, it was shown that for k-t PCA image quality reduces for acceleration factors higher than 8. We expect to be able to go beyond R=8 with CS-accelerated 4D flow MRI.Conclusion
CS accelerated aortic 4D flow MRI is feasible and produces at least similar results as k-t PCA accelerated 4D flow MRI.Acknowledgements
No acknowledgement found.References
[1] Pedersen H, Kozerke S, Ringgaard S, Nehrke K, Kim WY. k-t PCA: Temporally constrained k-t BLAST reconstruction using principal component analysis. Magn Reson Med 2009;62:706–716
[2] Giese D, Wong J, Greil GF, Buehrer M, Schaeffter T, Kozerke S. Towards highly accelerated Cartesian time-resolved 3D flow cardiovascular magnetic resonance in the clinical setting. J Cardiovasc Magn Reson 2014;16:42
[3] Martin Uecker, Frank Ong, Jonathan I Tamir, Dara Bahri, Patrick Virtue, Joseph Y Cheng, Tao Zhang, and Michael Lustig, Berkeley Advanced Reconstruction Toolbox, Annual Meeting ISMRM, Toronto 2015, In Proc. Intl. Soc. Mag. Reson. Med. 23:2486
[4] Bock J, Kreher W, Hennig J, Markl M. Optimized pre-processing of time-resolved 2D and 3D Phase Contrast MRI data. Proc. Intl. Soc. Mag. Reson. Med. 2007;15:3138.
[5] Potters W V, van Ooij P, Marquering HA, VanBavel E, Nederveen AJ. Volumetric arterial wall shear stress calculation based on cine phase contrast MRI. J Magn Reson Imaging 2015;Feb; 41:505–516
[6] Sigfridsson A, Petersson S, Carlhäll C-J, Ebbers T. Four-dimensional flow MRI using spiral acquisition. Magn Reson Med 2012;68:1065–1073
Figures