3446
4D Flow MRI velocity encoding effects on in vitro aortic dissection false lumen velocity distribution1Department of Radiology, University of Wisconsin - Madison, Madison, WI, United States, 2Department of Medical Physics, University of Wisconsin - Madison, Madison, WI, United States, 3School of Medicine, University of Wisconsin - Madison, Madison, WI, United States, 4Department of Mechanical Engineering, University of Wisconsin - Madison, Madison, WI, United States
Synopsis
Selecting the appropriate velocity sensitivity is critical in assessing flow within the false lumen of aortic dissections, where low velocities are dominant. This study compares effects of two VENC settings on velocity distribution within the false lumen of 3D printed aortic dissection models. We observed significant changes in velocity distributions depending on the VENC selected for the 4D Flow MRI acquisition. This difference tends to be accentuated at lower flow rates and would have important implications on calculations of other hemodynamic parameters, including wall shear stress, kinetic energy and vorticity, which may be predictors of outcomes in aortic dissection patients.
Purpose
To investigate the effects of VENC setting for in vitro 4D Flow MRI of 3D printed aortic dissections at two inflow conditions.Introduction
In aortic dissection (AD) a tear in the wall of the aorta results in a false lumen which can lead to complications such as aneurysm growth, rupture, end-organ malperfusion and hypertension.1 CFD, in combination with medical imaging, has been increasingly used for patient-specific cardiovascular modeling of AD. However, the wide range of velocities that are present in this pathology make optimal 4D Flow MRI scanning complex, specifically in terms of the velocity encoding (VENC) settings. Previous studies2,3 have acquired data with VENC set at 150 – 200 cm/s, common for aorta imaging, but not necessarily for false lumen assessment, where low velocities are often predominant. In this study, velocity distributions within the false lumen of three 3D printed aortic dissection models were explored at two VENC settings: 70 cm/s and 150 cm/s, and at two inflow rates.Methods
Following an IRB-approved and HIPAA-compliant protocol, magnetic resonance angiography (MRA) and computed tomography angiography (CTA) data from three patients (55 year-old female and 54 year-old male, MRA, and 40 year-old male, CTA) with acute descending thoracic AD were used to generate models for 3D printing.
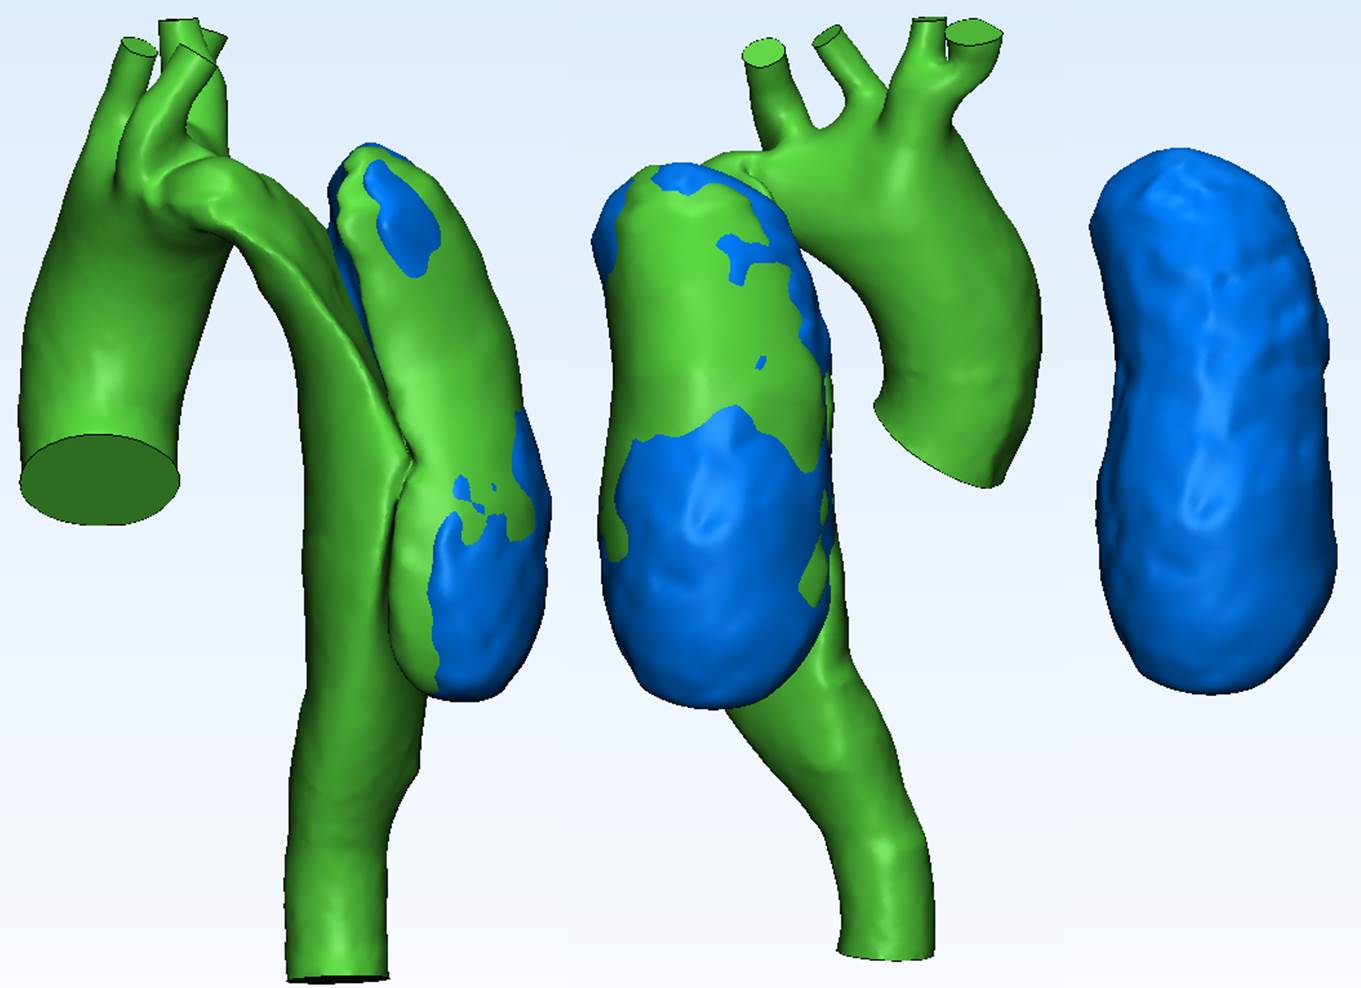
Patient Specific Models: In vitro anatomical models were segmented from CTA images using Mimics (Materialise; Leuven, Belgium). Surfaces were fixed and smoothed as needed (3-matic, Materialise) (Figure 1); the geometries were made hollow and tubing connections were added at inlets and outlets. Inlet (ascending aorta) and outlet planes (descending aorta and main arteries) were defined. The three geometries were exported in STereoLithography (STL) file format to be used for 3D printing to scale using selective laser sintering.
In vitro MRI: Each physical model (Figure 1) was connected to a pulsatile pump (BDC PD-1100, BDC Laboratories, Wheat Ridge, CO) that circulated water at 2 and 4 L/min as the maximum input flow, following a physiological flow waveform (35% systole, 60 bpm). In vitro 4D Flow MRI4 was performed on a 1.5T scanner (MR750, GE Healthcare, Waukesha, WI) with the following parameters: 320 x 320 x 320 mm FOV (1.25 mm isotropic spatial resolution), TR/TE = 6.72/2.82 ms, FA = 8, and scan time 10 minutes. For each inflow, two settings for velocity encoding (VENC) were used: 70 and 150 cm/s.
Velocity distribution: Magnitude images of each 3D printed model were used for segmenting the false lumen (Mimics). Mask coordinates were then imported into a custom-developed Matlab tool and histograms of the velocity magnitude distribution in the false lumen were computed for each time step within the cardiac cycle (14 time steps). An average histogram of all time steps was calculated for each VENC.
Results
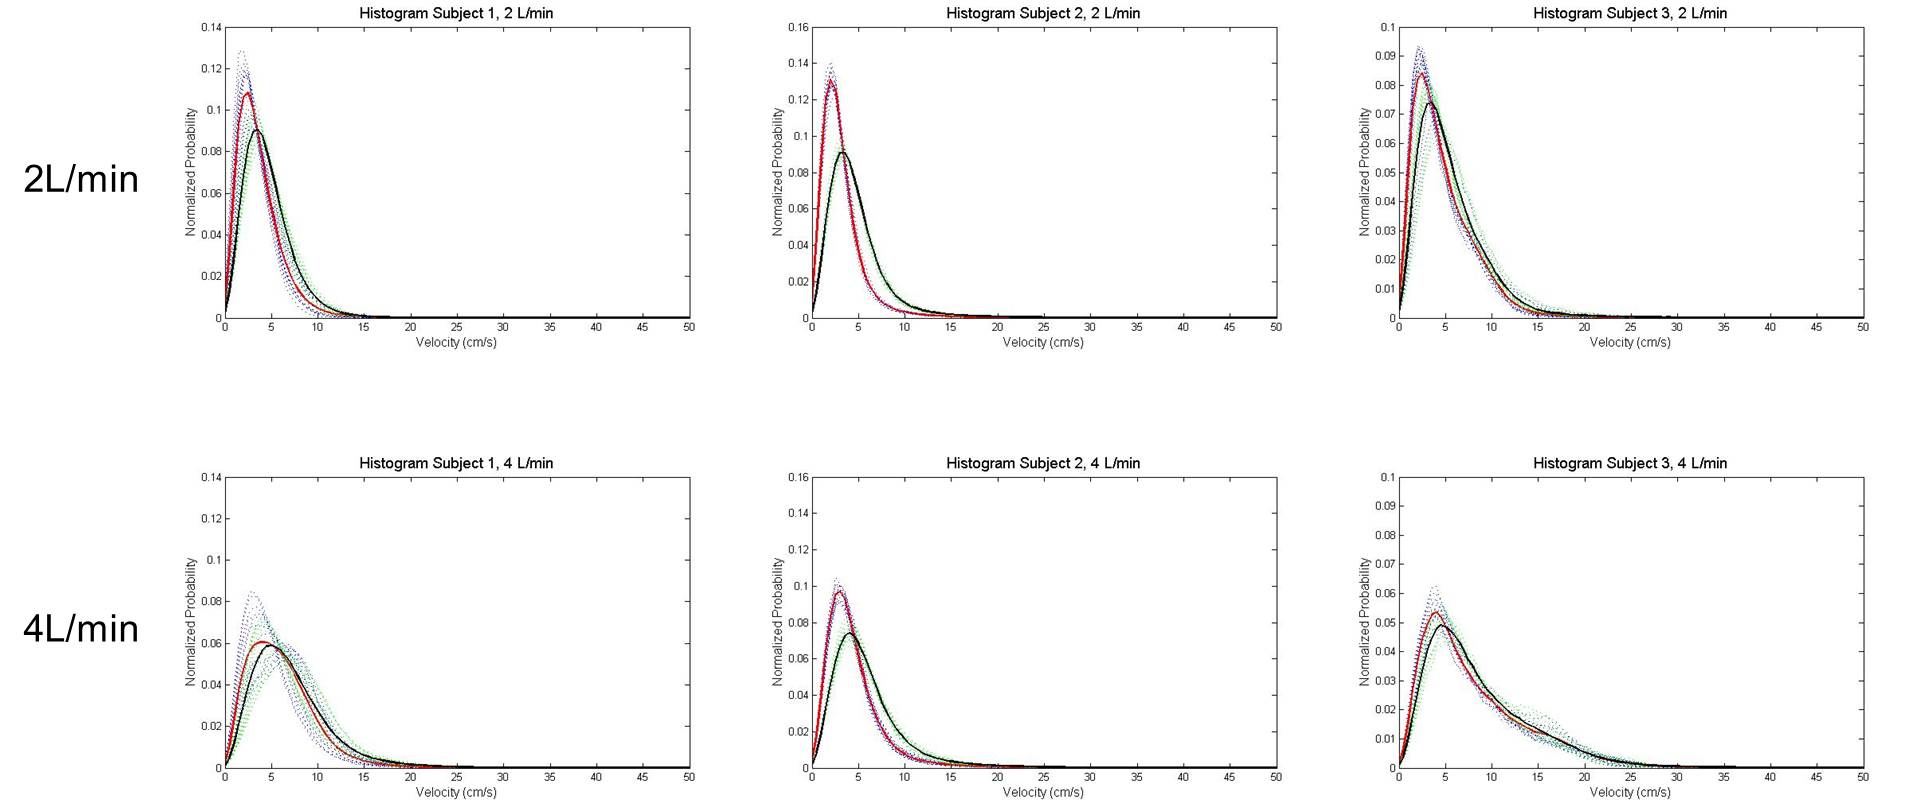
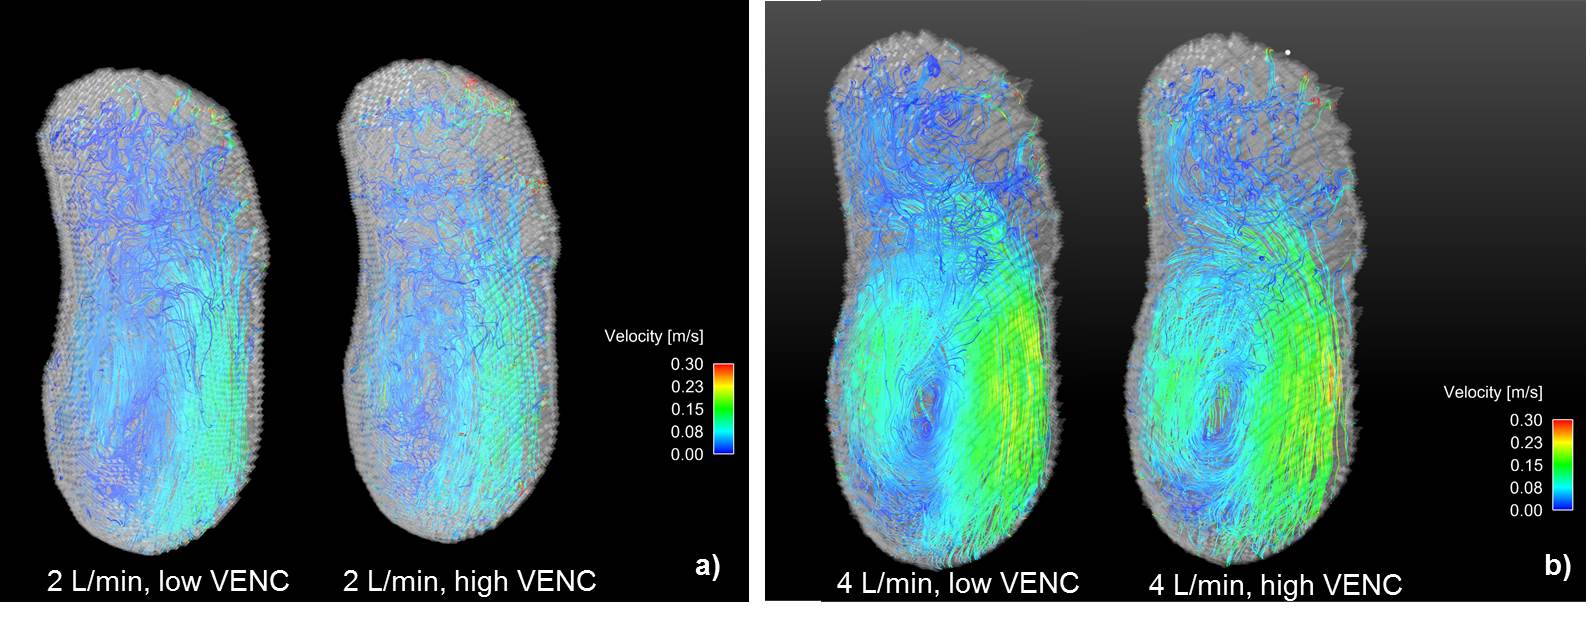
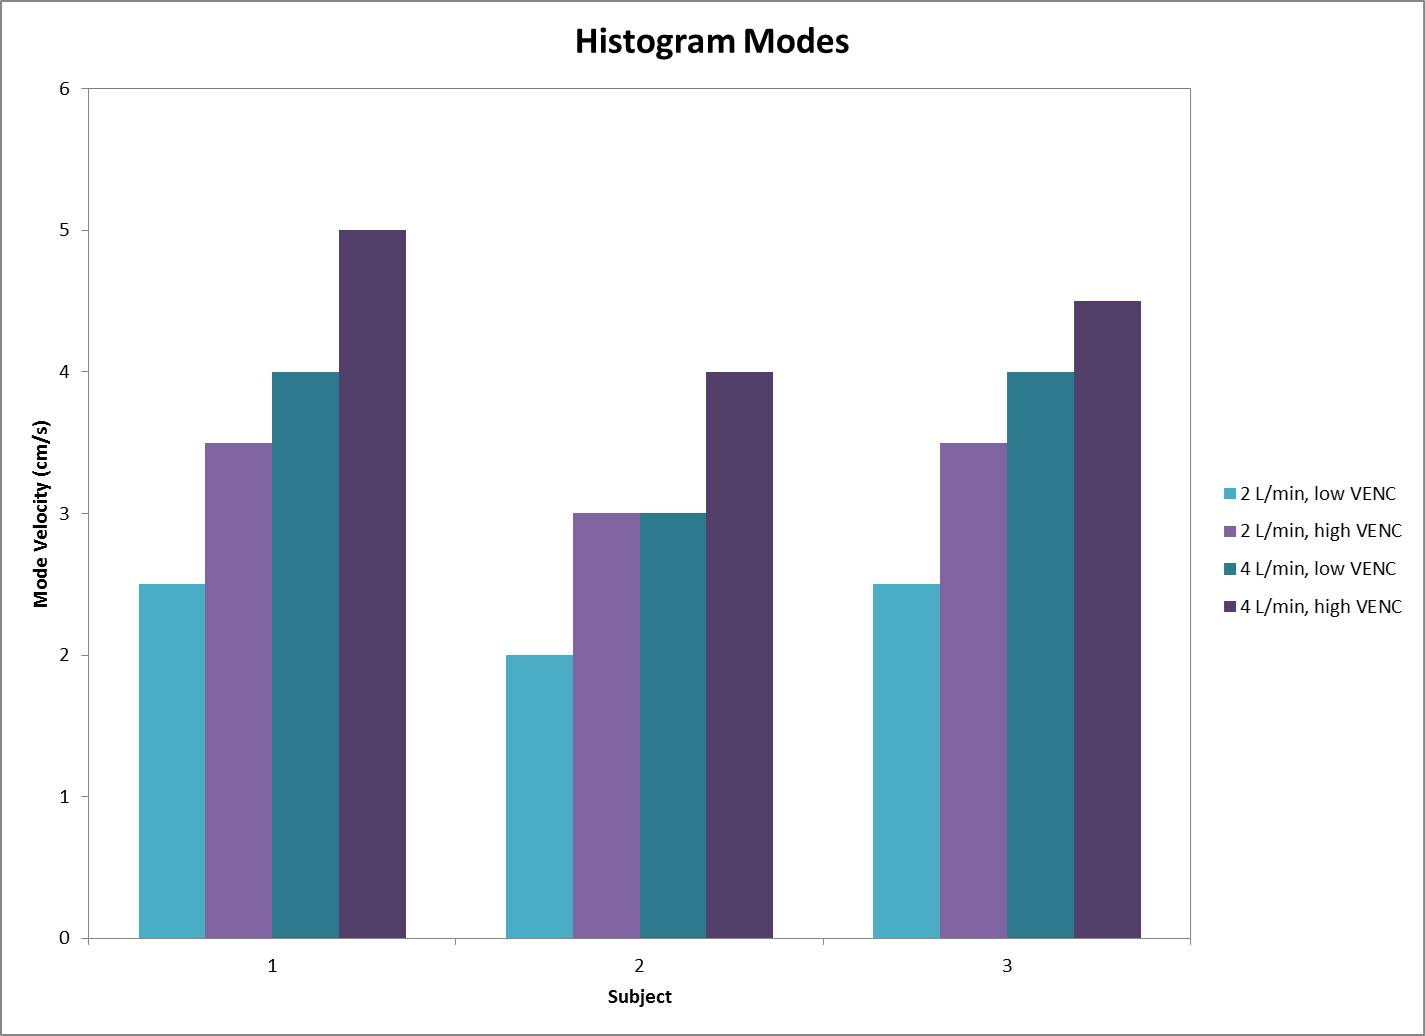
Velocity streamlines throughout the false lumen of one representative case are shown in Figure 2, where low VENC images demonstrate the presence of low velocities and small eddies. Figure 3 shows histograms for each inflow and each 3D printed model. In all cases, low VENC scans notoriously incorporate lower velocities when compared to high VENC scans. This difference was more enhanced in 2 L/min inflow cases, where the maximum normalized probability was in average 25.8% higher for low vs high VENC, compared to 14.1% for the 4 L/min inflow cases. This corresponds to a mode 30.2% lower for low VENCs vs high VENCS for 2 L/min, and 18.7% lower for 4 L/min scans (Figure 4).Discussion
Selecting the appropriate velocity sensitivity is critical in assessing flow within the false lumen of aortic dissections. In this in vitro study we observed significant changes in velocity distributions depending on the VENC selected for the 4D Flow MRI acquisition. This difference tends to be accentuated at lower flow rates and would have important implications on calculations of other hemodynamic parameters, including wall shear stress, kinetic energy and vorticity, which may be predictors of outcomes in aortic dissection patients.Acknowledgements
We acknowledge David Rutkowski (UW Mechanical Engineering) and support from the UW Radiology R&D 2015. We also thank GE Healthcare for their support.References
1. Khan IA, Nair, CK. Clinical, diagnostic, and management perspectives of aortic dissection. Chest 2002;122:311-328.
2. François CJ, Markl, M, Schiebler, ML, et al. Four-dimensional, flow-sensitive magnetic resonance imaging of blood flow patterns in thoracic aortic dissections. J Thorac Cardiov Sur 2013;145:1359-66.
3. Clough RE, Waltham M, Giese D, et al. A new imaging method for assessment of aortic dissection using four-dimensional phase contrast magnetic resonance imaging. J Vasc Surg 2012; 55:914-923.
4. Gu T, Korosec, FR, Block, WF, et al. PC VIPR: a high-speed 3D phase-contrast method for flow quantification and high-resolution angiography. AJNR Am J Neuroradiol 2005;26:743-749.
Figures