3437
Whole-heart 4D phase-contrast MRI for clinical cardiovascular flow analysis: a comparison and validation on an imaging pulse sequence aspectShuo Zhang1,2, Jun-Mei Zhang1,3, Jennifer Ann Bryant1, Bao Ru Leong1, Pankaj Garg4, Rob van der Geest5, Ru San Tan1,3, and Liang Zhong1,3
1National Heart Centre Singapore, Singapore, Singapore, 2Philips Healthcare Singapore, Singapore, Singapore, 3Duke-NUS Medical School Singapore, Singapore, Singapore, 4Division of Biomedical Imaging, University of Leeds, Leeds, United Kingdom, 5Department of Radiology, Leiden University Medical Center, Leiden, Netherlands
Synopsis
Whole-heart 4D phase-contrast magnetic resonance imaging (4D PC-MRI) provides qualitative and quantitative cardiovascular flow information. Recent technological advances in acquisition have rendered its clinical adoption without breath hold or respiratory gating. However, with different acquisition methods available their accuracy and influence in flow measurement are not well studied. We report our result in comparison of different commercially available imaging pulse sequences with validation to conventional 2D PC-MRI in healthy volunteers and patients with congenital heart disease.
Introduction
Whole-heart 4D phase-contrast magnetic resonance imaging (4D PC-MRI) allows qualitative and quantitative assessment of cardiovascular flow. Recent technological advances have improved the acquisition speed, rendering its wider clinical adoption even without breath hold or respiratory gating 1. We aimed to compare different acquisition methods with commercially available imaging pulse sequences and with validation to conventional 2D PC-MRI in both healthy volunteers and patients with congenital heart disease.Methods
All human subjects underwent MRI on a 3T system (Philips Ingenia). Whole-heart 4D flow was measured using three different RF-spoiled gradient-echo based pulse sequences, which included one EPI and two turbo-field-echo (TFE) sequences, all with velocity encoding applied in three directions. While the spatial and temporal resolutions were kept similar among these sequences, the combination of different undersampling strategies in either the phase-encoding dimension (partial Fourier), echo dimension (partial echo) and cardiac phase dimension (phase percentage) differed from each other. Detailed imaging parameters were summarized in Table 1. The 3D volume covered the thorax from apex of the heart to the aortic arch. All 4D flow measurements were performed with free breathing and without respiratory navigator gating. In addition, conventional 2D one-directional PC-MRI was performed with (BH) and without (FB) breath hold, which served as the reference and were compared to the 4D flow results. The cardiovascular flow was measured at the following location: 1) the ascending aorta distal to coronary artery orifices (Ao); 2) the mid portion of the pulmonary trunk (PA); 3) the main stem of the right (RPA) and 4) left pulmonary artery (LPA) at least 4 mm distal to the bifurcation; 4) mitral (MV) and tricuspid (TV) valves at the moment of end systole, with the acquisition plane perpendicular to the diastolic inflow direction. In addition, regurgitation fractions (RF) in aorta or pulmonary trunk of patients with malformed and/or insufficient valves were also measured and compared. Data analysis was performed with the MASS software (Leiden University Medical Center, Leiden, The Netherlands) and intra-cardiac kinetic energy and flow components analysis were also included 2. Statistics was done in SPSS and a P value <0.05 was considered significant.Results and Discussion
4 healthy volunteers (38 ± 7 years, 3 female) and 2 patients (29 ± 3 years, 1 female) with repaired Tetralogy of Fallot (TOF) were included. Flow measurements were successful in all subjects. First of all, 2D flow with and without breath hold showed no significant difference. Comparison of 2D and 4D flow was further performed for all free-breathing measurements. In general, EPI showed best results in terms of agreement to 2D flow for both peak velocity and flow rate, as well as flow validity in intra-cardiac flow component analysis (Table 2). 4D TFE-1 had the largest deviation to 2D and 4D EPI, despite a shorter TE with partial echo acquisition expected for a higher flow accuracy. This may be explained by either the incomplete sampling of the echo signal or additional eddy current generated, the exact cause, however, needs to be further investigated. In comparison, 4D TFE-2 showed closer agreement to 2D and 4D EPI with undersampling in the phase-encoding direction (partial Fourier) but not in the echo dimension (i.e., without partial echo). Figure 1 demonstrated a few typical results of the flow curves obtained in a healthy subject. Qualitative observation was in consistency with the above quantitative findings that 4D EPI generated smoothest images, particularly for phase difference maps, while 4D TFE-1 presented most artifacts in both magnitude images and phase difference maps (arrows), with presence of distortion in flow vector visualization (arrow head) in comparison to the other two methods (Figure 2).Conclusion
While commercially available pulse sequences can well depict 4D cardiovascular flow dynamics and distributions in free breathing and without respiratory navigation, accuracy and validity do vary depending on the imaging parameters, in particular, the undersampling approaches. The previously reported 4D EPI sequence allows for a reasonable qualitative representation and quantitative accuracy in complex evaluation of cardiovascular hemodynamics. Nevertheless, as the generated results directly reflect pathophysiological flow conditions, the imaging parameters should be chosen with care and detailed technical validation on flow measurement is necessary prior to any clinical studies.Acknowledgements
The study was supported by National Medical Research Council Singapore (NMRC/OFIRG/0018/2016).References
1. Kanski M et al. BMC Medical Imaging (2015) 15:20.
2. van der Geest RJ and Garg P. Curr Radiol Rep (2016) 4:38.
Figures
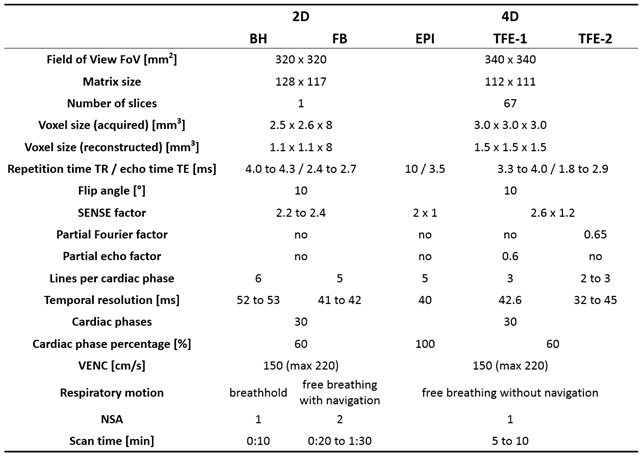
Table
1. Imaging parameters of 4D and 2D
PC-MRI. 2D
= 2D one-directional velocity-encoding; 4D = 4D three-directional velocity encoding;
BH = breath hold; FB = free breathing; EPI = echo planner imaging; NSA = number
of signal averaging
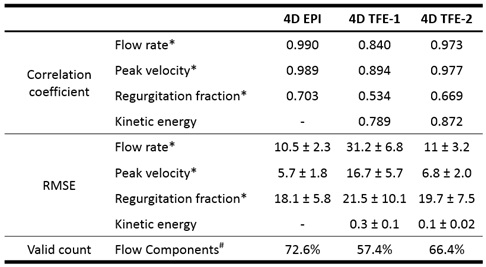
Table 2. Quantitative comparison of three 4D PC-MRI pulse
sequences in cardiovascular flow measurements. Details see text. *
Flow rate, peak velocity and regurgitation fraction were compared to 2D PC-MRI.
# Flow component analysis and valid count according to [2]. RMSE =
root-mean-square error.
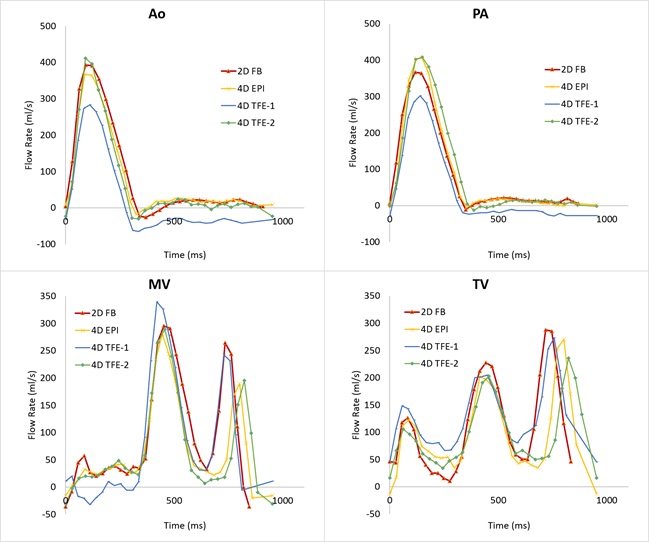
Figure
1. Quantitative cardiovascular flow measurements
of 4D PC-MRI in a healthy subject. Ao =
aorta; PA = pulmonary artery; MV = mitral valve; TV = tricuspid valve
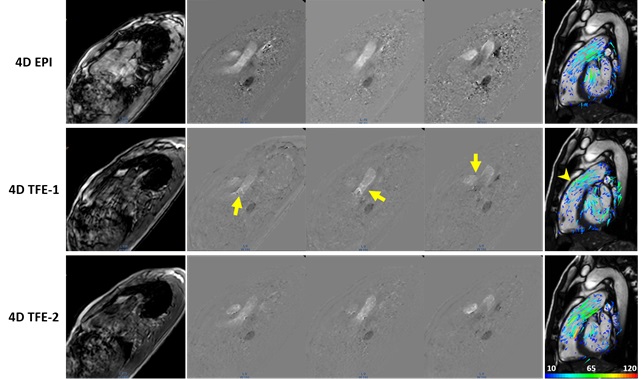
Figure 2. Qualitative comparison of three 4D PC-MRI pulse sequences in
cardiovascular flow measurement with magnitude images (left), phase difference
maps in three directions (middle) and 2D flow vectors overlaid on a RVOT (right
ventricular outflow track) view. Images were obtained in a healthy subject.
Details see text.