3434
Quantitative evaluation of compressed sensing reconstruction in mouse phase contrast 4D-flow Magnetic Resonance Imaging1Radiology, Medical Physics, University Medical Center Freiburg, Freiburg, Germany, 2Center for Advanced Imaging Innovation and Research (CAI2R), Department of Radiology, New York University School of Medicine, New York, NY, United States
Synopsis
Preclinical 4D-flow measurements remain challenging due to long acquisition times. This study presents a retrospective analysis of 4D-flow measurements with a radial 3D phase contrast sequence in combination with an advanced compressed sensing reconstruction. We evaluate the impact of different undersampling factors regarding peak velocities, flow, wall shear stress values and streamline analysis. We could show that high acceleration factors for preclinical phase contrast imaging can be used without substantially degrading the quantitative results. Our findings might enable high resolution 4D-flow acquisitions in less than one hour.
Introduction
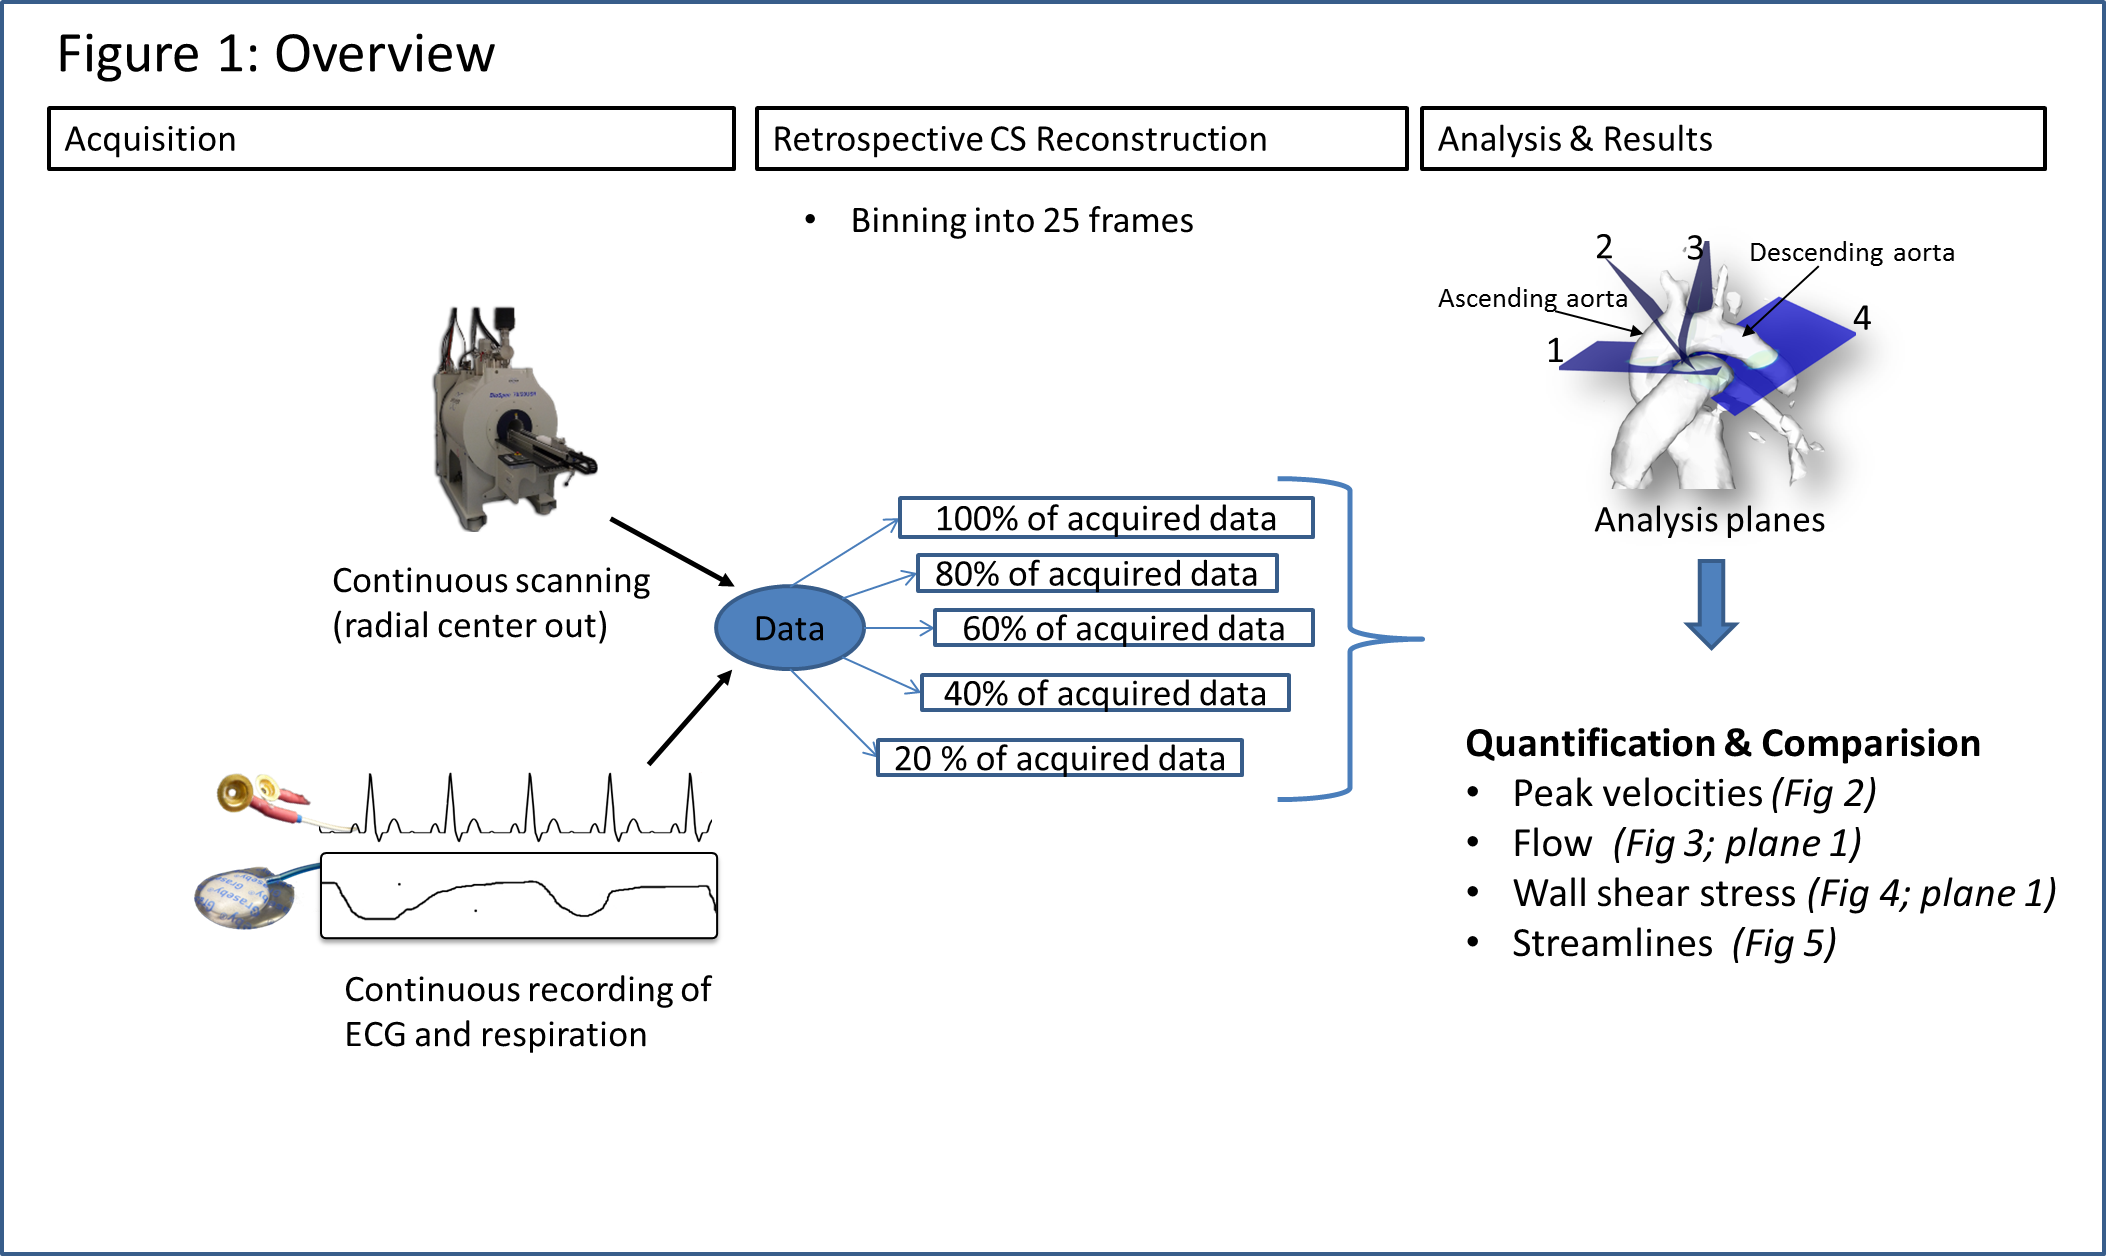
Cardiovascular diseases remain a major cause of mortality. The investigation of mouse models of cardiovascular diseases may provide detailed insights in their progression, which cannot be achieved with human magnetic resonance imaging (MRI). It has been shown, that 4D-flow MRI can visualize and analyze the complex blood flow patterns in the murine aorta1. Recently a short TE retrospective radial phase contrast (PC) sequence was presented2. The acquisition time of this study was 2 hours, which might be accomplishable in healthy mice. However diseased mice are likely to be less stable under anesthetics and, therefore, require shorter acquisition times. In this study, we aim to reveal possible acceleration factors for compressed sensing in radial 4D-flow PC MRI.Methods
The data for our retrospective analysis was acquired in four mice (C57BL/6J strain; heartrate ~500 b/m) measured under the approval of the ethics committee (Regierungspraesidium Freiburg AZ:35-9185.81/G-14/91) under 0.8 to 1.5% isoflurane in O2, Temperature: 36-37°C. An intravascular gadolinium based contrast agent (100µl+100µl NACL) Gadospin P (nanoPET Pharma GmbH) was applied via tail injection prior to the start of the data acquisition. A preclinical MRI system Bruker BioSpec 70/20 USR equipped with a two channel transmit/receive cryogenic (Bruker) surface coil was used. Respiration (pressure sensor) and ECG were acquired synchronously to the MRI acquisition. A radial 3D center-out 3-directional velocity encoded PC sequence was implemented. Parameters: FOV = 22x22x22 mm³, TE/TR = 0.6 ms/3.6 ms; matrix =120x120x120, VENC = 170 cm/s; FA = 8°, Acquisition time in vivo ~54 min. Data were continuously acquired and sorted retrospectively according to the ECG (binned into 25 phases) and respiration signals (respiration events are discarded) during reconstruction. A NUFFT- operator based reconstruction in combination with a compressed sensing was used3. Consistency of the reference reconstruction (225110 spokes, undersampling factor (USF) 7.5x compared to full Nyquist sampling) was validated against an previously established fully sampled Cartesian method1. The influence of increasing undersampling on commonly derived velocity parameters was investigated for different numbers of spokes during reconstruction by retrospectively removing spokes from the reference acquisition. The number of spokes used for reconstruction was 80% (9x), 60% (12.5x), 40% (19x), 20% (37.5x) of the reference datasets (USF in comparison to Nyquist sampled data given in brackets). Prior to further flow analysis, phase offset correction was applied using a threshold based detection of static tissue in the images, individually each dataset. Analysis was performed as described in Braig et al.1 . Streamlines were visualized using Ensight (ANSYS Inc. Canonsburg).Results
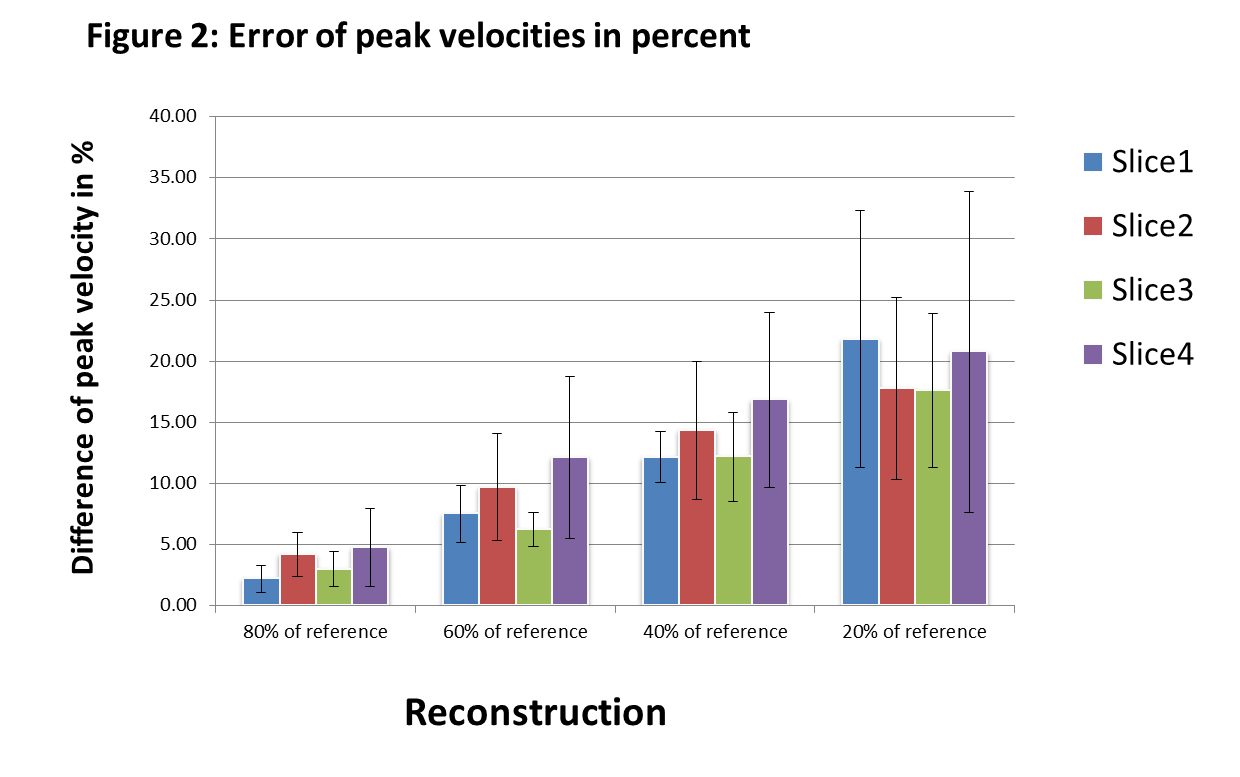
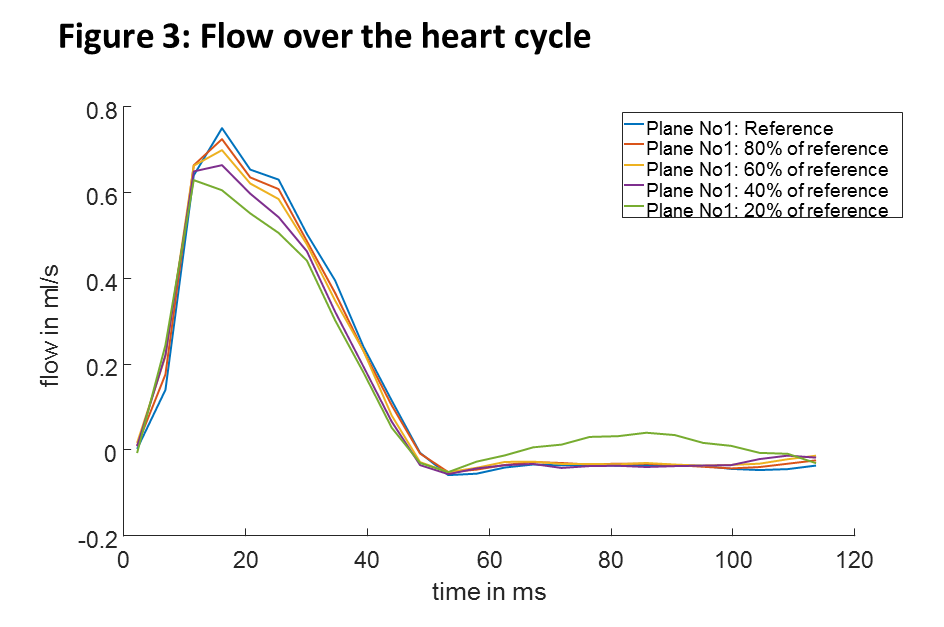
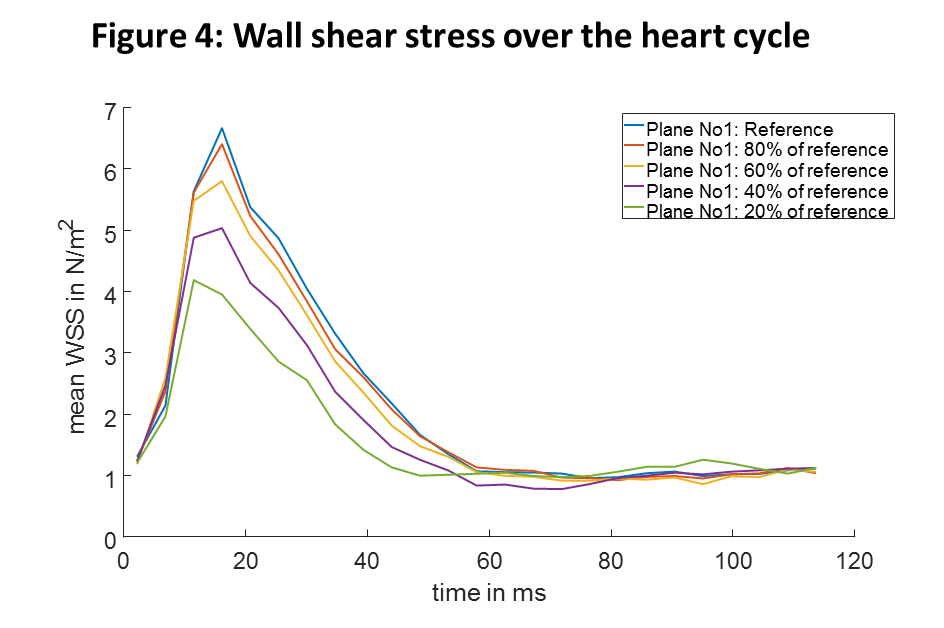
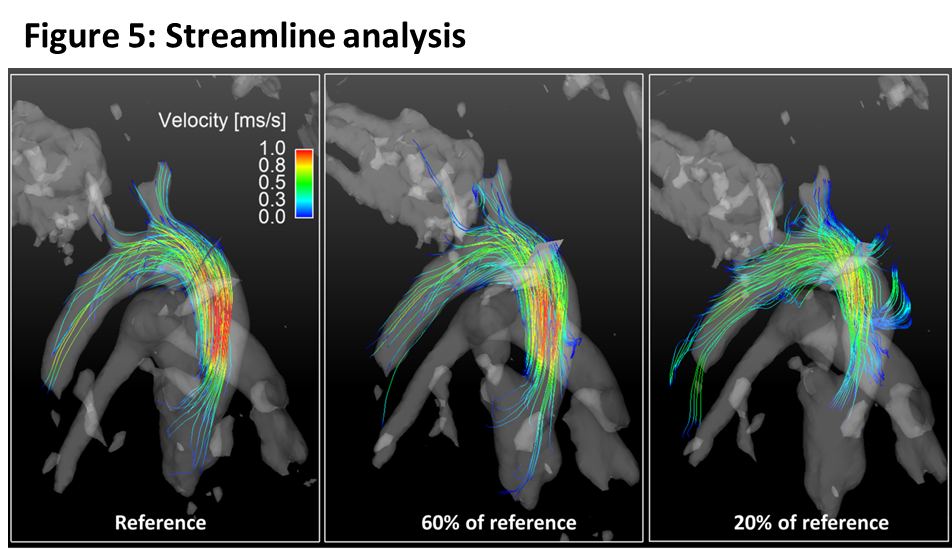
With higher USF, the difference in peak velocities compared to the reference data increase (figure 2) and also show larger variations (higher standard deviation). Higher USF also yielded decreased peak flow values (figure 3) and wall shear stress (figure 4) over the heart cycle. Streamline analysis (figure 5) shows erroneous streamlines for low velocities with USF greater than 12.5x that cannot be attributed to normal animal physiology. For higher velocities streamlines remain consistent showing reduced values.Discussion
In this study we investigated different USF in combination with compressed sensing in mouse aortic radial PC MRI. Higher USF lead to decreased peak velocities values, lower peak flow values and a strong underestimation of systolic wall shear stress. However, mean time to peak flow and time to peak wall shear stress values remained consistent for all USFs except for the highest value. The two datasets with USF of 7.5x (reference) and 9.5x generally appear in good agreement, whereas for the highest USF strong deviations were found in nearly all analyzed parameters. This can be attributed to insufficient amount of data for reconstruction. Further, the phase offset correction carried out for each dataset separately might also negatively impact quantitative results because with increasing USFs the separation of static tissue becomes more difficult.
In comparison to previous publications, we found that it is possible to accelerate the data acquisition from 2 hours2 to 54 minutes (9x undersampling: 43 minutes), while increasing the resolution from (isotropic) 230µm 2 to 180µm.
Peak velocities and other peak values might be analyzed with higher USF, but it needs to be evaluated whether correction factors can be developed that compensate for their underestimation.
Conclusion
An analysis of highly accelerated radial PC MRI for preclinical imaging is presented. We found that acceleration factors of more than 9 compared to a fully sampled radial acquisition are feasible without comprising quantification. These findings might enable high resolution 4D-flow acquisitions to analyze flow in mouse models of disease. Even higher acceleration may be possible if appropriate velocity correction methods are developed.Acknowledgements
No acknowledgement found.References
1. Braig, M. et al. Preclinical 4D-flow magnetic resonance phase contrast imaging of the murine aortic arch. PLOS ONE 12, e0187596 (2017).
2. Krämer, M. et al. Cardiac 4D phase-contrast CMR at 9.4 T using self-gated ultra-short echo time (UTE) imaging. J. Cardiovasc. Magn. Reson. 19, 39 (2017).
3. Feng, L. et al. Golden-Angle Radial Sparse Parallel MRI: Combination of Compressed Sensing, Parallel Imaging, and Golden-Angle Radial Sampling for Fast and Flexible Dynamic Volumetric MRI. Magn. Reson. Med. Off. J. Soc. Magn. Reson. Med. Soc. Magn. Reson. Med. 72, 707–717 (2014).
Figures