3433
Quantification of 3D aortic wall shear stress using k-t accelerated 4D flow MRI in under 2 minutes: a two center study1Department of Radiology, Northwestern University, Chicago, IL, United States, 2Barts Heart Centre, London, United Kingdom, 3Department of Radiology, Academic Medical Center, Amsterdam, Netherlands, 4University Children's Hospital, Zurich, Switzerland, 5Department of Biomedical Engineering, Northwestern University, Chicago, IL, United States
Synopsis
Our aims were to study the feasibility at two centers of a newly developed k-t accelerated non-navigator gated 2-minute aortic 4D flow MRI sequence and to evaluate its wall shear stress (WSS) estimates. Eleven and 14 healthy volunteers, as well as 10 and 6 patients were scanned at Northwestern University and Barts Heart Centre, respectively. Despite an underestimation of distal aortic WSS in patients when compared to conventional 4D flow, our measurements were sensitive to expected aging and disease-related variations. We confirmed that aortic 4D flow MRI in 2 minutes is feasible and provides consistent WSS measurements.
Introduction
4D flow MRI possesses great potential to investigate aortopathy or valvular dysfunction; however, its clinical use is hindered by long scan times and complex preparation, such as respiration control. We recently developed a rapid 4D flow sequence for the assessment of 3D aortic blood flow in 2 minutes by combining high k-t acceleration, free breathing with no respiratory navigator, and optimized Cartesian ky-kz-space sampling1. In a pilot feasibility study, we demonstrated its ability to provide velocity and flow indices in agreement with conventional 4D flow MRI1. The aims of this study are to 1) expand the feasibility study to a second center, and 2) investigate the performance of the 2-minute 4D flow sequence for the quantification of 3D aortic wall shear stress (WSS), which has been shown to play an important role in the regulation of endothelial cellular function and remodeling2.Methods
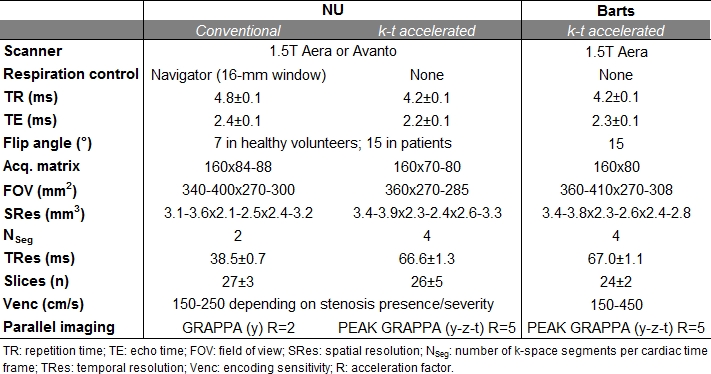
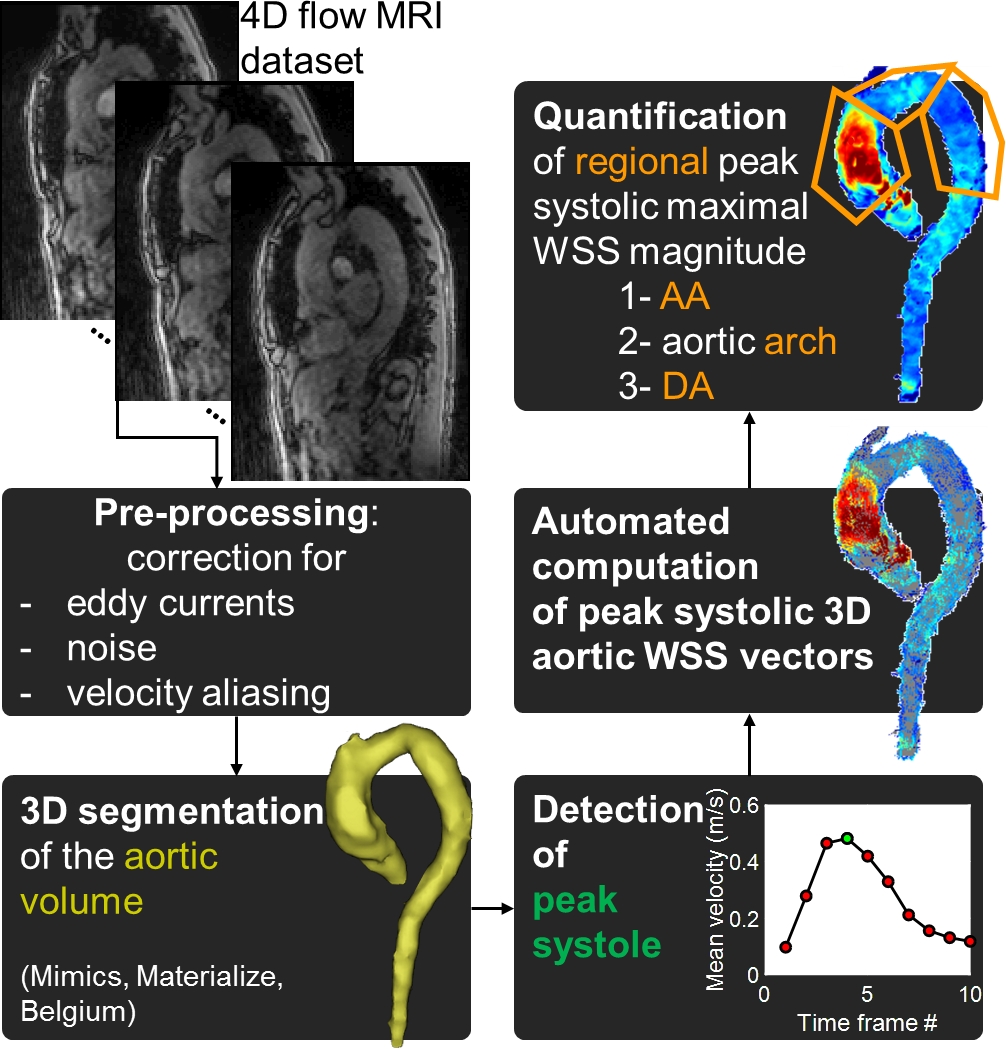
Healthy volunteers (HV) and patients were prospectively recruited at Northwestern University (NU, Chicago, USA) and Barts Heart Centre (London, UK). NU subjects underwent conventional respiration-controlled 4D flow MRI acquired according to current consensus3 and free breathing k-t accelerated 4D flow MRI1 (Table 1). Subjects at Barts underwent k-t accelerated 4D flow MRI only. All scans were acquired on 1.5T scanners (Siemens, Germany) using prospective ECG gating. Gd-contrast agent was intravenously administered in NU patients (Gadavist, Bayer) and in all Barts subjects (Dotarem, Guerbet). As illustrated in Figure 1, after standard analysis of each 4D flow MRI dataset4, 3D WSS was computed using a previously described method5. Peak systolic maximal WSS, averaged over the 2% highest values, was then quantified along the entire wall surface of the ascending (AA) and descending (DA) aorta, as well as the aortic arch. Differences between NU conventional and k-t accelerated 4D flow, as well as between NU and Barts, were tested using Wilcoxon signed rank and Wilcoxon rank sum tests, respectively.Results
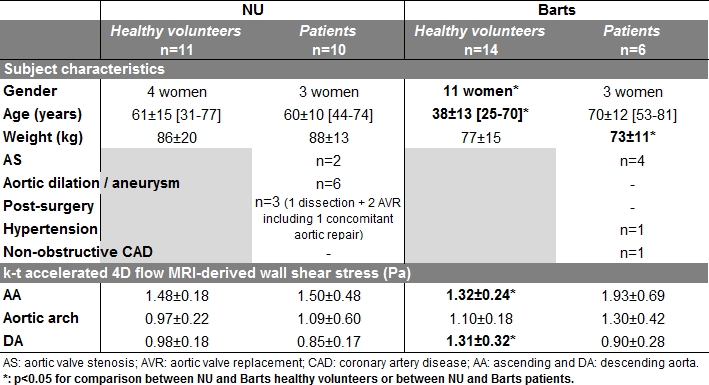
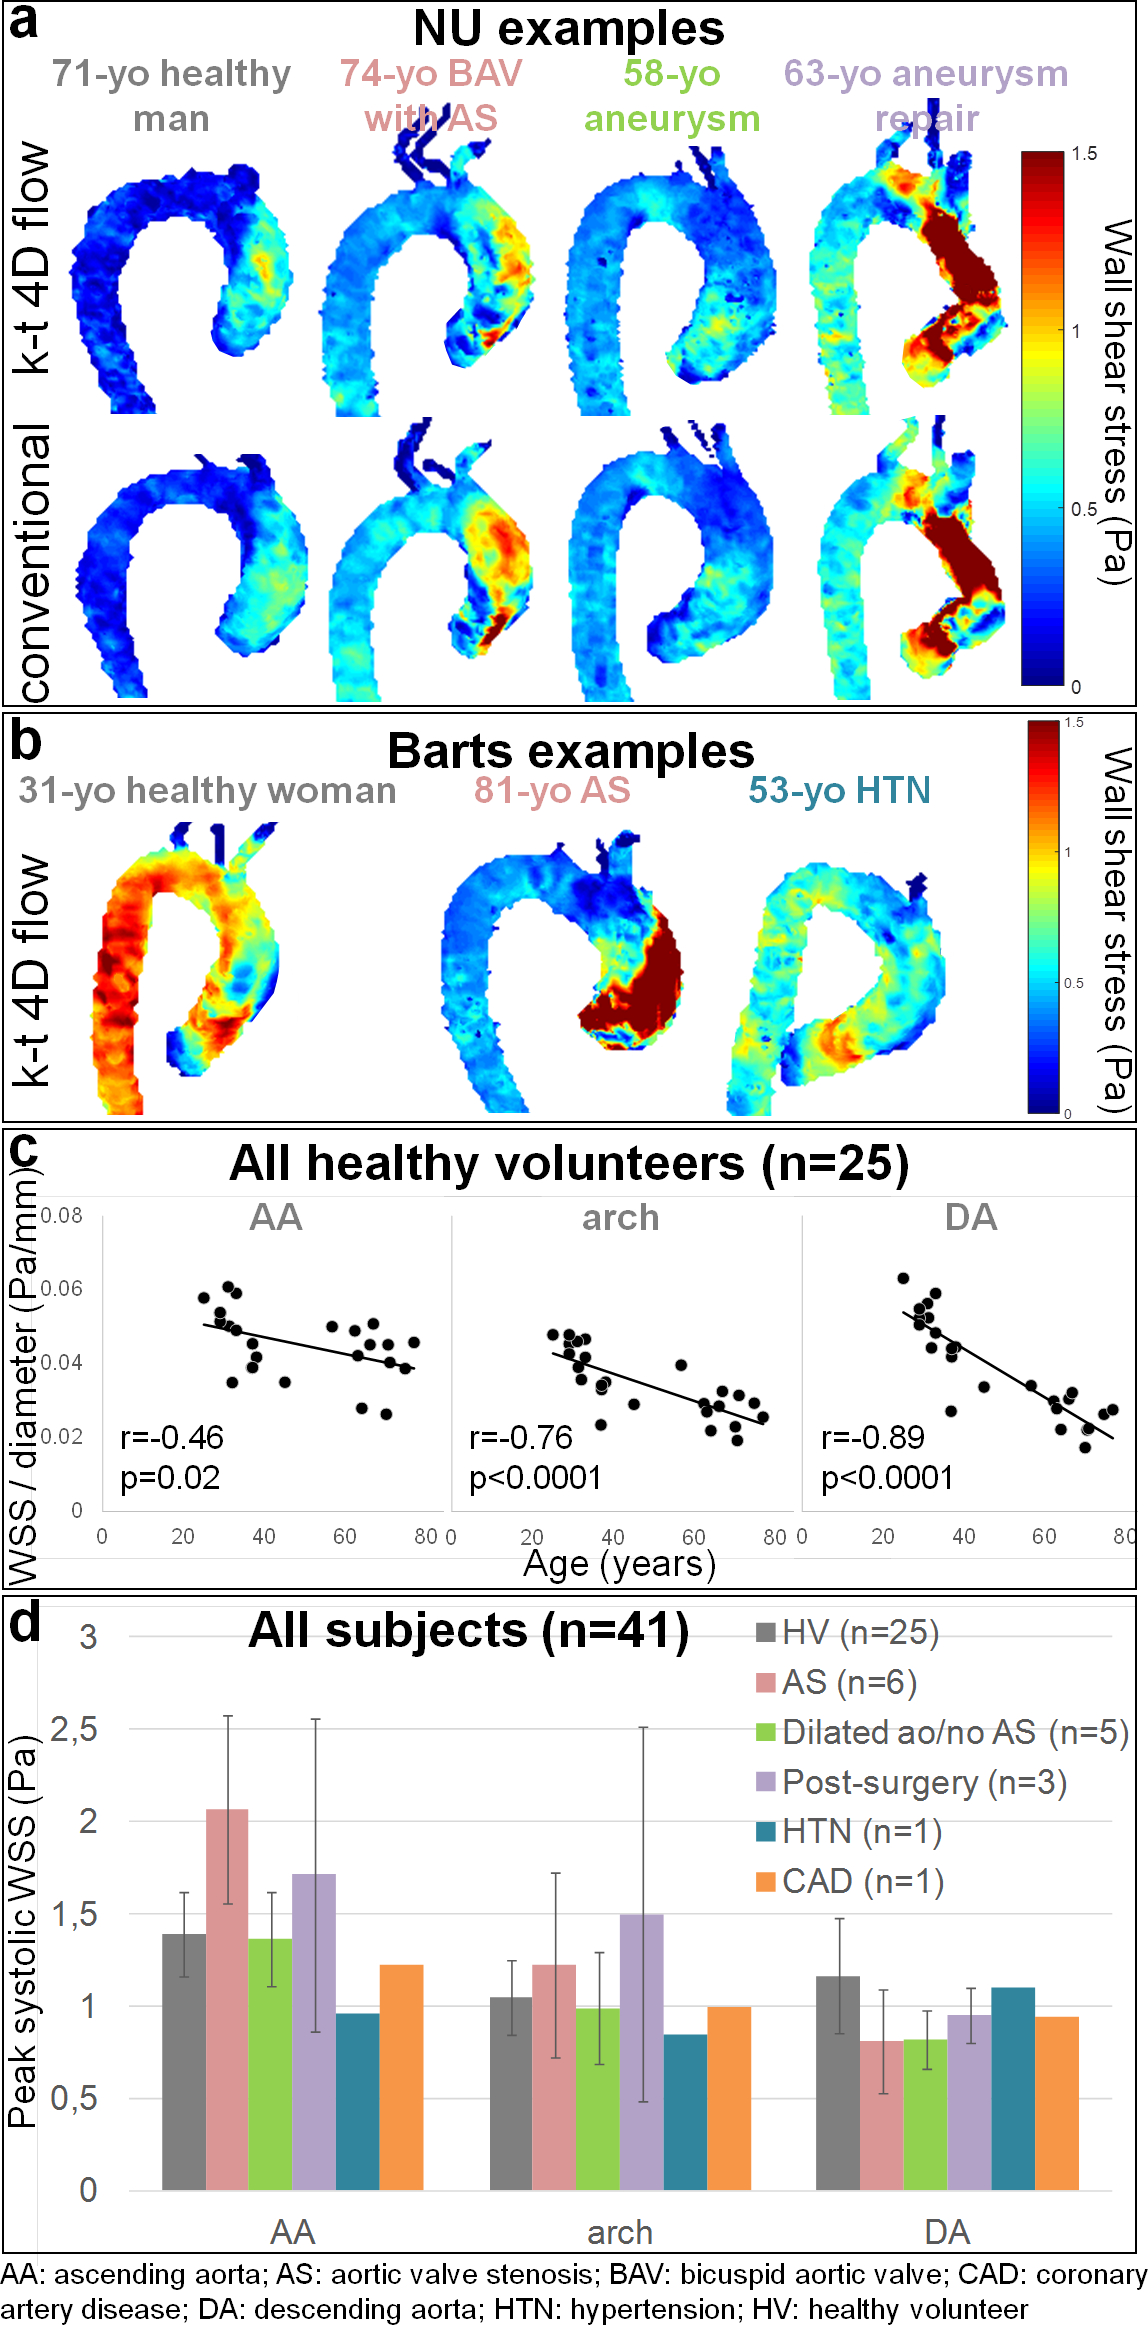
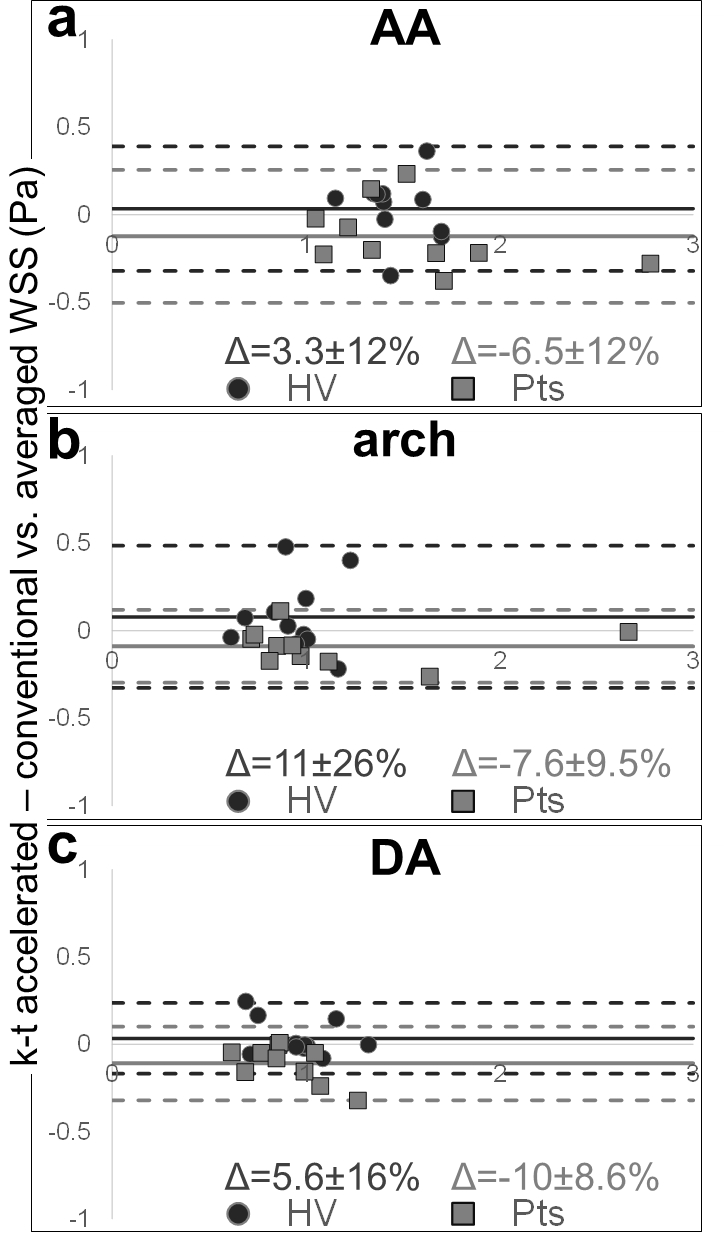
A total of 41 subjects (Table 2) were scanned between NU (n=11 HV, n=10 patients) and Barts (n=14 HV, n=6 patients), confirming scan times around 2 minutes for k-t accelerated 4D flow MRI (NU: 2:00±0.31min; Barts: 2:02±0.27min, p=0.33). HV included significantly more women and were significantly younger at Barts than at NU. NU patients had various aortic diseases, while most Barts patients had aortic valve stenosis (AS). NU data additionally included conventional 4D flow MRI in the 21 subjects (scan time: 12:16±2:16min). Figure 2.a-b provides peak systolic aortic WSS 3D distribution in representative cases. Overall small biases and differences around 10% were found between NU k-t accelerated and reference 4D flow (Figure 3). Differences were significant only distally in the aortic arch (p=0.03) and DA (p=0.006) of patients. However, as expected, pooled NU and Barts data in HV demonstrated significant inverse correlations between age and WSS normalized by aortic diameter (Figure 2.c). Moreover, after subdividing patients (Figure 2.d), we observed expected disease-related tendencies in proximal aortic WSS, such as increase in patients with AS and decrease in patients with a dilated aorta and no AS or hypertension. Of note, WSS was highly variable in the post-surgery subgroup, which might be due to heterogeneous diseases and procedures.Discussion
k-t accelerated 4D flow-derived WSS was significantly underestimated in the distal aorta of patients when compared to standard respiration-controlled 4D flow MRI. However, agreement was obtained in the proximal AA, the most important region affected by disease, as well as in HV at all locations. Despite this underestimation, our WSS measurements were sensitive to expected aging and disease-related alterations. We observed a significant decrease in WSS with age, which was more pronounced distally in the aorta with strong correlations, as previously demonstrated in healthy volunteers6. Furthermore, in agreement with previous studies7, WSS was found to be reduced in patients with a dilated aorta and no AS, while it was higher in AS patients. Finally, WSS was also decreased in the single patient with hypertension8. Our study was limited by the small sample size and heterogeneity of subjects. However, the good agreement between our findings and literature suggests the consistency of our WSS measurements. We are currently recruiting more subjects and expanding our study to additional centers.Conclusion
We demonstrated the feasibility of our 2-minute k-t accelerated aortic 4D flow sequence at 2 centers and its ability to provide consistent WSS measurements. Such efforts are crucial to promote the use of 4D flow MRI in routine clinical use, as well as to allow longitudinal and larger studies needed to investigate the ability of WSS to non-invasively predict future events, such as aneurysm progression, dissection or rupture.Acknowledgements
This work was supported by the National Institutes of Health grants R01HL115828 and K25HL119608 as well as the American Heart Association Midwest Affiliate grant 16POST27250158.References
1. Bollache E, Barker AJ, Dolan RS, et al. k-t accelerated aortic 4D flow MRI in under two minutes: Feasibility and impact of resolution, k-space sampling patterns, and respiratory navigator gating on hemodynamic measurements. Magn Reson Med. 2017 (in press).
2. Dolan JM, Kolega J, Meng H, et al. High wall shear stress and spatial gradients in vascular pathology: a review. Ann Biomed Eng. 2013;41(7):1411-1427.
3. Dyverfeldt P, Bissell M, Barker AJ, et al. 4D flow cardiovascular magnetic resonance consensus statement. J Cardiovasc Magn Reson. 2015;17:72.
4. Schnell S, Entezari P, Mahadewia RJ, et al. Improved Semiautomated 4D Flow MRI Analysis in the Aorta in Patients With Congenital Aortic Valve Anomalies Versus Tricuspid Aortic Valves. J Comput Assist Tomogr. 2016;40(1):102-8.
5. Potters WV, van Ooij P, Marquering H, et al. Volumetric arterial wall shear stress calculation based on cine phase contrast MRI. J Magn Reson Imaging. 2015;41(2):505-16.
6. van Ooij P, Garcia J, Potters WV, et al. Age-related changes in aortic 3D blood flow velocities and wall shear stress: Implications for the identification of altered hemodynamics in patients with aortic valve disease. J Magn Reson Imaging. 2016;43(5):1239-49.
7. van Ooij P, Markl M, Collins JD, et al. Aortic Valve Stenosis Alters Expression of Regional Aortic Wall Shear Stress: New Insights From a 4-Dimensional Flow Magnetic Resonance Imaging Study of 571 Subjects. J Am Heart Assoc. 2017;6(9).
8. Vasava P, Jalali P, Dabagh M, Finite element modelling of pulsatile blood flow in idealized model of human aortic arch: study of hypotension and hypertension. Comput Math Methods Med. 2012;2012:861837.
Figures